Implications
Restricted feeding in pigs is often carried out in the final stages of the finishing period in commercial situations. Compensatory growth feeding regimes that reduce feed intake in the early phases of growth followed by refeeding are reported to promote accelerated weight gain, thereby enhancing efficiency of feed utilisation. In this study, feed-restricted pigs grew faster during refeeding than unrestricted animals. However, in the refeeding period, growth was associated with internal organ growth, whereas skeletal muscle was not affected, suggesting that compensatory growth does not have practical benefits for pig production as the feeding regime did not increase lean carcass growth or reduce the total feed intake.
Introduction
Compensatory (or ‘catch-up’) growth is an accelerated rate of weight gain in animals, which allows access to feed after a period of restricted feeding, such that these animals reach the weight of ad libitum fed control animals (Critser et al., Reference Critser, Miller and Lewis1995). There are conflicting reports on the ability of pigs previously fed on a restricted basis to compensate completely in terms of performance and gross carcass characteristics once refed. The compensatory growth index (CI) is calculated as the ratio of the difference between the weight difference at the end of restricted and compensatory growth periods, respectively, relative to that at the end of the restricted growth period alone (Hornick et al., Reference Hornick, Van Eenaeme, Gerrard, Dufrasne and Istasse2000), thereby indicating whether the animals have been able to compensate during the period of suggested catch-up growth. Although previous studies have shown some degree of compensation, pigs were not able to compensate fully for the weight loss induced by restricted feeding; however, carcass weight and muscle mass of restricted-fed pigs were not significantly different from ad libitum fed pigs (Therkildsen et al., Reference Therkildsen, Riis, Karlsson, Kristensen, Ertbjerg, Purslow, Aaslyng and Oksbjerg2002). Therkildsen et al. (Reference Therkildsen, Vestergaard, Busk, Jensen, Riis, Karlsson, Kristensen, Ertbjerg and Oksbjerg2004) showed that, during compensatory growth, the average daily gain (ADG) increased by 7.7% and 6.5%, and that feed conversion ratio (FCR) improved by 5.9% and 4.7% for pigs that had been restricted at 0.6 of ad libitum intake between 28 to 80 days and 28 to 90 days then refed ad libitum until 140 days, respectively, and the results at similar slaughter weight for meat yield and fat thickness indicated complete compensation. Hornick et al. (Reference Hornick, Van Eenaeme, Gerrard, Dufrasne and Istasse2000) reported that compensatory growth regimes affected the level of plasma IGF-1 with decreased levels during the restriction phase and subsequently elevated levels during the compensatory phase. Through the selection of specific sampling points, the aim of this study was to examine the effect of a compensatory growth regime in pigs on performance, body and carcass composition, as well as plasma level of IGF-1, particularly to establish the more immediate effects of refeeding, after feed restriction, on these growth-related measurements. The hypotheses of the trial were that animals refed following feed restriction would achieve the live weight and gross carcass composition of a parallel control group fed ad libitum throughout.
Material and methods
Animals
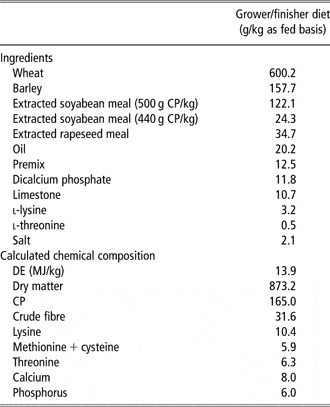
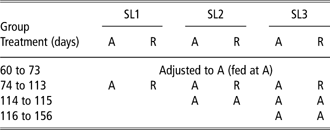
An experiment was conducted using 48 female Large White × Landrace × Duroc cross pigs, which were 60 days old at the start of the trial, with an initial live weight of 25 ± 0.7 kg. The trial was based on performance assessment, measurement of selected muscles/organs and plasma IGF-1 levels with no procedures requiring the Home Office licences utilised. Accordingly, Codes of Practice as laid down by the Department for Environment, Food and Rural Affairs (UK), which considered welfare and space allowances for commercial animals, were applied. The level of restriction imposed on some pigs was 0.70 of ad libitum; this was within the experimental range. In the literature, there are descriptions of various levels of restriction being imposed, but these are usually fixed at a level, which is between 0.60 to 0.80 of ad libitum total feed intake, 0.6 (Kristensen et al., Reference Kristensen, Therkildsen, Riis, Sørensen, Oksbjerg and Purslow2002; Therkildsen et al., Reference Therkildsen, Riis, Karlsson, Kristensen, Ertbjerg, Purslow, Aaslyng and Oksbjerg2002), 0.7 or 0.8 (Prince et al., Reference Prince, Jungst and Kuhlers1983), 0.65 (Heyer and Lebret, Reference Heyer and Lebret2007) or 0.69 (Kristensen et al., Reference Kristensen, Therkildsen, Aaslyng, Oksbjerg and Ertbjerg2004). Experimental protocols were approved by the appropriate Ethics Committee. During the course of the experiment pigs were individually housed in a building which had a controlled environment. All animals were fed a standard grower/finisher meal-based diet (Table 1) ad libitum (A) during acclimation period from the age of 60 to 73 days, with live weight and feed intake being recorded. On day 74, pigs were allocated randomly to three slaughter groups SL1, SL2 and SL3 with slaughter at ages 114, 116 and 156 days, respectively, with each group containing 16 animals (as presented in Table 2). Retrospective examination of the adjustment period (60 to 73 days) indicated no difference between these treatment groups in this period. The animals were either fed ad libitum (A) or 0.70 of ad libitum intake (R) from 74 to 114 days of age (restricted period; 40 days). There were eight pigs in A and R slaughtered at SL1 (114 days). Following the restricted period, all animals were refed ad libitum, with eight A and R pigs slaughtered at SL2 (116 days) following 2 days ad libitum feeding after restriction. This was followed by eight A and R pigs being slaughtered at SL3 (157 days) followed by a total of 42 days of ad libitum feeding (Table 2). The animals were weighed once a week, allowing calculation of growth rate. Feed intake was recorded weekly for both groups. Individual feeders were used in all pens and checked twice daily to ensure that the pigs had ad libitum access to feed during the period of ad libitum intake. Feed was weighed weekly into an external bin and weekly feed intake calculated from the final weight of the bin together with any collected remains. Feeding levels of restricted pigs were determined weekly on the basis of body weight (BW) and average daily feed intake (DFI) of the ad libitum pigs. For restricted feeding, feed intake was calculated from the linear equation (y = ax + b; where y = feed intake, x = live weight from the previous week) then multiplied by 0.70. All pigs were fed twice a day at 0900 h and 1500 h with the weight of their feed being equally distributed between these meal times. They had free access to water at all times. Daily live weight gain (DLWG) was estimated as the slope of the linear regression of time (day) against live weight (kg). FCRs were estimated from estimated DFI and DLWG. All performance data were calculated at the end of the restricted period (for SL1, SL2 and SL3) and the end of the re-alimentation period (for SL3).
Composition of feed (as fed basis)

DE = digestible energy.
Feeding regime of treatments
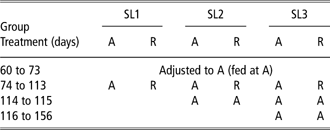
Group: SL1 (slaughter group 1), SL2 (slaughter group 2), SL3 (slaughter group 3).
Treatments: A (ad libitum), R (restriction).
Carcass traits
The pigs were slaughtered on day 114 (SL1, n = 16), on day 116 (SL2, n = 16) and on day 157 (SL3, n = 16). On the morning of slaughter, the pigs received their morning ration at the usual time and then left for 2 h. Subsequently, the first four animals (two restricted and two control) were weighed and transported to the abattoir (distance of 500 m) to be slaughtered immediately. The order of slaughter alternated between restricted feeding and ad libitum feeding, with treatment-paired animals being slaughtered in succession. After the first four animals were slaughtered, the second group of four animals was transported to the abattoir. This strategy was designed to minimise the stress of mixing and isolation. Animals were stunned with low-voltage electricity then bled and eviscerated without scalding; wet weight of internal organs removed within 10 min of slaughter was recorded for heart, liver and kidney. Blood samples were taken immediately after slaughter by jugular puncture and plasma was extracted from blood, snap frozen in liquid nitrogen and stored at −70°C until analysed (Brameld et al., Reference Brameld, Atkinson, Saunders, Pell, Buttery and Gilmour1996). After evisceration the carcass was split, with each half being labelled, and then stored in the chilling room (4°C). After 48 h at 4°C, back fat thickness was measured at the position between rib 12 and 13 (SL3); subsequently, Longissimus dorsi (LD), Psoas major and Semitendinosus muscles were dissected from the left side of the carcass, trimmed of visible fat and then weighed. From the dissected LD muscle, samples were cut perpendicular to muscle fibre organisation and the chops were vacuum packaged and kept at −20°C overnight then stored at −70°C until assessed for intramuscular fat (IMF).
Determination of plasma IGF-1
Plasma IGF-1 was analysed by the active mouse/rat IGF-1 ELISA kit (enzyme-linked immunosorbant assay; Diagnostic systems laboratories, Inc., Heidelberg, Germany). The quantification of IGF-1 was determined by dual-wavelength absorbance measurement at 450 nm and between 600 and 630 nm (Tecan Sunrise, Reading, UK). A set of IGF-1 standards with concentrations of 25, 50, 250, 1000, 2000 and 3000 ng/ml was used to plot a standard curve; the IGF-1 concentration in the samples were then calculated from this standard curve. The analytical sensitivity of the assay to detect the lowest level of mouse/rat IGF-1 with 95% confidence is 1.3 ng/ml (Diagnostic systems laboratories, Inc.).
Determination of IMF
Frozen tissue samples were crushed in liquid nitrogen with a pestle and mortar then freeze-dried until weight stable, pulverised and kept at −20°C before chemical analysis. The IMF content was determined by petroleum ether extraction (Soxtherm, Gerhardt, Germany) according to the Association of Official Analytical Chemists (AOAC, 1995). Briefly, a freeze-dried sample was extracted with petroleum ether, which dissolved fats, then the solvent was evaporated and the fat residue was weighed.
Statistical analysis
Statistical analysis was performed using GenStat (VSN International Ltd, Oxford, UK). Effect of feeding regime was studied by ANOVA using the General Procedure of GenStat; the statistical model was two feeding levels and eight blocks (the positions of the pen in the pig house). Owing to the strong effect of animal age between each slaughter group, statistical analyses were performed within each slaughter group.
Results
Performance
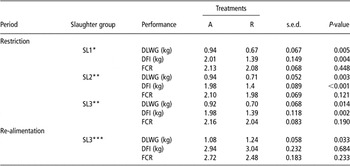
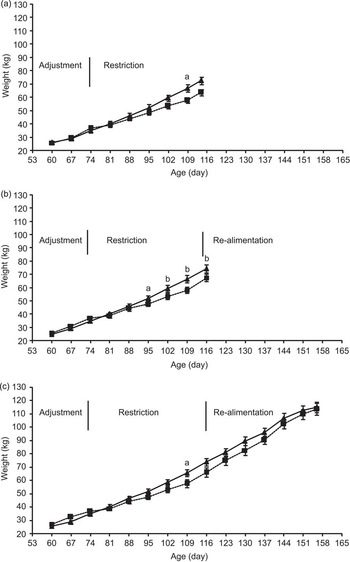
For each of the groups subsequently slaughtered at different times, as would be expected, those experiencing restriction consumed less food than those ad libitum (P = 0.004), and DLWG of R pigs was reduced by 25.8% (P = 0.005). Feeding regime had no effect on FCR during the restriction period except in SL2 in which FCR of R pigs tended to be lower than A pigs (P = 0.080). In the re-alimentation period for SL3, R pigs grew 12.9% faster (P = 0.033), thereby indicating compensatory growth (Table 3). For the SL1 group, following 5 weeks (109 days of age) of restricted feed intake, there was a trend for R pigs to have a lower weight than A pigs (P = 0.071; Figure 1). During the feed restriction period, for the SL2 group there was as a trend (P = 0.070) at week 3 (95 days of age) for the R group to have a lower weight, which was then significant (P < 0.05) after week 4 (102 days of age) until the slaughter date (116 days of age). In the SL3 group, R pigs had a trend for lower weight than A pigs after 5 weeks (109 days of age) of feed restriction (P = 0.079) but following this, during refeeding period, there was no significant difference between live weight of the two groups (Figure 1). At SL3, which was at a point following a restricted feeding for 40 days and then ad libitum for 42 days before slaughter, the CI, as described by Hornick et al. (Reference Hornick, Van Eenaeme, Gerrard, Dufrasne and Istasse2000), was 0.87.
Growth performance during restriction phase in three slaughter groups and subsequent re-alimentation phase in SL3 (n = 8, as indicated)

DLWG = daily live weight gain; DFI = daily feed intake; FCR = feed conversion ratio.
Treatments: A (ad libitum), R (restriction).
*For SL1, performance covers the cumulative period of restriction (age 74 to 113 days).
**For SL2 and SL3, performance covers the cumulative period of restriction and then refeeding for 2 days (age 74 to 115 days).
***For the re-alimentation period for SL3, performance covers the cumulative period refeeding for 40 days (age 116 to 156 days).
Body weight changes (average BW ± s.e.m.) over the time course for animals in ad libitum feeding group (A; n = 8; ▴) and restricted feeding group (R; n = 8; ▪); a = slaughter group 1, b = slaughter group 2, c = slaughter group 3. Means differ when compared between treatments in each week, aP < 0.1 and bP < 0.05, respectively.

Body and carcass composition
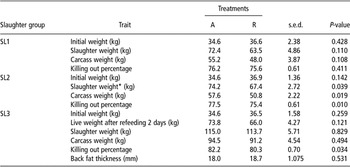
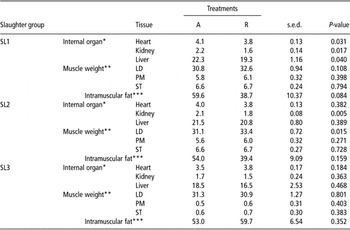
The initial live weight of pigs following the 2-week adjustment period (60 to 73 days) was not significantly different between ad libitum fed and restricted-fed pigs in all three slaughter groups as shown in Table 4. The final live weight following restricted feeding in R pigs was slightly less than A pigs at SL1 (P = 0.110) and SL2 (P = 0.039), whereas after refeeding for 42 days at SL3 there was no significant difference. R pigs had a slightly lower carcass weight than A pigs in SL1 (P = 0.108) and SL2 (P = 0.019), whereas killing-out percentage was not different in SL1; however, killing-out percentage of A pigs at SL2 showed higher value than R pigs (P = 0.010). In SL3, live weight and carcass weight were not different between A and R pigs, whereas killing-out percentage of A pigs was higher than R pigs (P = 0.034). As indicated in Table 5, at SL1 a proportion of live weight of the heart, kidney and liver was significantly greater in A pigs (P < 0.05). At SL2, only the weight of the kidney of A pigs was a greater proportion of live weight than R pigs (P = 0.005), and there was no difference in the internal organ weight in proportion to live weight between the feeding groups at SL3. For dissected mass of specific muscles, when expressed as a proportion of carcass weight, only the LD in R pigs showed higher values than A pigs, at SL1; P = 0.108 and SL2; P = 0.015, respectively, whereas there was no significant difference in SL3. There were no differences in the muscle weight in proportion to carcass weight throughout the slaughter dates. At SL1, R pigs had a trend for lower IMF level than A pigs (P = 0.084), whereas it was slightly lower after refeeding for 2 days at SL2 (P = 0.159), although there was no trend at SL3 in the back fat thickness (Table 4) and content of IMF (Table 5).
Effect of feeding regime on body and carcass weight in each slaughter group (n = 8)

Treatments: A (ad libitum), R (restriction).
*Slaughter weight at SL2 covers the cumulative period of restriction and then refeeding for 2 days.
Effect of feeding regime on proportion of tissue weight to live weight or carcass weight as well as proportion of LD intramuscular fat in each slaughter group (n = 8)

LD = Longissimus dorsi; PM = Psoas major; ST = Semitendinosus.
Treatments: A (ad libitum), R (restriction).
*g/kg live weight.
**g/kg carcass weight.
***g/kg dry weight.
Insulin-like growth factor 1
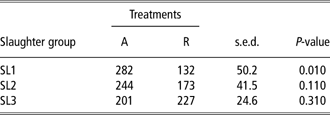
At SL1, the restricted-fed pigs had 53% lower levels of plasma IGF-1 than the control (P = 0.010) but, after refeeding the restricted group for 2 days at ad libitum levels (SL2), the plasma IGF-1 levels of R pigs was slightly lower than A pigs (P = 0.110), there being no significant difference between the groups after full compensation in SL3 (Table 6).
Effect of feeding regime on the level of plasma IGF-1 (ng/ml) in each slaughter group (n = 8)
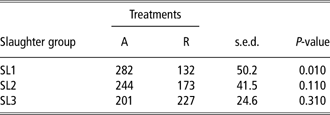
Treatments: A (ad libitum), R (restriction).
Discussion
In this study, as would be expected, during restriction period DFI was lower in R pigs than A pigs, as was DLWG. After being refed ad libitum for 42 days in SL3, DFI was not significantly different, whereas DLWG of R pigs was greater than A pigs. The greater DLWG of restricted group during the refeeding period was in agreement with the results of previous studies (Mersmann et al., Reference Mersmann, MacNeil, Seideman and Pond1987; Critser et al., Reference Critser, Miller and Lewis1995; Heyer and Lebret, Reference Heyer and Lebret2007), whereas Therkildsen et al. (Reference Therkildsen, Vestergaard, Busk, Jensen, Riis, Karlsson, Kristensen, Ertbjerg and Oksbjerg2004) showed lower DLWG in restricted-fed pigs (P < 0.001). Heyer and Lebret (Reference Heyer and Lebret2007) reported that R pigs had lower DFI during restriction, whereas in the re-alimentation period they showed greater DFI than the control. There are conflicting reports of the effect of re-alimentation during a compensatory growth on DFI, with higher DFI (Mersmann et al., Reference Mersmann, MacNeil, Seideman and Pond1987), and no effect on DFI (Prince et al., Reference Prince, Jungst and Kuhlers1983; Therkildsen et al., Reference Therkildsen, Vestergaard, Busk, Jensen, Riis, Karlsson, Kristensen, Ertbjerg and Oksbjerg2004) being obtained. In this experiment, at the beginning of the ad libitum refeeding phase in SL3, R pigs had higher DFI but not over the whole period, which resulted in the average DFI not being significantly different in the re-alimentation period (Table 3). In this study, the improvement in DLWG was sufficient to compensate as the CI was 0.87. In contrast, Therkildsen et al. (Reference Therkildsen, Riis, Karlsson, Kristensen, Ertbjerg, Purslow, Aaslyng and Oksbjerg2002) reported that pigs offered 0.6 of ad libitum for 28 days then subsequent fully fed for 42 days had a CI 0.57. There was no effect on FCR during the restricted feed intake phase of compensatory growth feeding regime for all the groups; although not significant, the restriction phase did have a positive effect on FCR in the different groups with an improvement ranging from 2.3% (SL1) to 5.7% (SL3). In addition, restricted feeding was associated with a positive effect on FCR during the re-alimentation phase of the feeding regime (42 days at ad libitum) in the SL3 group (a 8.8% improvement relative to the A pigs, P = 0.233). There are conflicting reports on the effect of FCR. Therkildsen et al. (Reference Therkildsen, Vestergaard, Busk, Jensen, Riis, Karlsson, Kristensen, Ertbjerg and Oksbjerg2004) reported a positive effect, whereas Heyer and Lebret (Reference Heyer and Lebret2007) reported a negative effect. Relative to ad libitum fed animals, Therkildsen et al. (Reference Therkildsen, Vestergaard, Busk, Jensen, Riis, Karlsson, Kristensen, Ertbjerg and Oksbjerg2004) reported better FCR during the restriction period (0.6 of ad libitum feed intake) from 28 days to 80 days or 90 days (P < 0.001), as well as the refeeding period up to 140 days, which was an approximate BW of 100 kg (P = 0.05). In addition, they also found that there was a significantly better FCR value for the overall period of the restriction until the end of refeeding compared to ad libitum feeding throughout (P < 0.001). Heyer and Lebret (Reference Heyer and Lebret2007) reported a trend for a better FCR during restriction period between 30 and 70 kg BW in restricted-fed pigs (0.65 of ad libitum feed intake; P = 0.065), whereas there was a worse FCR (P = 0.001) after refeeding between 70 and 110 kg BW.
The lower growth performance of R pigs during restriction period decreased live weight and carcass weight, but had no effect on killing out at SL1. In the re-alimentation period, after being refed ad libitum for 2 days (SL2), as might be expected, live weight and carcass weight of R pigs was still lower than A pigs, whereas killing-out percentage of A pigs was higher than R pigs (P < 0.05). In SL3, although there was no difference in live weight and carcass weight, indicating that full compensation occurred at this level, the killing-out percentage of R pigs was significantly lower than in A pigs. These results suggest that the compensatory growth feeding regime had affected tissue depots but was not associated with the dressed carcass. In SL1, R pigs had a lower internal organ weight as a proportion of live weight than A pigs, and this appeared to compensate in SL2, although the kidney remained significantly lower. In the case of the liver, this compensation may have reflected the accumulation of metabolites, such as glycogen, after being introduced to a higher plane of nutrition. At SL3, there was no difference in any of the internal organs weight as a proportion of live weight. Furthermore, as a proportion of carcass weight LD muscle of R pigs showed slightly higher value than A pigs at SL1 and SL2 (the absolute wet weight of the muscle was not significantly different at these points nor at SL3; data not shown), but this muscle was not different at SL3, suggesting that compensatory growth had no effect on muscle tissue weight but did influence internal organs. Overall, these results indicate that the compensatory growth during the re-alimentation period occurred due to increased internal organ weight and fat deposition in accordance with Mersmann et al. (Reference Mersmann, MacNeil, Seideman and Pond1987), Bikker et al. (Reference Bikker, Verstegen, Kemp and Bosch1996) and Therkildsen et al. (Reference Therkildsen, Riis, Karlsson, Kristensen, Ertbjerg, Purslow, Aaslyng and Oksbjerg2002 and Reference Therkildsen, Vestergaard, Busk, Jensen, Riis, Karlsson, Kristensen, Ertbjerg and Oksbjerg2004). In this study, IMF content in R pigs was lower than A pigs during the restriction period and slightly lower after refeeding for 2 days; however, there was no difference after full compensation. Therefore, compensatory growth appeared to modify carcass composition by increasing fat deposition, as indicated by the IMF weight reaching the same level as the control in the subsequent re-alimentation period, in agreement with Donker et al. (Reference Donker, Hartog, Brascamp, Merks, Noordewier and Buiting1986), Therkildsen et al. (Reference Therkildsen, Riis, Karlsson, Kristensen, Ertbjerg, Purslow, Aaslyng and Oksbjerg2002), Kristensen et al. (Reference Kristensen, Therkildsen, Aaslyng, Oksbjerg and Ertbjerg2004) and Heyer and Lebret (Reference Heyer and Lebret2007) who reported that IMF and/or back fat thickness were not different after refeeding.
Previous studies indicate that changes in IGF-1 are associated with periods of changes in growth. Given that IGF-1 is known to affect growth, it is probable that it plays a role in the processes that stimulate compensatory growth. IGF-1 regulates postnatal growth and, in part, mediates the growth-promoting effects of growth hormone (GH) (Stewart and Rotwein, Reference Stewart and Rotwein1996). Individually, both GH and IGF-1 are growth regulators with GH also stimulating hepatic IGF-1 production, which acts on target tissues to promote cell proliferation, differentiation and ultimately body growth (Ohlsson et al., Reference Ohlsson, Sjogren, Jansson and Isaksson2000; Picha et al., Reference Picha, Turano, Tipsmark and Borski2008). There is a considerable body of evidence demonstrating effects of IGF-1 on growth and metabolic regulation in animals, and there is a significant positive relationship between plasma IGF-1 levels and growth performance in pigs (Owens et al., Reference Owens, Conlon, Campbell, Johnson, King and Ballard1991). In this experiment, restricted feeding decreased the level of plasma IGF-1, which recovered after refeeding to ad libitum levels for 2 days. This is in broad agreement with previous studies in which the level of IGF-1 was found to be reduced during a restriction period, but following refeeding to ad libitum levels increased to the point in which its level reached the same as the control group (Renaville et al., Reference Renaville, Van Eenaeme, Breier, Vleurick, Bertozzi, Gengler, Hornick, Parmentier, Istasse, Haezebroeck, Massart and Portetelle2000; Therkildsen et al., Reference Therkildsen, Vestergaard, Busk, Jensen, Riis, Karlsson, Kristensen, Ertbjerg and Oksbjerg2004). Whang et al. (Reference Whang, Kim, Donovan, McKeith and Easter2003) reported that the pigs fed the 9% CP diet had a lower level of plasma IGF-1 than pigs fed the 18% CP diet during the depletion phase, whereas there was no effect of compensatory growth on plasma IGF-1 level during re-alimentation period. Although increased IGF-1 levels are associated with increases in growth, it is the level of GH that is predominantly responsible for regulating its production along with nutrients (Yakar et al., Reference Yakar, Kim, Zhao, Toyoshima, Pennisi, Gavrilova and LeRoith2005). For example, in pigs, during food restriction circulating IGF-1 concentrations and hepatic IGF-1 mRNA decreased, whereas they were increased by the administration of exogenous porcine GH (Caperna et al., Reference Caperna, Steele, Komarek, McMurtry, Rosebrough, Solomon and Mitchell1990; Brameld et al., Reference Brameld, Atkinson, Saunders, Pell, Buttery and Gilmour1996). It has been well characterised that the increase in the GH–IGF axis is associated with the increase in growth. Administration of exogenous GH to pigs results in increased muscle mass, and this is associated with increased IGF-1 levels (Dunshea et al., Reference Dunshea, Chung, Owens, Ballard and Walton2002). The changes in IGF-1 level in this study appear to be associated with the changes in nutrition. In the group experiencing extended re-alimentation after restriction (SL3), the IGF-1 level was not statistically greater than the ad libitum group. The change in IGF-1 levels may be sufficient to stimulate an increase in muscle growth, or there may be a change in sensitivity of the muscles after the restricted period as suggested by Therkildsen et al. (Reference Therkildsen, Vestergaard, Busk, Jensen, Riis, Karlsson, Kristensen, Ertbjerg and Oksbjerg2004); however, it is not clear whether these changes in IGF-1 are responsible for the compensatory effect.
Acknowledgements
This study has been supported by a studentship from the Royal Thai Government and The University of Nottingham, UK. Z. Daniel, J. Corbett and D. Bozon are gratefully acknowledged for their technical assistance in this experiment, and J. Craigon for statistical advice.