

Introduction
Between 1942 and 1945, the lethal triumvirate of war, weather, and human agency combined to create four great Asian famines. Two of these, in Bengal and Henan, have been extensively researched.Footnote 1 Less well documented are those that took place in 1944–1945 which claimed a million lives in Vietnam and led to 2.4 million deaths on the Indonesian island of Java.Footnote 2
This article has two aims. One, fundamentally empirical, is to address the issue of whether famines in Vietnam and Java were distributional or due to a deficit in food availability. While Sen recognizes the difficulties of analysing famine in the context of war, he maintains, most famously in the case of Second World War Bengal, that famines can be explained by maldistribution.Footnote 3 In other words, even though the amount of available food may fall, enough still exists to feed everyone. People starve because they lack sufficient entitlements to command enough of the available food.
The alternative explanation, of which Ó Gráda is a principal proponent, but with which many concur, is that an absolute shortfall in food can often be demonstrated to account for famine.Footnote 4 Food availability deficit (FAD) famines pose an empirical question: was the decline sufficiently large that available food, even if more or less equally divided, was inadequate to sustain the existing population? This article quantifies food availability in Vietnam and Java, and establishes that there was simply not enough food to go around, even if it had been approximately equally distributed.
An analysis of famine inevitability and preventability is the article's other main aim. I argue that in a famine area, in the context of war, while decisions for war and the existence of erratic weather are exogenous, human agency is not. Voluntary action may avert a potentially avoidable famine or may fail do so, possibly due to misguided policies. The article contends that the second of these two possibilities applied to both Java and Vietnam. In Java, policies enacted by the occupying Japanese military led to mass famine. The Vietnam famine, notwithstanding highly unfavourable weather and wartime bombing, might well have been sidestepped if one or more of three main groups had moved to supply food to the famine-affected Tonkin delta and North Annam. Those whose decisions could have made a difference included the French, who administered the country as a pro-Vichy regime until the 9 March 1945 Japanese coup, the Japanese military which occupied Vietnam from 1941 onwards, and the Americans who bombed the country.
In exploring human agency, the article draws on the work of Ellman and his distinction between FAD1 and FAD2 famines.Footnote 5 For the former, feasible human actions to avoid famine do not exist. Ellman shows this to be true of the 1941–1944 starvation of Leningrad and Ó Gráda identifies the Great European famine of the 1310s as falling into the FAD1 category.Footnote 6 By contrast, FAD2 famines are differentiated by the existence of ‘feasible policies that could have prevented the famine or greatly reduced the number of victims’.Footnote 7 This article demonstrates that the famines in both Java and Vietnam were FAD2 and indicates what could have been done to avert them.
Even in a FAD2 famine, entitlements matter. An account that utilizes the concepts of endowments and entitlements shifts the focus from the Malthusian nature of FAD famines towards uncovering which population groups were most at risk. In Vietnam and Java, the landless and those dependent on wage labour were by far the most likely to die during the famine. And although famine occurred largely in the countryside, many of its victims died in Hanoi, Haiphong, or Jakarta, having walked to these cities in the hope of finding food.
Famine magnitude
In both Vietnam and Java, the total number of famine victims is impossible to establish, as is the case for most famines.Footnote 8 Estimates of Vietnam's famine-induced deaths vary from a lower boundary of about 700,000 to an upper one of two million people. The latter, although enshrined in Vietnam's Declaration of Independence and communist mythology and accepted by some observers, is generally regarded as too high.Footnote 9 A semi-official figure of 1.3 million deaths appears in a November 1946 report, apparently based on an earlier report dated 13 November 1945, stating that in 1945 over one million people died of famine in northern Vietnam and 300,000 in central Vietnam. However, that report does not discuss how the figures were derived.Footnote 10 The best reckoning of total famine deaths, which include both Tonkin and North Annam in northern Vietnam, is probably Marr's estimate of a million from January through to May 1945 when the famine was at its height.Footnote 11 This figure amounts to 8.3 per cent of the 1943 population of Tonkin and the North Annan provinces of Than Hoa and Nghe An, and 7.9 per cent of the total Tonkin and North Annam (Than Hoa, Nghe An, and Ha Tinh) population of 12,708,700. Accepting a figure of 1.3 million deaths would raise mortality to 10.2 per cent of the 1943 population of all of Tonkin and North Annam. For either one million or 1.3 million, a tighter definition of Vietnam's famine affected area, restricted to the Tonkin delta and North Annam (Than Hoa and Nghe An), would substantially increase mortality percentages to 10 per cent for a million deaths and 13 per cent for 1.3 million. With any of these estimates, excess mortality was as high in relative terms as in 1840s Ireland, and a good deal higher than in 1943–1944 Bengal. Both are regarded as ‘great’ famines and, on that basis, Vietnam in 1944–1945 deserves a similar description.
Famine mortality in Java, although uncertain, probably also ranks as sufficient to constitute it as a great famine. It is clear that by 1944 in Java, as recent histories point out: ‘a very high death rate was recorded’, ‘starvation was widespread’, and people dying by the roadside were a common sight.Footnote 12 At the time, however, there seems to have been, unless this information was in destroyed Japanese records, remarkably little comment on famine or attempts to quantify it. Post-war estimates vary from Jong's some two million, or about one in 20 Javanese, to the approximately three million suggested by Friend, although this includes deaths caused by a lack of medical attention and executions as well as hunger and disease.Footnote 13 De Vries arrives at a total of 2.45 million ‘lost souls’ but this seems to encompass births that would have occurred in the absence of Japanese occupation.Footnote 14 Booth appears to endorse this estimate but does not provide additional evidence.Footnote 15 Reconstruction of demographic data, itself imprecise, affords the only reliable means of attempting to quantify Java's famine. Van der Eng provides a thorough analysis of available data and his figure of about 2.4 million deaths above normal mortality is probably near the truth.Footnote 16 While a staggering number, at around 5.7 per cent of Java's population of about 42 million, this was, in terms of proportionate impact, well below the Vietnamese famine.
Ecology and population pressure
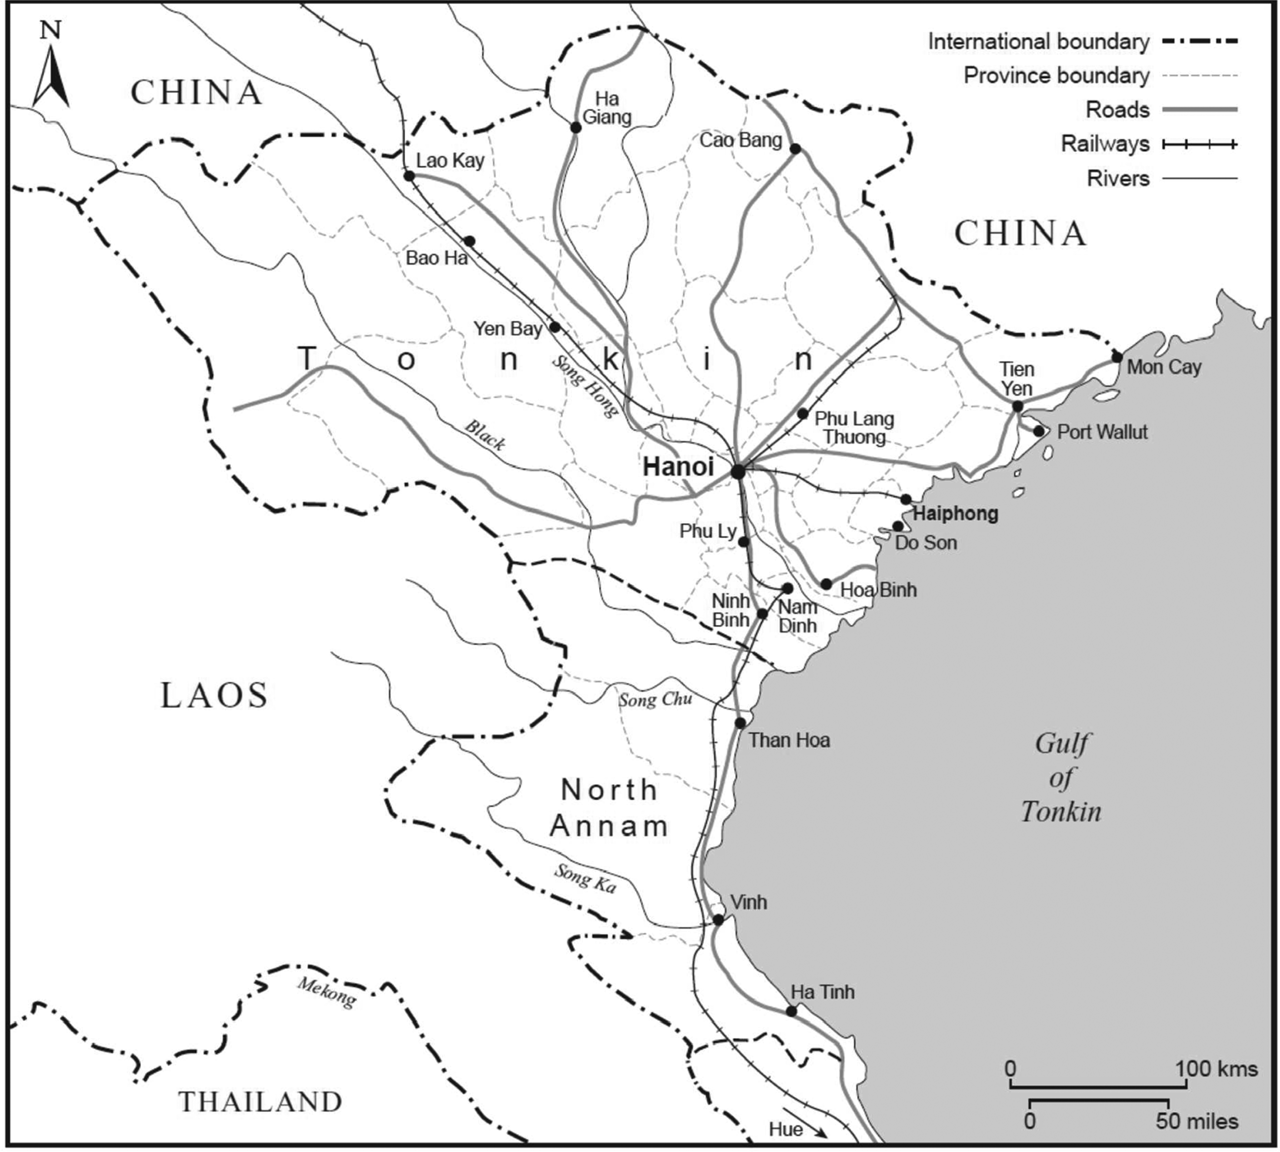
Both Vietnam and Java had complex ecologies and fragile equilibria between population and food. In Vietnam, ingenuity and, from the late nineteenth century, French engineering allowed large increases in rice production in both the Red River delta in Tonkin in the north of Vietnam (see Figure 1) and the Mekong River delta in Cochinchina in Vietnam's south.
North Vietnam's railways, roads, and rivers.

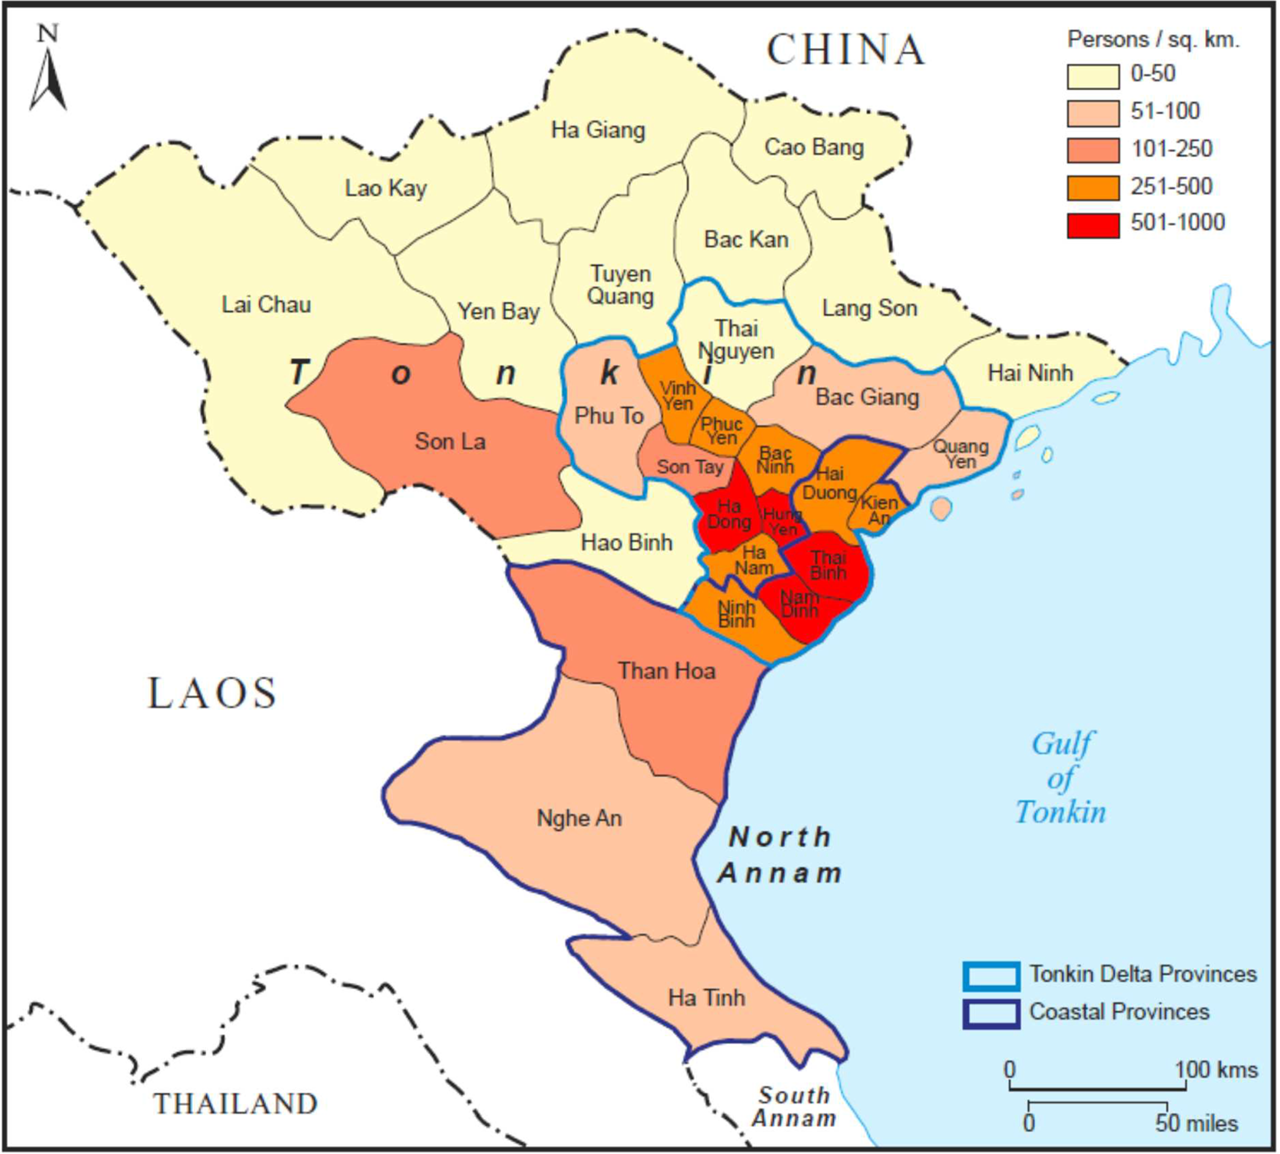
The contrast between the two deltas, separated by some 1,700 kilometres, could, however, hardly have been sharper. In Cochinchina, an extensive system of French-constructed canals, which linked existing waterways and enabled substantial inwards migration, transformed frontier land into one of the world's three major rice-exporting areas. French hydrology had a quite different impact on northern Vietnam. Dykes holding back the Red River (also called the Song Hong, as in Figure 1) prevented most of the delta from being flooded and allowed rice production to expand and Tonkin's delta provinces to become among the world's most densely populated areas (see Figure 2). Population continuously pressed against food availability in a way that was Malthusian. Rice was intricately cultivated and, as early as the 1920s, Tonkin's population consumed as food some 80 per cent of the rice it produced.Footnote 17
Tonkin and North Annam population density, 1943.

Acute overpopulation, both in Tonkin and to the south of North Annam, was accommodated only through a highly unequal social structure that left most people vulnerable to shocks. In the late 1930s, the delta population of some seven million included between two and three million day labourers and a further million unemployed or underemployed.Footnote 18 Between 50 and 60 per cent of families were virtually or wholly landless. Unpredictable, often violent, tropical weather placed these people at risk: ‘in a normal year the poorest section of the population (50 per cent to 60 per cent) is barely sustained, but only slightly unfavourable circumstances suffice to make this population suffer from a dearth in the pre-harvest season’.Footnote 19 The poor typically ate only one meal a day and had enough to eat for no more than four months of the year, mainly after harvests, which was also the only time they could achieve a predominantly rice diet. Otherwise, they relied on somehow being able to buy or borrow rice and on greater consumption of potatoes, corn, and taros.Footnote 20
Java's ecology produced a system of food crop cultivation which, extending over much of the available land, was divided between irrigated and non-irrigated regions. The former, known locally as sawah, consisted of flooded fields in lowlands and on terraced hillsides; in farm agriculture, this was used almost exclusively to grow rice. Non-irrigated, rain-fed fields also produced rice, but were generally used to grow other crops including cassava, maize, and sweet potatoes.
Because mineral plant food was carried in water, sawah cultivation was capable of greater expansion than would have been the case had rice been dependent wholly on its immediate soil. However, an obvious constraint on sawah farming was the ability of its farmers to subsist on continuously decreasing marginal returns to labour in rice agriculture under prevailing technologies.Footnote 21 For sawah cultivation, labour and water were essential inputs, the latter required at an average rate of 3.6 to 5.4 gallons per acre per minute on clay soil and over twice that amount on porous loamy or sandy soils.Footnote 22
In the 1890s, Java's population was already seemingly at a natural ceiling and, given the current technology, the island verged on overpopulation. Nevertheless, numbers continue to expand due to intricate irrigation, Java's rich volcanic soil, and migration to upland areas. Important to sawah expansion were public investment in head works and channels for irrigation, and the time and effort individuals spent on irrigation at terminal levels (farmers' fields which received communal village investment) and the drainage of fields. By the 1930s, population density averaged 318 persons per square kilometre, but in parts of central Java, densities were between 500 to over 750 per square kilometre, comparable to the Tonkin delta and the most thickly populated regions of India and China (see Figure 3).
Java population density, 1931.

Plantation agriculture, which covered some 1,378,000 acres, and, to a much lesser extent, factories provided some outlet for Java's large pool of surplus labour. However, plantation and factory work, including Java's many sugar factories, were mostly seasonal and so unstable.Footnote 23 During the war, Javanese estate workers, landless and probably lacking the capital and skills to begin subsistence cultivation, found themselves at serious risk of being unable to obtain food. The problem became more pervasive throughout the war because the Japanese occupation cut off Indonesia from the global economy. Without this market, estate cultivation continuously contracted. By 1944, it had largely ceased.
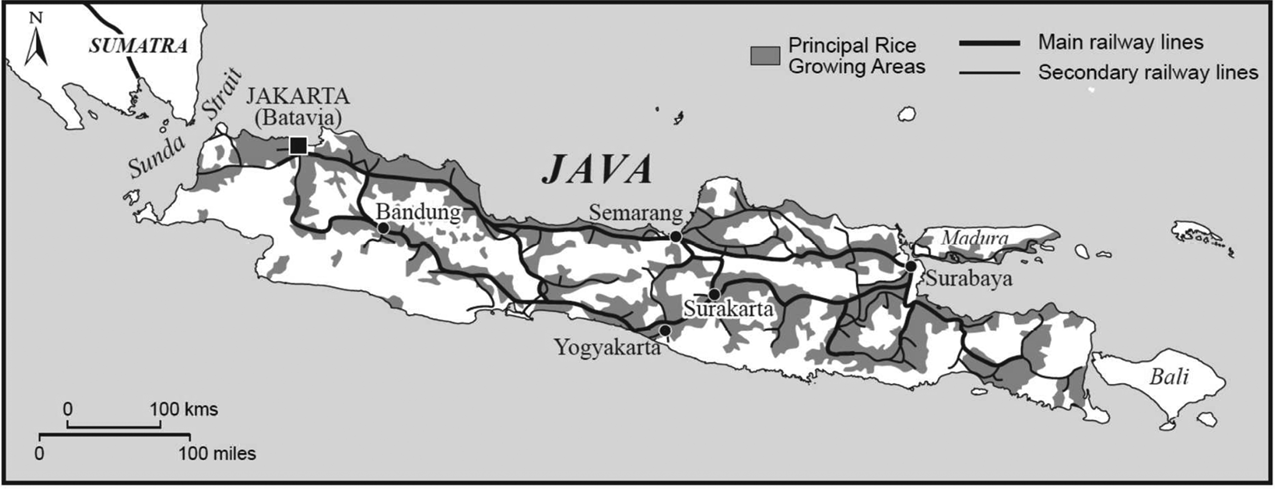
Rice was the Javanese staple and a favoured food, but by the 1930s per capita daily consumption averaged only about 230 grams, and comprised about two-fifths of the average Javanese diet.Footnote 24 To complement rice, pre-war Javanese depended on crops such as cassava, sweet potatoes, maize, and cassava (tapioca). Crucially, Java split into rice-surplus and rice-deficit regions, the latter in the east and south of the island (see Figure 4). Beginning in 1933, although most rice continued to be traded and transported privately, the colonial government initiated a programme of intervention in the rice market to ensure supplies for deficit areas. The flow of rice supplies, and their equalization across provinces, became fundamental to the island's food security. Java's extensive transport network allowed the achievement of a delicate balance of intra-province specialization and interdependence between surplus and deficit regions.Footnote 25 On the eve of the Second World War, Java had become self-sufficient in rice through carefully gauged incentives and an intricate delivery and storage system. In 1941, supplies between surplus and deficit areas were adjusted through the transport of 900,000 tons of rice by rail, 300,000 tons by truck, and 150,000 tons by water, totalling 29.3 per cent of Java's rice harvest.Footnote 26
Principal rice-growing areas, Java, 1940.
Food availability and famine causation
Vietnam had its own delicate food balance which, at times of shortage in the north, relied on shipments from the rice-surplus south.Footnote 27 The war upset that balance. Although some famine was already evident in 1943 in northern Vietnam due to a typhoon in September and a decrease in output at the end of the year, food shortages did not become severe until 1944 after the second rice harvest in November, normally the larger of the two. The typhoon season, which occurs along Vietnam's east coast in late summer and early autumn, was extreme in 1944. Coastal provinces were hit by three successive typhoons and a tidal wave. Between August and October 1944, the total rainfall for Hanoi of 1,180 millimetres was 53.7 per cent above the 1931–1944 average.Footnote 28 While rainfall is one effect of typhoons, it does not capture their consequences in causing rainfall intensity over a short period, high tides to which coastal areas are particularly vulnerable in the rainy season, and, above all, major ruptures in the dykes, the preservation of which was fundamental to preventing large parts of the delta from flooding. As the Red River flowed six to seven metres above the surrounding land, serious breaches in dykes led to severe flooding, and in the coastal provinces 230,000 hectares of rice was destroyed, equivalent to a loss of not far short of 200,000 tons of rice at 1942 yields.Footnote 29 According to a contemporary report from Nam Dinh province, due to the earlier bad weather, the November ‘harvest was almost completely lost’ and 558,383 people were left destitute: ‘[T]hese poor people have absolutely nothing to eat.’Footnote 30
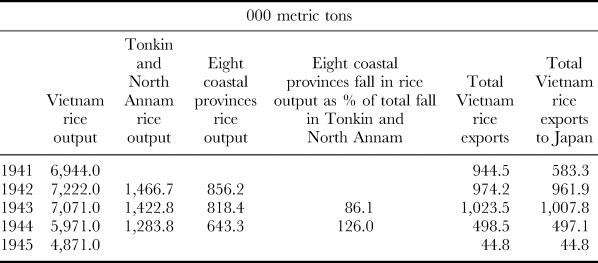
Two main features of the wartime falls in rice output are evident from Table 1. The first is that, overall, they were not large. Between 1942 and 1944, in Tonkin and North Annam output was down 12.5 per cent on the 1942 figure of 1,467 thousand tons.
Vietnam, Tonkin, and North Annam rice output and exports, 1941–1945.

Notes: (1) For 1941 data on rice output by province were not published. (2) The eight coastal provinces are Kien An, Hai Duong, Thai Binh, Nam Dinh, and Ninh Binh in Tonkin, and Than Hoa, Nghe An, and Ha Tinh in Annam. Paddy output is converted to rice at a conversion rate of .6349 which is the conversion given in Gourou, Standard of Living, p. 13. Data for 1944 are for 1943–1944, for 1945 for 1944–1945, and so forth. (3) Rice output and export figures are for Indochina as a whole but the contribution of its non-Vietnam constituents was negligible. (4) Rice exports to Japan include paddy and cargo rice but the great majority of exports was whole white rice. These last were (in tons): 1942: 581,099; 1943: 833,134; 1944: 418,267; 1945: 41,352.
Sources: ‘Rice output and exports: Indochina’, Indochina, Annuaire Statistique, 1941–1942, pp. 87, 176, 188, 283; 1943–1946, pp. 90–91, 188, 277. Data for rice exports to Japan in: NA WO203/2647 S. A.C., S.E.A., Economic Intelligence Division, ‘The rice situation in Cochin China’, p. 3, are close to the same as in the Annuaire Statistique. For shipments of southern rice, see A. Gaudel, L'Indochine Française en Face du Japon, J. Susse, Paris, 1947, p. 230.
The impact of the decline must, however, be assessed in light of the precarious margins of subsistence at which so many peasants in the two provinces lived. Further important considerations are the sudden and seemingly unanticipated nature of the falls, the apparent lack of rice stocks available to peasants and their practice of relying on being able to somehow obtain rice during a large part of the year, and the exceptionally cold 1944–1945 winter, with temperatures dropping to around 6°C. Rice stocks were low partly because peasants had been ordered to sell rice surpluses to the French government in the autumn of 1943, while the bad winter of 1944–1945 ruined a large quantity of subordinate (non-rice) crops and prevented additional planting of some secondary crops.Footnote 31 The effect of the cold weather was intensified by the scant clothing available to many people. Japan sent almost no textiles to Vietnam to make up for pre-war imports and the country produced only a fraction of its textile requirements. Tonkin peasants were almost entirely dependent on buying their clothing.Footnote 32 By 1944, large numbers of people, as well having little to eat, had few, if any, clothes to wear.
Those lacking food in the countryside tried to eat anything: paddy husks, roots of banana trees, clover, tree bark. People walked from the countryside in ‘unending lines together with their whole families’ along the ‘starvation roads’ that led to the provincial towns and cities. Many died along the way. Others stopped occasionally to close the eyes of the dead or to pick up a piece of rag left on bodies.Footnote 33 Enough people succeeded in reaching the cities so that both populations and deaths in large urban areas rose markedly.Footnote 34
A second, crucial, feature of decreases in the harvest between 1942 and 1943, and again between 1943 and1944, was their high degree of localization. Output declines were concentrated in eight coastal provinces. Five were in Tonkin's delta (Hai Duong, Kien An, Nam Dinh, Ninh Binh, and Thai Binh) and the other three in North Annam (see Figure 2). Between 1942 and 1944, the drop in output of 24.9 per cent in these eight coastal provinces more than accounted for the overall decrease in output in all of Tonkin and North Annam; output in other, non-coastal provinces rose (see Table 1). Declines in coastal rice output are almost entirely explained by sharp drops in yields rather than in area planted in rice.
The eight provinces were not necessarily those which were most densely populated (see Figure 2). The imperfect association between population density and output declines, but strong correlation between output declines and coastal provinces, point to the importance of the weather shock of the typhoons, a tidal wave, and floods in triggering the great famine. If output in the eight coastal provinces had been the same in 1944 as in 1942, or probably even in 1943, it seems likely that famine would not have occurred or at least would certainly have been less severe.
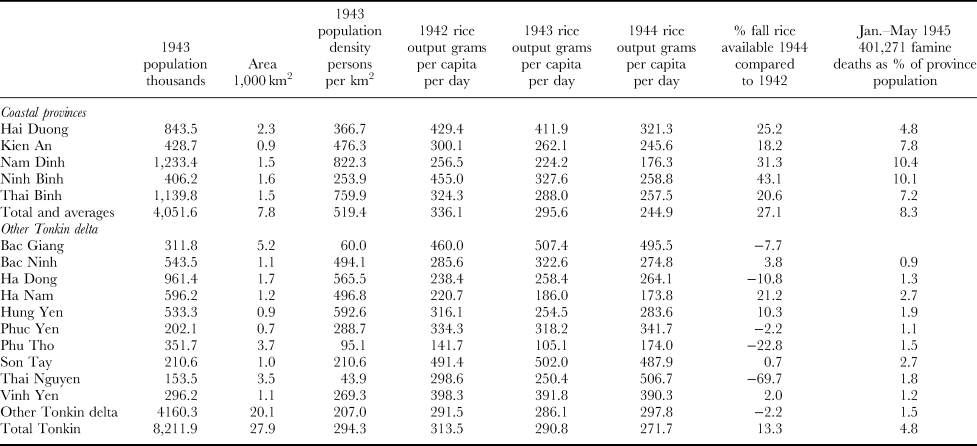
Data for Tonkin, although not Annam, allow the calculation of average daily grams of rice available for consumption per capita. Table 2 uses these data to show available rice from 1942 through to 1944 if it had been distributed equally in each province. As explained in the Notes, availability calculations adopt Marr's figure of consumption of 85 per cent of rice harvested to allow for rice held back for seed and lost to rodents and spoilage (which compares to an average of under 80 per cent consumption of harvested rice from 1918–1930) and Gourou's conversion of a ton of paddy as equal to 0.6449 of a ton of milled rice.Footnote 35 Under normal transport conditions, rice shipments from the south to the north would probably have been instituted.
Tonkin rice availability and famine deaths by province, Jan. to May 1945.

Notes: (1) Available data are for 8,211,900 persons out of a total Tonkin population of 9,851,200 in 1943, which includes 119,700 in Hanoi and 65,100 in Haiphong. The delta province for which no data exist is Quang Yen. (2) Population data for 1942 are the population for 1943 and per capita output may therefore be somewhat understated. Similarly, population data for 1944 are the 1943 population and per capita output may be overstated or, possibly more likely, somewhat understated because famine deaths may have caused the total population to fall between 1943 and 1944. (3) Paddy output is adjusted for rice on the basis that one ton of paddy equals 0.6349 ton of milled rice, as given in Gourou, Standard of Living, p. 13. (4) Available grams per day assumes consumption of 85 per cent of rice output, as assumed in Marr, Vietnam 1945, p. 97. In comparison, in Tonkin from 1918 to 1930 average human consumption was 80 per cent of total rice production (Office of Population Research, ‘Indo-China’, p. 74). (5) Marr, Vietnam 1945, p. 97, argues that 297 grams per day would have been ‘perhaps barely enough for everyone to survive until June 1945’. (6) For coastal provinces, the percentage of deaths shown for total and averages includes Hanoi where deaths were 2.7 per cent of the population and Haiphong where the percentage was 9.4 per cent. (7) The source lists Phy-ly which was the county town of Ha Nam province. Data for Phy-ly have been included for Ha Nam.
Sources: Indochina, Annuaire Statistique, 1941–1942, p. 87, and 1943–1946, pp. 27, 89; AOM GF/3, Provincial Head, Hai Duong to Kham Sai of Tonkin, 4th day, 6th month (probably 4 June) 1945.
Although requisitions may have acted to decrease the total of available rice, availability appears to have depended chiefly on the harvest. However, requisitions would have affected distribution and, among the Vietnamese, would probably have disproportionately favoured those in large cities. Rice was distributed, largely to urban areas, as rations; confiscated by the Japanese military; and used against eventual need. In August 1945, after a build-up of forces, although the Japanese still had just 30,000 troops in northern Vietnam, they also stored rice. The main Japanese storage, however, appears to have been in Cochinchina where there were 70,000 Japanese troops and, by the end of the war, rice stocks of some 60,000 tons.Footnote 36
The key points shown in Table 2 are the percentage changes in rice available for consumption in Tonkin's provinces and the distribution across 14 provinces of 401,271 deaths between January and May 1945 which a government survey attributed to famine. Although data exclude 10 Tonkin provinces, these were all, except Quang Yen, outside the delta and accounted for just 15.6 per cent of Tonkin's 1943 population. Between 1942 and 1944 in the five Tonkin coastal provinces, rice availability, measured as grams per day, fell by between 18.2 per cent and 43.1 per cent. On a population weighted basis, the fall averaged 27.1 per cent. Declines in available rice in Tonkin's coastal provinces—with one exception not matched in any of Tonkin's other provinces—correlated closely with deaths as a percentage of population but not with population density. During the first five months of 1945, Tonkin's five delta coastal provinces accounted for over four-fifths of deaths ascribed to famine. Death rates were between 7.2 per cent and 10.4 per cent of the population in all the provinces except Hai Duong, where the rate was 4.8 per cent. A death rate in Haiphong of 9.4 per cent of the city's population is consistent with mortality data for surrounding coastal provinces but mainly reflects famine victims from elsewhere. Death rates for coastal provinces apparently hide even more catastrophic effects of the famine on poor villages. In some, half or more than half of all inhabitants died during the famine.Footnote 37
Marr suggests that if available rice in Tonkin and North Annam had been shared absolutely equally, famine would have been avoided. He stipulates the ‘barely enough’ amount of rice for subsistence as 297 grams per day between November and the May–June (or fifth month) harvest.Footnote 38 Consumption of 297 grams equates to 1,065 calories. That intake was below or, at best, not much above the basal metabolic rate (the level at which no surplus for physical activity exists) which, as a benchmark, is around 1,080 calories for women aged 18 to 30 and 1,450 for men aged 18 to 60.
Table 2 indicates that by 1944 per capita available rice exceeded Marr's subsistence threshold in only one Tonkin coastal province. Even with totally equal sharing, almost none of the coastal areas would have had available as much as a daily average of 297 grams of rice. To obtain subsistence quantities of rice, most coastal provinces would have had to trade with neighbouring provinces or obtain supplies from outside Tonkin and North Annam. Trade with neighbouring provinces was, however, not permitted by the French government, apparently partly so that the authorities could secure any surplus so as to supply urban centres.Footnote 39 In any case, precious little surplus for exchange existed elsewhere in Tonkin. Even supposing that consumption for everyone of 297 grams a day had been possible, this would probably still have had to be supplemented by potatoes, maize, or taros, which, by the time famine struck, could not be grown because of the exceptionally cold winter. In comparison to a subsistence level of 297 grams, Gourou identified 400, and Nguyen 500, grams as the average daily rice ration for a Tonkinese, but stressed this as being insufficient for a working man.Footnote 40
Although famine reached its peak during the winter and spring of 1944–1945 preceding the June harvest, it continued to claim lives throughout the summer and autumn of 1945 and into 1946. Finally, in June 1946, helped by good weather and a good harvest, the spectre of mass famine was banished. In November 1946, the north had a good rice crop.Footnote 41
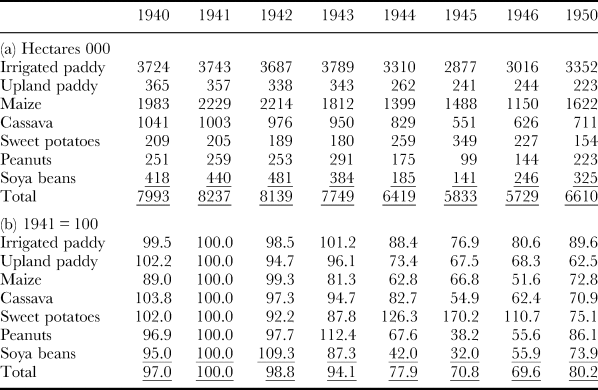
Neither 1940 nor 1941 were unusually good years for the harvest in Java, but both 1942 and 1943 were, which helped to mitigate declining food availability in these years. In 1944, abnormally low rainfall is likely to have adversely affected rice output.Footnote 42 Rice, however, normally accounted for no more than 45 per cent of Javanese calorie consumption and, furthermore, rice crop failures would typically have been offset by dry season production of non-rice food crops, particularly sweet potatoes and cassava. The revealing statistic—and one that is necessary to understand in order to explain Java's famine—is that in 1944 the harvested area was almost a quarter less than it was in 1941 and by 1945, 29.2 per cent less (see Table 3). Taking 1937–41 as 100, paddy production was 81.2 in 1944 and 65.9 in 1945, while the index numbers for maize were 57.1 and 42.9.Footnote 43 Between 1941 and 1945, sweet potatoes, planted as a quick and easily obtained source of calories and a crop that was not commandeered by the Japanese, were the only main food crop for which harvested hectarage rose. The expansion was, however, far too small to make up for sharp contractions in harvested areas of other food crops (see Table 3).
Java: harvested area of main food crops, 1940–1950.

Source: van der Eng, ‘Regulation and control’, p. 195.
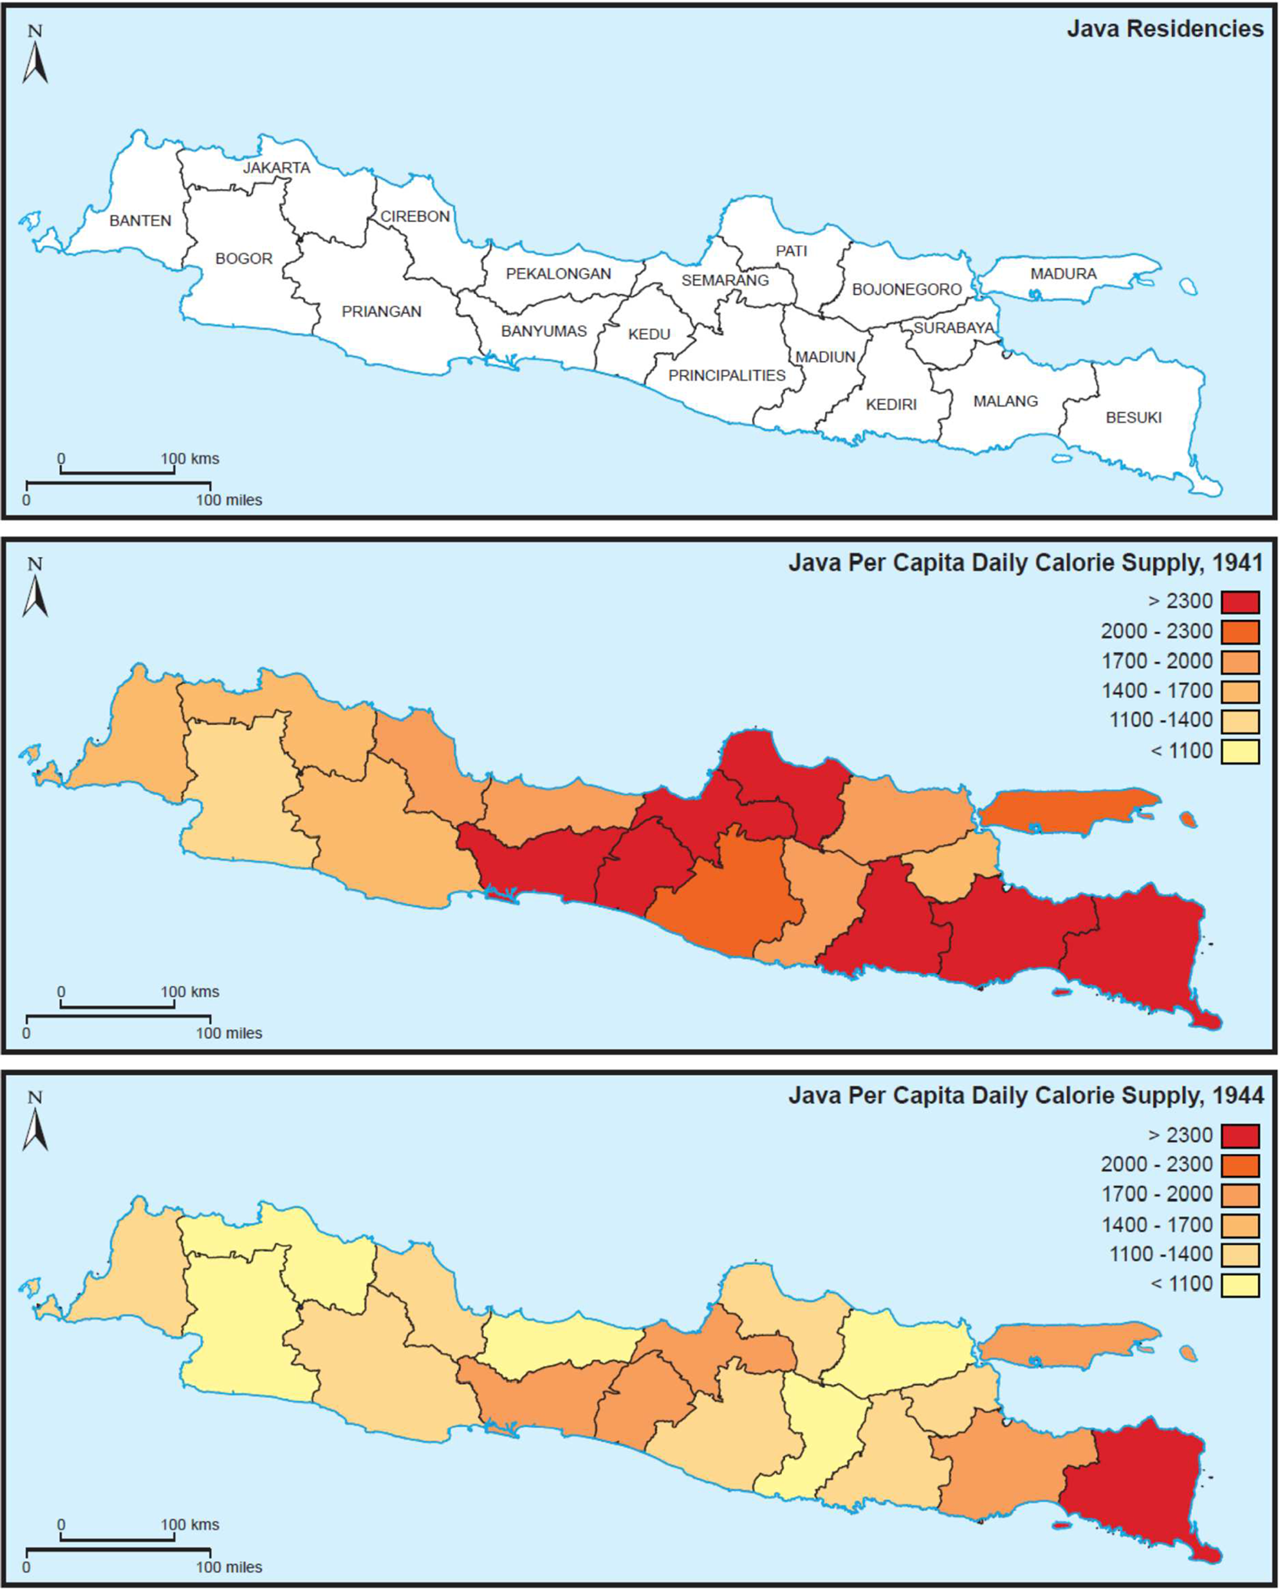
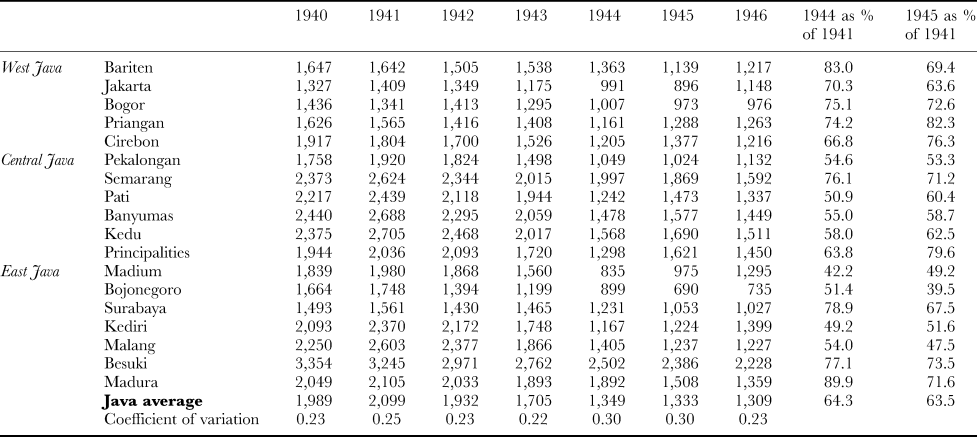
The wartime contraction in harvested areas was accompanied by a catastrophic decrease in average per capita food availability. In this regard, however, official data probably overstate the actual drop in yields because of an under-reporting strategy by local authorities in order to reduce the chance of farmers being compelled to hand over surplus production for token compensation and, possibly, also owing to an attempt to try to lower farmers’ land tax liabilities by enabling them to claim compensation due to crop failure. To estimate likely yields, van der Eng applies acreage average yields from earlier years to 1944–1946 and uses these to arrive at total output and average per capita calorie supply. The results show that during the Japanese occupation average yields of all food crops fell continuously and significantly.Footnote 44 However, average per capita daily calorie supply per Residency, shown by Table 4 and Figure 5, does not take into account trade between Residencies, calories potentially available from sources other than the five main food crops or foreign trade (although this was seriously curtailed during the war).Footnote 45 As against this, and not factored into Table 4, is that in 1944, yields of rice, but not dry season crops, were probably compromised by drought in that year and so dropped in comparison to a harvest under normal rainfall conditions.Footnote 46
Java per capita daily calorie supply, 1941 and 1944.

Java per capita daily calorie supply, 1940–1946.

Notes: (1) Data do not take into account trade across Residency borders nor imports and exports of rice to or from Java. (2) Calories from rice varied considerably between areas of Java and between Residencies. In West Java, rice provided about two-thirds of calories, while in Central Java, almost two-fifths, and in East Java between about a third and two-fifths.
Source: van der Eng, Food Supply, p. 79; http://leokeukens.com/wp-content/uploads/2013/04/java_new_map_medium_colordots.jpg, [accessed 31 May 2019].
Calorie counting by Residency emphasizes Java's geographically unequal food production. In 1941, while calorie supply per head over the island as a whole averaged 2,068 calories, five Residencies had over 2,600 calories and six, under 1,700 calories per head. At that time, trade between Residencies and colonial government policy worked to equalize calorie supply. During the war, however, the Japanese banned inter-Residency rice trade which greatly impeded an equalization of supplies, magnifying the seriousness of wartime falls in production.
Between 1941 and 1944, the net supply of calories per person per day from the main crops (calculated as total estimated production in Java divided by the island's total population) fell from the 2,068 indicated above to 1,316. Every Residency had a drop in calorie consumption. The average fall across all Residencies was 35.7 per cent. During 1945 supplies remained at the same low level. Decline was markedly uneven among Residencies, as suggested by an increase in the coefficient of variation from 0.25 in 1941 to 0.30 in 1944.Footnote 47 There were large drops in many of the most deprived Residencies. By 1944, five of Java's 17 Residencies had average per capita calorie supplies of less than 1,100 calories per head and a further six had under 1,400 calories per head (see Table 4 and Figure 5). These figures compare with a basal metabolic rate of around 1,080 calories for women aged 18 to 30 and 1,450 for men aged 18 to 60. In eight Residencies, average calorie availability in 1944 was less than 60 per cent of its 1941 level. The markedly uneven decline between provinces, shown in Table 4, emphasizes why Japanese policies, discussed below, to outlaw the movement of rice between Residencies and ruthlessly suppress black market trade in rice exacerbated Java's famine. Depending on how much and to whom it was distributed, the Japanese stores of 154,000 tons of rice in 1944 may have worsened the famine but do not explain it.Footnote 48
Falls in calorie availability were so great that, even if all food had been more or less equally shared, famine would still have occurred. Java's wartime drop in food availability would be dramatic in any country, but in Java, it can only be described as disastrous. Starting from an already low nutritional base and continuing throughout the war, by 1944 food availability was already near its lowest level. Furthermore, availability was uneven and hard to ameliorate by switching other expenditure in favour of food, since it already accounted for the bulk of almost everyone's household budget. Although the slaughter of animals increased, per capita calories from meat remained minimal and, furthermore, benefited only those with livestock.
Entitlements and famine selectivity
Even though famines in both Vietnam and Java arose from a decline in rice availability, the incidence of famine was uneven and discriminate. In each area, a large section of society—the poorest 50 to 60 per cent identified by Gourou in Tonkin and Java as estate and factory workers, together with anyone without land—risked, in the terminology of Sen, an entitlements failure.Footnote 49 Failures in endowments and exchange entitlements could have been anticipated from the highly unequal distribution of land ownership in Tonkin and North Annam, and from the wartime collapse in Java's estate economy. Although in Java the Japanese turned over a number of plantations to workers for the cultivation of food crops, attempts to grow enough for subsistence were often unsuccessful.
Before the war, the majority of Vietnamese peasants and Javanese estate labourers and factory workers were landless and lived on the edge of subsistence. They lacked entitlements and with labour as their only endowment, relied on earning enough from it to trade for rice or other food and on whatever subsistence cultivation or scavenging could be managed. High wartime inflation put even the individuals in these groups who had been able to find some form of employment in an increasingly difficult position, since wages tended to be quite inflexible and lagged far behind price rises. For many rural dwellers in both Vietnam and Java, migration to cities offered the best possibilities: the chance of work, begging, or somehow gaining an entitlement to rations. In Vietnam, any entitlement to rations, private relief efforts, and various attempts at price control existed chiefly in the cities. But even in Hanoi rice rations were inadequate and their distribution, irregular.Footnote 50
The Vietnamese famine dead were disproportionately the landless. Farmers and anyone who owned land had a good chance of surviving the famine. There was high mortality among fishermen as well because in northern Vietnam, fish was not a staple but functioned more as a garnish. Fishermen had to trade for rice and were in a weak position when a rise in its price turned the terms of trade against fish. Furthermore, Vietnamese fisherman mainly harvested small fish, shrimp, crabs, and frogs; the famine occurred outside the fishing season; and fishing was hindered by flooding in the coastal provinces due to the typhoons.Footnote 51
The intra-household effects of famine are typically unevenly borne. Usually, famine disproportionately kills the young, the elderly, and men rather than women. For Java, in the absence of quantitative data, little can be said about which age and sex groups were most affected by the famine or whether if, as might be expected due to the migration to cities of displaced estate workers in search of food, many of the dead were working-age males.
The only available intra-household information for Vietnam is for 40,230 deaths in Hai Duong province between January and May 1945.Footnote 52 Data are inexact: they divide deaths only into the broad categories of working-age men, women, children, and elderly. On this evidence, mortality seems generally to have conformed to expected patterns. Disproportionate deaths among children—almost a quarter of the total—are unsurprising, since even in normal years child mortality was high. During the famine, reports exist of parents, confronted with insufficient food to go round, abandoning someone, usually a child, to death or possibly offering children for adoption or sale.Footnote 53 There were also reports and rumours of cannibalism.Footnote 54
In Vietnam the division in famine deaths between outright starvation and illness is not altogether clear. In twentieth-century famines, starvation has tended to predominate and available evidence indicates that Tonkin and North Annam may fit this ‘modern’ pattern.Footnote 55 Even so, and despite the absence of major epidemics, sickness and disease were clearly not absent.Footnote 56 Food shortages during the 1930s and inadequate clothing in the later stages of the war would have left a large share of the population in a weak and debilitated state.
In both Vietnam and Java, famine occurred very largely in the countryside. However, cities were greatly affected since many people in famine areas tried to reach large urban areas in the hope of finding food or even some form of work. Beginning in 1944, destitute and dying people flooded into Hanoi and Haiphong. The flow greatly increased after the March 1945 coup because the Japanese, now in control, abandoned the French policy of blocking access to the two cities. In June 1945 in Hanoi, where famine deaths were estimated at between 100 and 200 a day, corpses were buried by the hundred in shallow pits of about two metres square in the Hop Thien Cemetery. The pits, covering an area of about two mậu (7,200 metres2), emitted a stench that hung over parts of the city.Footnote 57
In Java in April 1944, the Japanese ordered a population registration with the aim of establishing how best to distribute rice after the 1943/44 harvest. By then, however, many Javanese, no longer employed on plantations or in factories, had drifted to the cities and, on the margins of society, are likely to have been omitted from the registration and so also to any entitlement to rice rations. A careful estimation of demographic data found that the registration may have missed as many as 5.66 million people, either by mistake, or perhaps often deliberately, by the neighbourhood associations in charge of local counts and unwilling to share available food among more people. Those left out of the distribution system in major cities in Residencies formed a large destitute group and probably account for many of the famine dead in Java's cities.Footnote 58 According to a different estimate, some 9.5 million people, about 20 per cent of Java's population, were left to somehow find food because they neither lived in cities of 10,000 or more and shared in a distribution there nor made a living in indigenous agriculture.Footnote 59
Writing in 1944, an Indo-European woman in Jakarta reported her kampong ‘flooded with people with people from the oedik (interior). They can barely walk. In the oedik each family got one batok (coconut shell) of rice every two weeks.’ She describes how, in one instance, a family's father, then both children and finally the mother died on successive days in the kampong.Footnote 60 In Jakarta, famine dead became a common sight, especially in the lower town where trucks came to take corpses away.Footnote 61
FAD1 and FAD2 famines and the institutional response
In this section, I focus on the relationships between famine, government, and institutions in Vietnam and Java. Dramatic drops in food availability need not have led to famine in Vietnam, nor was famine inevitable in Java. In both instances, famine could have been avoided by appropriate institutional policies. However, French, Japanese, and American responses not only failed to effectively counter famine but often worsened it.
Falls in food production in Java are largely explained by the destruction of incentives to plant food crops. This, in turn, was the direct consequence of the Japanese policy of setting the prices at which rice mills were expected to purchase paddy from farmers at levels soon outdistanced by wartime inflation. Price rises spiralled upwards towards hyper-inflation due to a near total abandonment of Japanese control over Indonesia's money supply. An index of Indonesian prices rose from 100 in 1941 to 261 at the end of 1943, reached 913 a year later, and stood at 6,635 at the outset of 1945.Footnote 62 High inflation, growing food shortages, and rice rations that were either small or altogether lacking led to escalating black market rice prices and a brisk trade in ‘illegal’ rice, much of it taken to large urban areas and in Jakarta organized in no small part by the city's underworld.Footnote 63 However, a substantial part of the incentive that price disparities would have provided to grow and trade in rice was dissipated by Japanese suppression of the black market. Penalties were severe and extended to execution for trafficking in rice.
The pre-war colonial government system was to buy rice in areas where there was a surplus, arrange transport, and sell in deficit regions. In contrast, the Japanese requisitioned rice, but at first were not involved in its purchase.Footnote 64 Beginning in September 1943, however, the Office of Food Supply (initially the Shokuryō Kanri Jimusho but later often renamed) ordered mills to buy rice and sell it to the Food Office. When this proved unsuccessful, Japanese administrators turned to a rigorous system of quotas and controlled prices. Farmers were instructed to deliver paddy only to kumiai (Japanese-organized cooperatives). Deliveries were meant to contribute to a quota for paddy assigned (although far from systematically or rationally) to all Residencies. They, in turn, were to sell paddy to Java's rice mills at controlled prices. The mills, now under the Food Office's jurisdiction, were prevented from operating in the market. They had, instead, to sell to the Food Office at a controlled price. In practice, rice production fell not merely far short of quotas but, crucially, of actual needs. Towards the end of the Japanese occupation, a number of factors combined to accentuate food shortages on top of the widening gap between free market and controlled prices. These included a poor 1944/45 cropping year, a near total absence of any consumer goods for farmers to buy, and acute transport shortages and consequent heavy reliance by black market traders on carts or bicycles.Footnote 65
Because Java's highly integrated rice market tended to equalize supplies and iron out price rises due to crop failures, a decision towards the end of 1944 to close Residency boundaries for food crops and order Residencies to become self-sufficient in food production was a badly misguided policy. It further stifled the intra-island movement of food, which had been fundamental to Javanese food security, and discouraged the planting of maize and cassava to make up for shortfalls in rice availability.Footnote 66 According to Lucas, the Japanese policy of self-sufficiency ‘tipped the balance of undernourishment into famine’. A contemporary observer reported that while some ‘living corpses’ walked about, many more dead ones were to be seen everywhere.Footnote 67
If one supposes that somehow in Java, despite the Second World War and Japanese occupation of the rest of Southeast Asia, the pre-war colonial administrative system for rice (including, crucially, control over prices) had been left in place, the Javanese famine would probably have been largely, perhaps even entirely, avoided. The situation would have been different because, unlike Indonesia's wartime Japanese rulers, the colonial government appreciated both the central role of prices in securing rice production and the need to transport large quantities of rice from surplus to deficit areas. Different Japanese policies, perhaps even a willingness in early 1943 to change policy, might also have prevented famine. Instead, Japanese officials and policymakers showed little understanding of the Javanese rice economy and the importance to it of market mechanisms and incentives. That may have been because of an inflexible, military government; because the Japanese lacked Javanese experience; or, most likely, because it was thought best to adopt a system like that which existed in Japan. When things began to go wrong, Japanese administrators relentlessly moved away from market solutions and, as described above, enforced ever more restrictions: ‘the more the Japanese tried to control rice marketing, the more it slipped out of control’.Footnote 68 By the latter part of 1943 it was probably too late to avoid major famine.
For Vietnam, it is more difficult to know whose different actions might have avoided, or at least greatly reduced, famine. Cochinchina in the south had large rice surpluses which could have fed the north. Transport was the main problem that needed to be resolved. Normally, coastal shipping carried rice south to north, but it could also have been moved along the Transindochinois railway which linked Saigon and Hanoi. The 1,600 to 1,800 kilometres between rice-producing areas in Cochinchina and Hanoi made shipment by road unrealistic. In 1937, the provincial government in Tonkin, aware of the constant danger of famine, suggested a plan for ‘Création des offices de l'alimentation indigène’ which would have strengthened existing defences against food shortages. Its proposals were, however, rejected by the French colonial government in Hanoi on the grounds that if famine threatened, rice could always be taken quickly northwards by rail.Footnote 69
The French, apart from vetoing the 1937 Tonkin plan to stockpile rice and put in place more comprehensive relief measures, had some responsibility for not averting the 1944–1945 famine for four possible reasons. The first three reflect French inflexibility. One was a French ban on inter–provincial trade which ruled out shipments that could have contributed to an equalization of supplies, for example, from the normally rice surplus region of South Annam.Footnote 70 A second was that the possibility of moving rice to famine areas was stifled by requirements for bureaucratic forms and restrictions on flows of the grain imposed by French administrators. As the war went on and shortages of rice and other goods increased, ‘the colonial government's prior penchant for paperwork increased relentlessly … by early 1945, the control system was clogged by huge quantities of telegrams, letters, commodity samples, price lists, internal memos and formal complaints requiring investigation’.Footnote 71 Third, although the French tried to organize a junk fleet to take rice northwards, their regulations ‘stipulated that 85% of cargo be sold at the official price, and that only 15% would be at the disposal of the junk owners. Under these conditions there was not enough benefit for the owners to undertake voyages that had [due to risk of American bombs and mines] become more and more dangerous’.Footnote 72
Fourth, in 1944 the French increased a rice levy on growers to 186,000 tons from 130,000 the previous year. Whether the levy was effectively enforced is, however, questionable. By the November 1944 harvest, the wholesale printing of money by the Japanese to finance Indochina's occupation had fuelled rapid inflation. Due to this and a lack of French pricing adjustment to the inflationary economy, prices paid for levy rice had fallen so far below market prices that peasants had no interest in delivering rice and would have resisted doing so. By 1944, the main Japanese economic adviser found that ‘the levy system was no longer giving satisfactory results as it had before’.Footnote 73 November 1944 harvest quotas would have become difficult to collect not only because of low prices but also because of the sharp fall in output and worsening famine. Together, these strategies would have encouraged growers to retain rice, if at all possible. And the Japanese would not have had the same strong motive as earlier in the war to enforce collections, since, desperately short of shipping, they could not carry back to Japan even the rice piled up in Saigon (see Table 1). Although North Vietnamese peasants without rice were meant to find it from somewhere, whether they would have had the cash to buy rice at escalating black market prices seems doubtful. Insofar as the French collected levy rice, a substantial part of it was meant for distribution to the cities, which helps to explain why urbanites were less affected by the famine than their rural counterparts.
The Japanese could have done more than the French to avoid the famine—or at least to lessen its impact. Before the March 1945 coup against the French, the Japanese were in a position to be more proactive than they were. After the coup, Japan was in total charge of Indochina. Throughout the war, Japan's military largely controlled transport which, reserved as it was for military purposes, could have been used in 1944 and 1945 to carry rice to the famine-stricken north. Even so, transportation of rice northwards would have been difficult because of American bombing and mining of coastal waters.
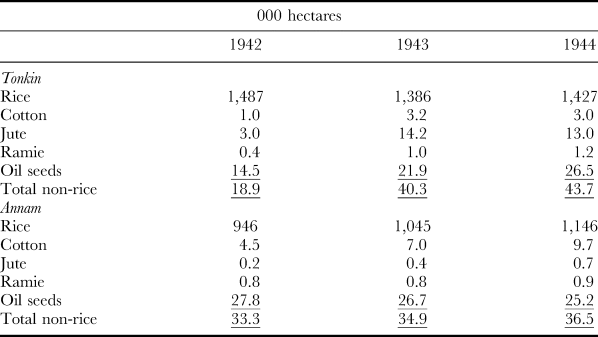
A Japanese requirement in Tonkin and Annam to plant land with fibre and oil seed crops in place of rice is often cited as an important cause of the famine. In fact, the overall effect of a shift in cultivation towards non-rice crops, shown by Table 5, was marginal because the acreage involved was relatively small and some of it was in areas of Tonkin and Annam outside the coastal provinces. If between 1942 and 1944, rice had been planted on this land, in 1944 it would have added 1,792 tons of rice in Annam and 18,600 tons in Tonkin. These totals are an upper bound because they assume that all the non-rice land would instead have been used for rice and that the yields would have been the same as the 1944 average in Tonkin and Annam. However, insofar as land converted to oil seed and fibre crops had previously been used for root crops, the calorific and tonnage loss of conversion would have exceeded that of rice.
Tonkin and Annam rice, cotton, jute, Ramie, and oil seed cultivation, 1942–1944.

Notes: (1) Oil seeds include peanuts, castor oil, and sesame. (2) For 1941 data are available only for the whole of Indochina. Comparison of 1941 and 1942 data suggests significant increases in the cultivation of the non-rice crops of jute and peanuts but the location of this increase in Indochina cannot be identified. (3) In 1944 in Annam, average rice productivity was 0.56 tons per hectare, and between 1942 and 1944 an additional 3,200 hectares was devoted to non-rice fibre and oil seed crops. That implies a possible loss of rice output of 1,792 tons, equivalent to 0.83 per cent of rice output in the coastal provinces of North Annam in 1944. Repeating the same calculation for Tonkin indicates a possible loss in hectares of 24,800. Average rice productivity per hectare in 1944 was 0.75 tons per hectare. That implies a possible loss in rice output of 18,600 tons in Tonkin, equivalent to 1.7 per cent of rice output in Tonkin in 1944. Adding North Annam and Tonkin suggests a maximum loss in potential rice output of 20,392 tons from increased cultivation of fibre and oil seed crops. That assumes, however, that land chosen for fibre and oil seed crops had at least the average productivity of rice land as a whole. The possible loss of rice in 1944 of 20,392 tons compares with a total decline between 1942 and 1944 in rice output in the coastal provinces of Tonkin and Annam of 212,900 tons.
Sources: Indochina, Annuaire Statistique, 1941–1942, pp. 87–89, and 1943–1946, pp. 89–93.
In official Vietnamese accounts, the United States is accorded little or no blame for the famine. It would, however, have been much easier to bring rice to the north without the relentless American mining and bombing campaigns, beginning in mid-1943, conducted by the US 14th Air Force based in China. As early as mid-April 1944, a French official reported that the American bombing had effected a ‘brutal reduction’ in north-south trade.Footnote 74 Just as the full effects of the famine were taking hold, between December 1944 and January 1945, the French archives reveal badly damaged railway routes, often rendered unusable.Footnote 75 In December 1944, Japanese intelligence in Vietnam informed Tokyo that stretching northwards through Tonkin and North Annam, 10 bridges were damaged or destroyed, at Vinh, Yen Ly, Ninh Khoi, Yen Thai, Than Hoa, Hanrong, Dolen, Ninh Binh, Phu Ly, and Hanoi (see Figure 1).Footnote 76 During 1944, the Japanese, known as speedy rebuilders, repaired some bridges and the colonial Public Works Department (with less of a reputation), others. However, throughout the worst of the famine, the US Air Force relentlessly targeted the main line of the Transindochinois to maintain cuts in bridges and open new ones.Footnote 77
The Americans, with the benefit of extensive aerial photographic reconnaissance, did not doubt the effectiveness of their air campaign: ‘the French Indochina rail system, north from Vinh to the China border, was attacked in strength and rendered largely unserviceable’.Footnote 78 American bombing and the laying of mines in coastal waters badly affected other aspects of Vietnamese infrastructure. In December 1943, the port of Haiphong was no longer considered safe and during 1944 was practically abandoned because of American air attacks.Footnote 79 Mines laid along the coast, along with the constant danger of strafing by American aircraft, ‘extremely reduced’ coastal navigation.Footnote 80 By early 1945, any possibilities of shipping rice and corn from the south to the north had almost been eliminated.Footnote 81
In May 1945, the Americans unquestionably knew of the devastating impact of Vietnam's famine, but it is unclear how long before this they had been aware of it. During the first part of 1945, efforts were made to alert American officials to the famine, one through the International Red Cross and another by the Comité de Secours in Cochinchina, a famine relief committee which hoped to go through the Swiss Consul in Saigon. However, contact with the Red Cross was decisively blocked by the Japanese military and the famine relief committee's initiative seems to have come to nothing.Footnote 82 Additionally, on 8 March 1945, General Mordant, commander of the French Indochina Army, cabled Paris to request that the United States stop bombing north of Vinh because of the famine.Footnote 83 Even if no third party had informed the United States, however, American intelligence in China had extensive links in northern Vietnam, with both the French and, especially after March 1945, with the Viet Minh. It seems likely that at least one of these sources would have advised the Americans of Vietnamese starvation and the influx of many of its victims into the cities.Footnote 84 By May 1945, the US State Department possessed clear evidence of the famine because Archimedes Patti, in his official capacity as an officer in the Office of Strategic Services, the United States intelligence agency, sent Washington a dossier of photos.Footnote 85 Subsequently, the United States remained intent only on the pursuit of war and the continued destruction of Vietnam's communication system. It is quite possible that this would also have been the American reaction even if they had had prior knowledge of the famine before Patti's May 1945 dossier. The United States aimed to deny the Japanese army in the north resupply from the south and to encourage the population to turn against the Japanese.Footnote 86
The Viet Minh, of course, had its own goals. While understanding the famine's use as a weapon of revolution, discussed below, the Viet Minh also saw the opportunity to enlist the famine to try to gain American support against the French. Judging from Patti's account of his interaction with Ho Chi Minh, an alliance with the Americans, not aid for famine sufferers, appears to have been the principal motivation behind the ‘Black Book’ of photographic famine evidence that Ho gave Patti.
Conclusion and famine consequences
In both northern Vietnam and Java, the balance between population and food was historically precarious, erratic weather put the population constantly at risk, and dramatic absolute reductions in available food account for the famines in 1944–1945. Even a near perfect equal distribution of food within the affected regions—although this might have somewhat reduced deaths to below a combined total of 3.4 million Vietnamese and Javanese—would not have averted either famine. In Vietnam, the identity of the human agency that could have overcome acute food shortages in the north but failed to do so is not clear-cut. Decisions taken by the Japanese, French, and Americans all contributed to hindering rice shipments to the north which could have prevented the starvation of a million people there. In Java, rigid and misguided Japanese pricing policies, together with an autarky that divided the island into numerous semi-watertight zones, led directly to falls in food availability and thus, beginning in 1944, to 2.4 million deaths.
This article has been able to correct some misperceptions in the current literature. One scholar argues that during the Second World War in ‘Java, extensive famines were not the result of an overall lack of food, just an inability to organize distribution’.Footnote 87 In fact, by 1944 and throughout 1945, there was insufficient food for everyone on the island, however it might have been distributed. Another scholar attributes the cause of famine in Vietnam to a variety of factors: ‘In northern Vietnam, the forcible conversion of large areas of land from rice to jute, and the requisitioning of rice supplies for the war effort, together with American bombing of the railway lines from the south, preventing the shipment of relief food from Cochin-China, brought a famine in 1944–1945 that claimed perhaps 2 million lives.’Footnote 88 In fact, the planting of jute and other fibre crops was of marginal significance. Nor was it requisitions and transport that brought famine. Different transport policies, however, might have averted famine through negating the causal effects of unfavourable weather.
The Vietnamese and Javanese famines, though alike in type and similar in devastation, left remarkably different legacies. The Java famine had minimal political repercussions. Even now, Java's wartime famine has been largely ignored. Indonesian leaders were too implicated in support for the Japanese, including supplying them with forced labour, to make the famine an issue. Indonesia's post-war leadership was intent on focusing on Dutch colonialism in pursuit of post-war independence. Drawing attention to the famine did not fit the nationalist agenda and would have served no purpose. Furthermore, it may not have been politically opportune to recall the 1944–1945 famine, since, as a ground-breaking article by van der Eng shows, for two decades after the war, Indonesia had numerous famines about which the government attempted to supress all news.Footnote 89
In contrast, the famine in Vietnam did much to shape the country's subsequent history. As late as March 1945, the Indochina Communist Party (ICP), led by Ho Chi Minh and the organizing force behind the Viet Minh, was not in a strong position. Nevertheless, the Party identified three opportunities for revolution: the Japanese coup, the climax of the Pacific War, and the famine. This last was, as the Viet Minh well understood, fundamental to the Vietnamese revolution because it created a ‘sense of desperation’ necessary to give the communists access to the villages and the opportunity to fuel rural insurgency.Footnote 90
Famine served as a weapon of revolution by enabling the Viet Minh to head ‘a genuine mass movement’.Footnote 91 Mobilized peasants were apparently often not from the worst famine-affected provinces but a report typical of many from civil servants captures the mood of widespread revolt: ‘Around eight o'clock on 23 May 1945 the theft of paddy was carried out by a group of people carrying rifles, spears, batons and a red flag inscribed with the words “Viet Minh”. An enquiry is underway …’.Footnote 92
Vietnam's revolution differed from the Bolshevik (urban-based) and the Chinese (rural-based) revolutions, because it linked urban and rural, with the latter being the more important. Duiker explains: ‘Famine, more than anything else, made the [Viet Minh rural] strategy possible.’Footnote 93 The capture of Hanoi and Hue did not depend on Viet Minh military strength nor the overwhelming support of urbanites but upon ‘the mobilization of the peasants’. ‘Out of this rural famine and dislocation,’ Woodside concludes, ‘a communist coalition led by Ho Chi Minh seized power.’Footnote 94 Famine was a fundamental and necessary, though not sufficient, condition for revolution. Able to call on the rural masses and under Ho's brilliant leadership, the Viet Minh filled the power vacuum that arose from Japan's sudden surrender on 15 August 1945 and the arrival of Allied troops in some force from around mid-September.
On the night of 19 August 1945, the Viet Minh, with at most 900 men, took control of Hanoi. Tens of thousands of peasants immediately supported the Viet Minh. Activated by famine and revolution, they marched on Hanoi, Haiphong, and Hue, and solidified the initial stage of revolution. Goscha is succinct: ‘famine, more than anything else, ushered in change’.Footnote 95
In the south of Vietnam, the Viet Minh lacked a famine around which to mobilize peasant support and came up against a complexity of political forces among which it was not clearly dominant, even at the time of the Japanese surrender. However, the famine was a cause of distress to middle-class Saigon residents, as evidenced by a large public meeting to support famine relief and the Cochinchina famine relief committee.Footnote 96 More importantly, the Viet Minh, despite a lack of military strength in Saigon and even less in the nearby countryside, gained the support of other major groups in the city. On 22 August, the Vanguard Youth announced it had joined the Viet Minh and and the Cao Đài and Hòa Hảo (populist, quasi-mystical movements with private armies) made similar announcements on 24 August. Viet Minh forces, led by ICP member, Trần Văn Giàu, took power in Saigon on the next day.Footnote 97
Pierre Brocheux recalls that revolutionary August day: ‘I was 15 in 1945 when revolution burst out in Saigon and every day I roamed riding my bike. So I can assure you that I saw the popular upsurge, principally on 25 August when there was a big demonstration throughout the town. At least one million people demonstrated but it was not chaos because the crowd was framed and disciplined in their political movements like the communist led youth organization (the Vanguard Youth), the Trotskyists which had a popular support in the south at least in the Saigon urban district, but also the Caodaists, a religious sect … armed and supported by Japanese army.’Footnote 98 Between August and early September, Kiernan summarizes, the Viet Minh ‘rode to power on a tide of revolution that swept the country from north to south’.Footnote 99
In Hanoi, Ho Chi Minh publicly proclaimed independence on 2 September 1945. The new regime gained legitimacy in 1946 and 1947 through measures to deal with famine and prevent its reoccurrence; in this were helped by good weather and the initiative of local groups which cultivated vacant land.Footnote 100 Famines and revolutions, as is well known, frequently go together. Duiker makes this point: ‘famine in the countryside—a factor so familiar to students of the revolutionary process’.Footnote 101 In contrast to Vietnam, Second World War Java stands as an interesting exception to any clear association between famine and revolution.