Introduction
The development of biomimetic materials founded on nanotechnology is a way to approximate biological systems once these hierarchical compounds can be taken from the nanoscale to the macroscale. When applied to an osseous implant, which is a tissue compound formed by inorganic lattices (osseous apatite) connected to organic compounds (collagen and other proteins) [Reference Sharan, Singh, Lale, Mishra, Koul and Kharbanda1], the biomaterial’s success can be attributed to the mechanical anchorage (geometry) and the biological anchorage (surface topography, chemical composition, wettability, and surface roughness). Given that these properties can oppose each other, it is necessary to find an equilibrium between them to achieve good osseointegration [Reference Sharan, Singh, Lale, Mishra, Koul and Kharbanda1, Reference Pokrowiecki, Pałka and Mielczarek2].
For use as dental implants, in addition to the mechanical and biocompatibility requirements, the material must also have good antibacterial activity to inhibit biofilm formation [Reference Hanawa3]. In this context, titanium (Ti)-based devices have been studied since the early 1980s [Reference Pokrowiecki, Pałka and Mielczarek2] and have gone through continuous development to improve their surface activity. Surface modification by nanostructured oxide formation increases the antibacterial activity by destroying cell membranes through the formation of oxygen-rich radicals, which break cell membranes through the effects induced by UV light irradiation [Reference Ghiciuc, Ghiciuc, Ochiuz and Lupuşoru4].
Titanium dioxide (TiO2)–based materials, however, have a bioinert nature, which increases the interest in their use with materials that can interact with living tissues that increase osseointegration. This effect can be achieved by using hydroxyapatite (HA). In a bulk state, HA presents great osteoconductivity but poor biodegradability (reabsorption). Using nanostructured HA allows for biomimetic structures due to its improved properties and immune–inflammatory responses, and it also increases the surface contact with the biological medium, thereby improving its absorption by approximating its properties to mimic human bone [Reference Sharan, Singh, Lale, Mishra, Koul and Kharbanda1].
The fabrication of TiO2-HA nanocomposites on Ti surfaces is traditionally done in multiple steps with different conditions: dry, chemical, hydrothermal, microarc oxidation, electrochemical, etc. [Reference Hanawa3]. An efficient method to obtain nanostructured TiO2 is Ti anodic oxidation, which is a competitive process between oxidation and dissolution controlled by the solution’s composition and the applied potential [Reference Watcharenwong, Jindanant and Kajitvichyanukul5, Reference Awad, Edwards and Morsi6, Reference Fathyunes and Khalil-Allafi7]. HA is generally deposited as a second step through a different process, such as dipping in simulated body fluid [Reference Zhao, Yang, Zuo and Xiong8], electrochemical deposition [Reference Fathyunes and Khalil-Allafi7, Reference Farrokhi-Rad, Shahrabi, Mahmoodi and Khanmohammadi9, Reference Kar, Raja and Misra10], physical vapor deposition, and hydrothermal treatment [Reference Awad, Edwards and Morsi6].
The antibacterial activity and bioabsorption of implants can be increased by using chitosan (CHI), which is a biocompatible and biodegradable biopolymer that avoids bacteriological infection when used as the base of scaffolds for alveolar bone regeneration [Reference Pokrowiecki, Pałka and Mielczarek2, Reference Farrokhi-Rad, Shahrabi, Mahmoodi and Khanmohammadi9], thereby allowing for cell differentiation [Reference Padovani, Feitosa, Sauro, Tay, Durán, Paula and Durán11]. Electrodeposition using lightly acidic solutions was used to successfully obtain chitosan films [Reference Li, Pang, Epand and Zhitomirsky12].
Even though they produce efficient structures, the existing methods for TiO2-HA or TiO2-HA-CHI nanocomposites obtention generally require a long time and are carried out in different successive steps. Through the approach of this work, an electrochemical route is proposed to obtain a TiO2-HA or TiO2-HA-CHI composite biomimetic surface in the fewest steps as possible. These materials have great potential uses for dental applications and osseointegration capabilities. In this work, two routes for the electrochemical synthesis of TiO2 nanotubes (NTs) with HA were discussed. Route 1: a constant potential (CP) was applied for HA deposition. Route 2: an alternated potential (AP) was applied for HA deposition, obtained in one and two steps as described in the “Materials and methods” section.
Results and discussion
The pulsed method was used to obtain the TiO2-HA nanocomposite in a single step (SS) since the CP method was not efficient for its formation. It occurs due to the different nature of the electrochemical process studied here (i.e., anodization and electrodeposition). Initially, the TiO2 NTs formed by anodization process in fluoride-based electrolytes have been widely used. It is well accepted that competition between oxide growth and dissolutions leads to the formation of porous oxide films. On the other hand, the electrodeposition process, as studied here, consists of the deposition of HA onto TiO2 NTs [Reference Basile, Benito, Fornasari, Monti, Scavetta, Tonelli and Vaccari13]. In this approach, the samples were obtained using a CP and an AP route. It is worth to comment that the pulsed method allows both processes: anodization of titanium and electrodeposition of HA.
According to the literature [Reference Parcharoen, Kajitvichyanukul, Sirivisoot and Termsuksawad14], the ideal NT length for biomedical applications is approximately 600 nm. In this way, from the data (Figs. S1, S2 and Table SI) available in the Supplementary material, 10 min of anodization was established as the ideal time for the next steps. The sample obtained here is denominated NTs_TiO2. The HA powders, obtained from the eggshell, were characterized by scanning electron microscopy (SEM), transmission electron microscopy (TEM), energy-dispersive spectroscopy (EDS), ultraviolet–visible (UV-vis), and X-ray diffraction (XRD) whose results were as expected based on literature and are available in the Supplementary material (Fig. S3).
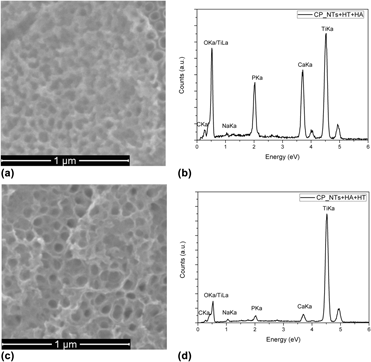
The CP routes for the TiO2 + HA composite obtention, which are widely known in the previous researches [Reference González-moya, Garcia-basabe, Rocco, Pereira, Princival, Almeida, Araújo, David, Ferreira and Machado15, Reference Oliveira, Silva, Cabral Filho, Fontes, Oliveira, Andrade, Silva, Coelho, Machado and Correia16], presented samples with similar morphologies, as seen in Fig. 1. Here, the NT formation occurs due to the use of the external potential, which causes reactions (1) (oxidation) and (2) (dissolution) to occur. By controlling the applied potential, it is possible to control the NT diameter, which is approximately 80 nm for the conditions that were used (applied potential = 30 V; 0.5 wt% NH4F). These results showed that the heat treatment (HT) order related to the electrodeposition does not significantly affect the samples’ morphology [Figs. 1(a) and 1(c)] or composition [Figs. 1(b) and 1(d)]. Following these results, the AP method was applied by the fabrication of two samples: SS_TiO2 + HA and double-step (DS)_TiO2 + HA (see the “Materials and methods” section for more information).
 $${\rm{Ti}} + 2{{\rm{H}}_{\rm{2}}}{\rm{O}} \to {\rm{Ti}}{{\rm{O}}_2} + 4{{\rm{H}}^ + } + 4{{\rm{e}}^ - }\quad ,$$
 $${\rm{Ti}}{{\rm{O}}_2} + 4{{\rm{H}}^ + } + 6{{\rm{F}}^ - } \to {\left[ {{\rm{Ti}}{{\rm{F}}_6}} \right]^{2 - }}_{\left( {{\rm{aq}}} \right)} + 2{{\rm{H}}_{\rm{2}}}{\rm{O}}\quad .$$
SEM images and EDS analysis of TiO2-HA NTs obtained with CP method with HT made (a, b) before HA deposition and (c, d) after HA deposition.

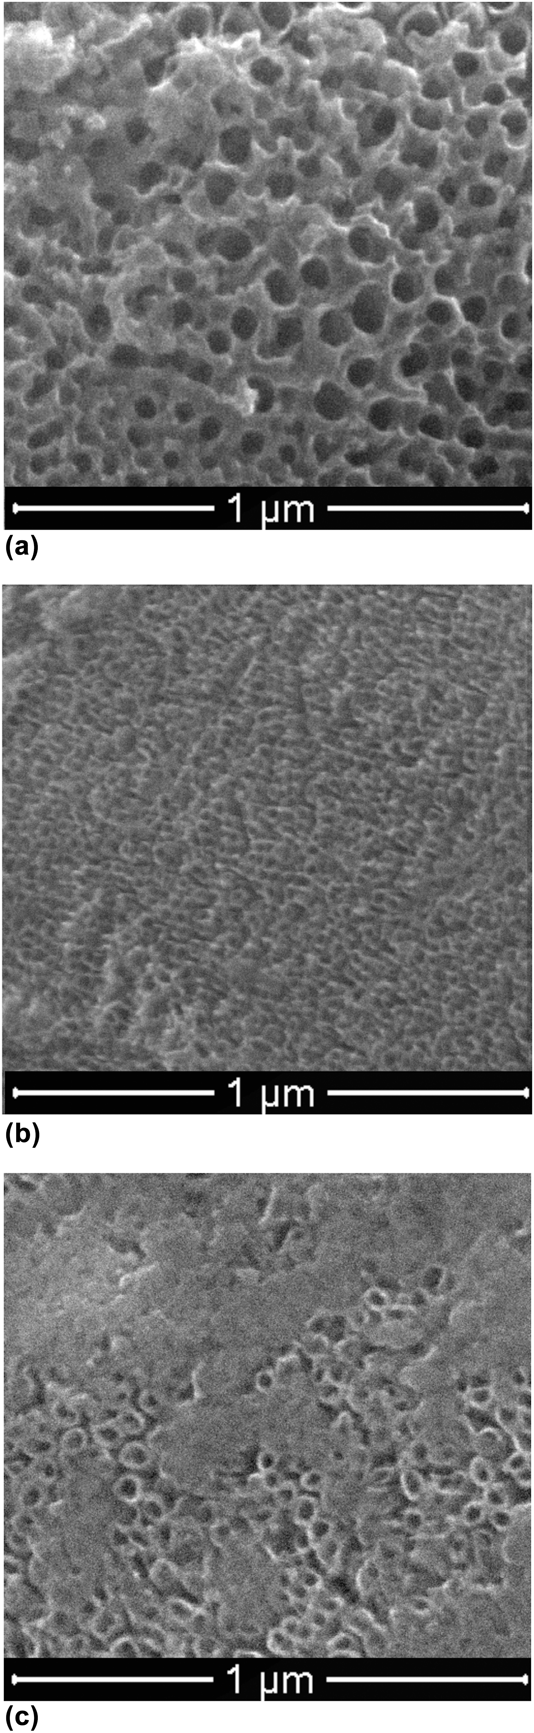
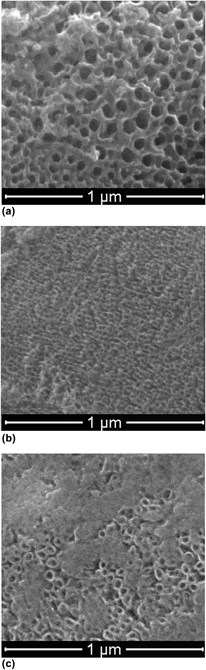
Both the AP (SS) and CP presented similar morphologies; however, a porous structure was identified on the SS_TiO2 + HA [Fig. 2(a)]. These porous structures were attributed to the HA due to its different morphology compared to the same sample and the variation of the electronic contrast, which is shown in the XRD and Raman spectroscopy results below. In addition to the difference in the electrolytic solutions used in these two methods (SS_TiO2 + HA and DS CP), the electrochemical reactions occurring in both are similar. However, in the SS synthesis, as a result of the nature of the process, when +8 V is applied, NTs form and applying −2 V allows the HA to deposit on the internal tube walls, which slightly decreases the NTs’ average diameter.
SEM images of TiO2-HA NTs obtained with AP method: (a) SS_TiO2 + HA, (b) DS_TiO2 + HA, and (c) SS_TiO2 + HA_CHI.

Conversely, through applying an AP over the presynthesized NTs, the previous presence of a well-defined diameter enhances the electrodeposition reaction over the titanium dioxide formation, thus significantly reducing the tube diameter [Fig. 2(b)].
After the obtention of the SS_TiO2 + HA sample, chitosan was electrodeposited on its surface by applying a CP. In this method, a thin film was deposited over the NT surface. Chitosan is protonated in an acetic acid solution and is converted to its solid form by the presence of hydroxyl groups on the non-heat-treated TiO2 surface, according to reaction (3) [Reference Farrokhi-Rad, Shahrabi, Mahmoodi and Khanmohammadi9]. This result was verified through SEM analysis [Fig. 2(c)], where the presence of NTs covered by CHI film was observed.
 $${\rm{CHI}} - {\rm{N}}{{\rm{H}}_{\rm{3}}}^ + + {\rm{O}}{{\rm{H}}^ - } \to {\rm{CHI}} - {\rm{NH}} + {{\rm{H}}_2}{\rm{O}}\quad .$$
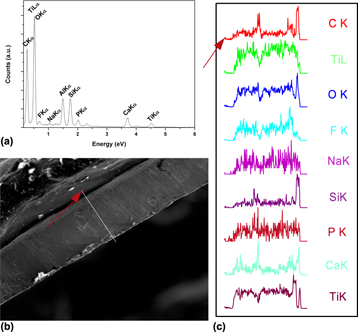
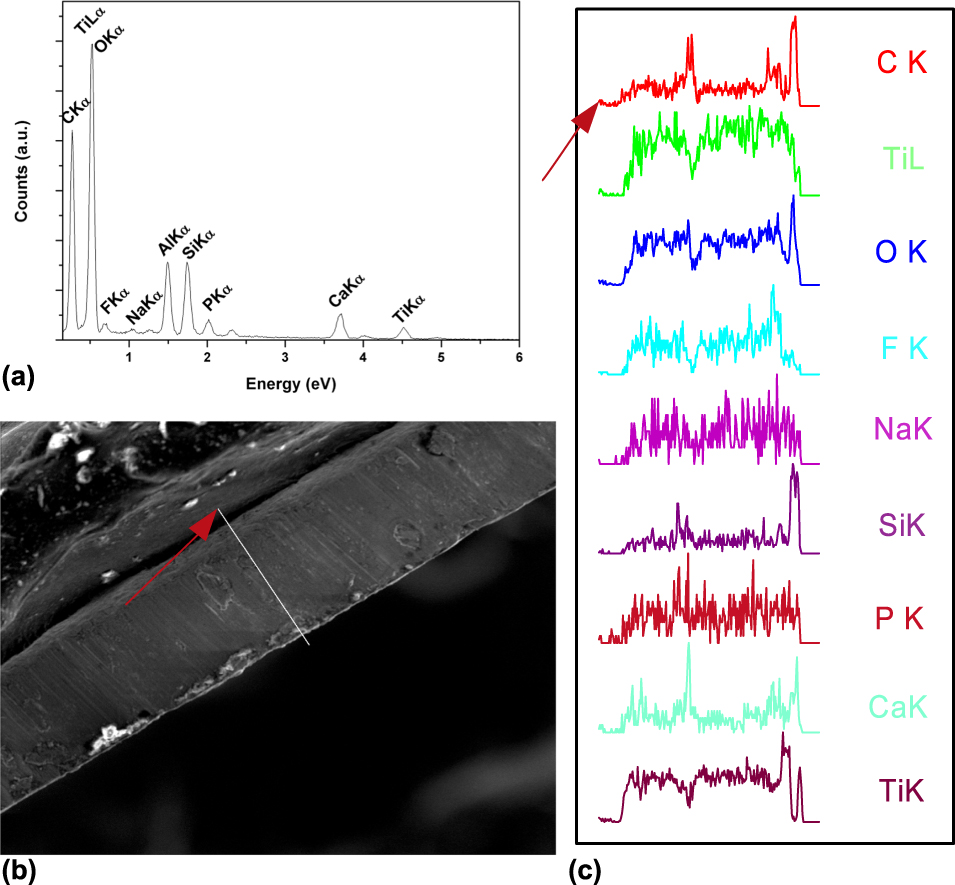
EDS analysis [Fig. 3(a)] showed the presence of all compounds of interest and they presented similar profiles. The distribution of the compounds through the cross-section [Fig. 3(b)] showed a homogenous distribution of them. The detection of aluminum (Al) is due to the analytical substrate, while silicon (Si) is a probable escape peak.
EDS analysis of sample SS_TiO2 + HA_CHI: (a) spot spectrum, (b) region of acquisition of line spectrum, and (c) line spectrum obtained for present elements.
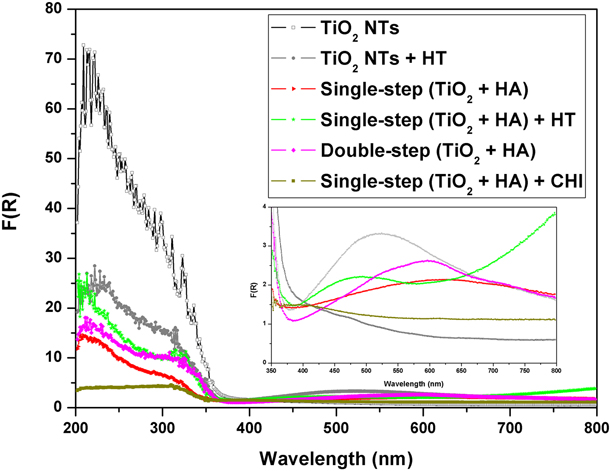
UV-vis spectrometry analysis (Fig. 4) allows for characterizing the changes in the optical–electronic properties of the samples made by the different treatments. The effect of the TiO2 anatase phase formation due to the HT on the optical properties can be represented by the reduction in the UV absorption and the appearance of a band in the visible region. This UV reduction is related to the organization of the atomic structure of TiO2 by means of the HT, which increases the atomic mobility promoting the phase transition to a crystalline phase.
UV-vis spectroscopy analysis for samples TiO2_NTs, SS_TiO2 + HA, DS_TiO2 + HA, and SS_TiO2 + HA_CHI.
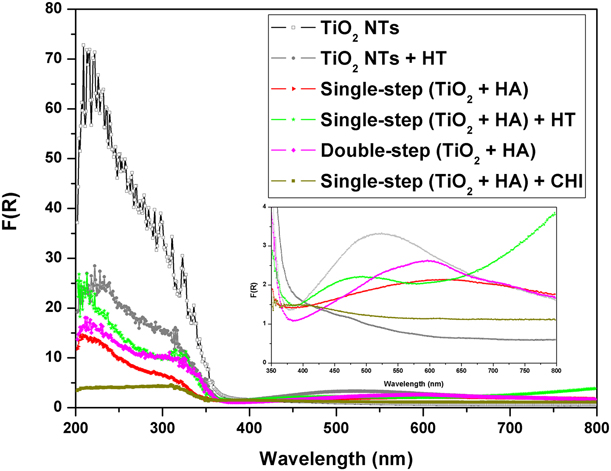
On the samples made in the presence of HA (SS_TiO2 + HA and DS_TiO2 + HA), HT promotes the second phase’s incorporation to the crystalline TiO2, where HA can be added over the oxygen vacancies. It was observed that the chitosan addition significantly reduces the UV absorption intensity, which can be explained by the chitosan covering the tubes, as shown using SEM.
It has been observed in Fig. 4, a large absorption band for TiO2 NTs with HT; interestingly, this absorption is very discrete for amorphous NTs. This behavior is due to the presence of pores or cracks in the NT arrays can cause a scattering of light, which was observed when analyzing visible region absorption [Reference Li, Wu and Zhang17]. The beginning of the visible HA absorption is observed by the straight crescent from 600 to 800 nm, and this comportment is observed just in the heat-treated samples.
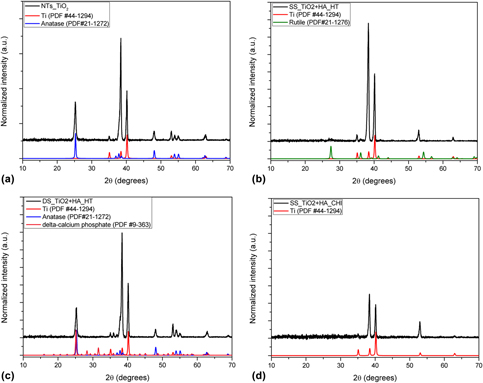
XRD results (Fig. 5) show that the HT made the crystalline TiO2 anatase phase possible just on the TiO2_NTs and DS_TiO2 + HA samples. Anatase is identified by its majority peak at 25°, which corresponds to the (110) plane. The peaks observed at 35°, 38°, 40°, 53°, and 63° are attributed to the titanium metallic substrate. In the DS_TiO2 + HA sample, a third phase was identified as Ca(PO3)2, which was probably formed from the dissolution of HA on the Ca2+ and PO43− ions that occurs at neutral pH values, as demonstrated by Rölla [Reference Rölla, Bergseth and Svatun18], and shown in reaction (4).
 $${\rm{C}}{{\rm{a}}_{10}}{\left( {{\rm{P}}{{\rm{O}}_4}} \right)_6}{\left( {{\rm{OH}}} \right)_{2\left( {\rm{s}} \right)}} \to 10{\rm{C}}{{\rm{a}}^{2 + }}_{\left( {{\rm{aq}}} \right)} + {\rm{P}}{{\rm{O}}_4}{^{3 - }_{\,\,\,\,\left( {{\rm{aq}}} \right)}}{\rm{\ }} \!+\! {\rm{\ }}2{\rm{O}}{{\rm{H}}^ - }_{\left( {{\rm{aq}}} \right)}\quad .$$
X-ray diffractograms for: (a) TiO2_NTs, (b) SS_TiO2 + HA, (c) DS_TiO2 + HA, and (d) SS_TiO2 + HA_CHI.
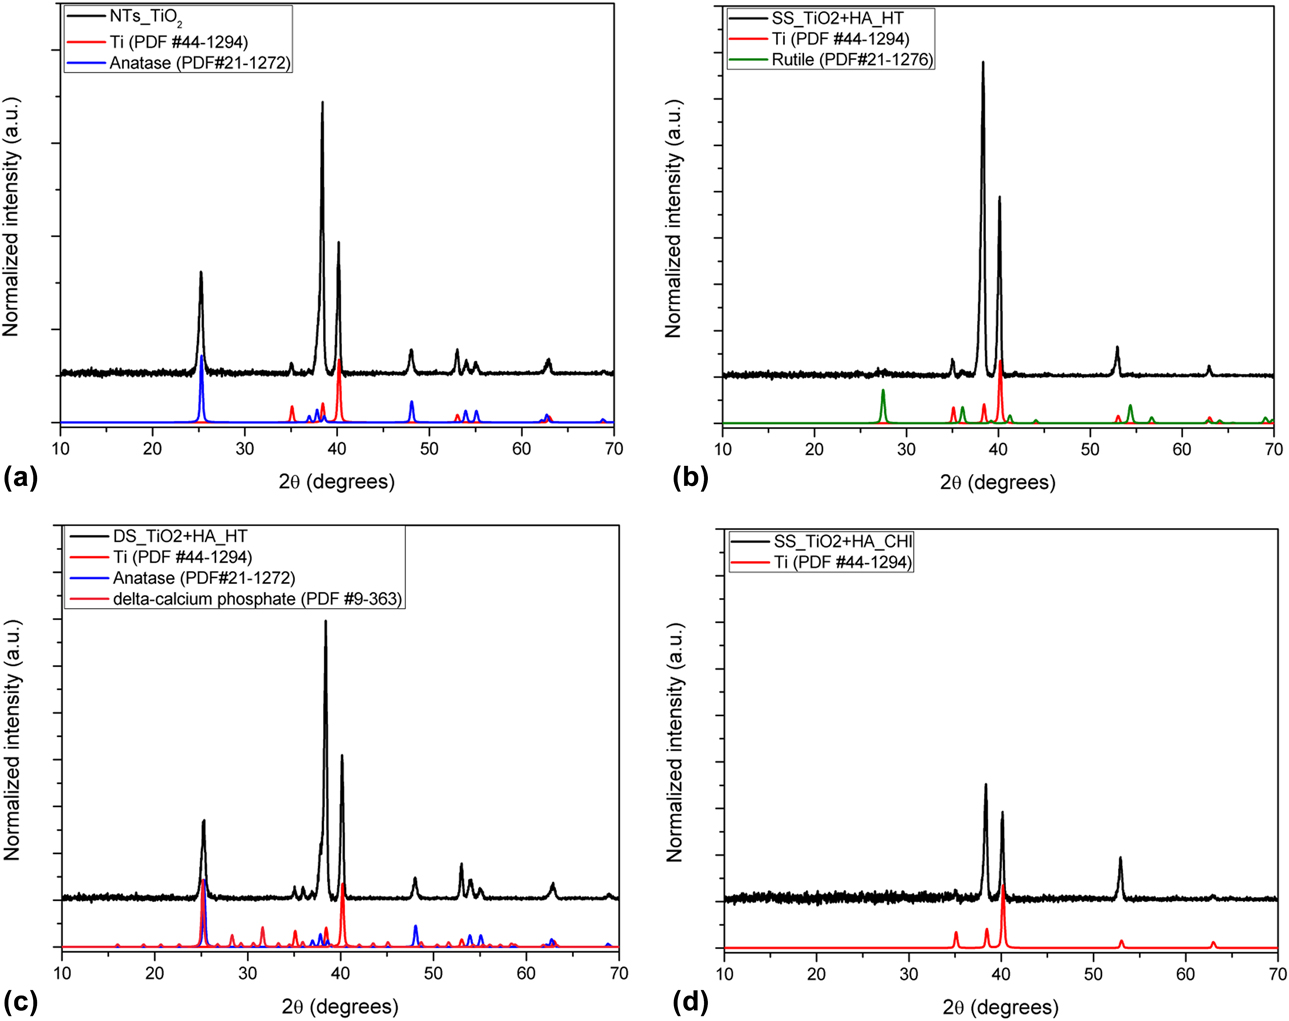
From the SS samples (SS_TiO2 + HA and SS_TiO2 + HA_CHI) without and with CHI, there are peaks attributed just to the titanium substrate. However, two discrete peaks can be observed at 27° and 36° for the sample without CHI, but the low count number does not allow for any significant conclusions regarding the presence of other crystalline phases except for titanium. One suggestion is that these low-intensity diffraction peaks can be related to the beginning of the formation of the TiO2 rutile phase, which can be explained by the presence of HA on the lattice. This accelerates the phase transition kinetics and promotes the direct crystallization to rutile. A similar approach was observed by Mao et al. [Reference Mao, Wilde, Ogura, Chen, Fukutani, Matsuzaki and Terai19], which showed that the rutile phase obtention at low temperatures was due to the addition of hydrogen. The HA phase was not detected in the diffractograms, which was probably due to the relatively low quantity of this phase that is not in the range of sensitivity of XRD [Reference Yanagisawa and Ovenstone20]. The presence of HA was confirmed by Raman, as discussed before.
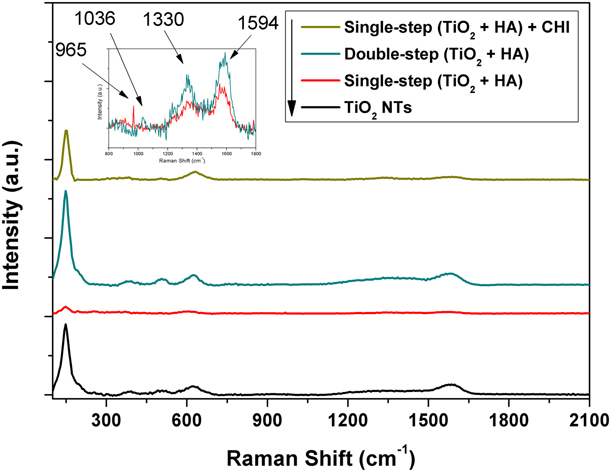
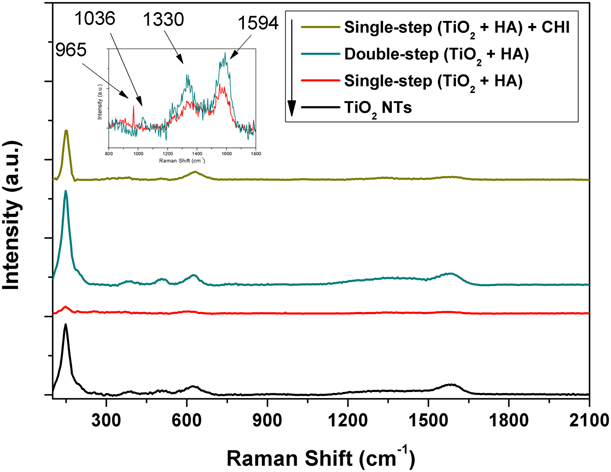
Raman analysis (Fig. 6) enabled the identification of the crystalline TiO2 on the anatase phase to the NTs_TiO2 and DS_TiO2 + HA samples. However, the samples made in a SS presented just a light shoulder on the anatase phase digital press, thereby indicating a low crystallinity of formed oxide. These results are according to XRD. The SS_TiO2 + HA sample showed a peak at 965 cm−1, which was attributed to the symmetric stretching of the νsP–O(H) of HA [Reference Escobar-Sierra, Martins and Ossa-Orozco21]. The SS_TiO2 + HA_CHI sample presented a bigger intensity in the TiO2 region than the last sample and a peak at 1036 cm−1 that was related to the asymmetric flexion δPO–H and the asymmetric stretching νasP–OH [Reference Escobar-Sierra, Martins and Ossa-Orozco21], which is attributed to HA [Reference Lobo, Otubo, Matsushima and Corat22]. In this approach, we suggest that the HA detection of the composites is a supposed indication of a good osseointegration. The other peaks that are observed are related to TiO2.
Raman spectrum of samples TiO2_NTs, SS_TiO2 + HA, DS_TiO2 + HA, and SS_TiO2 + HA_CHI.
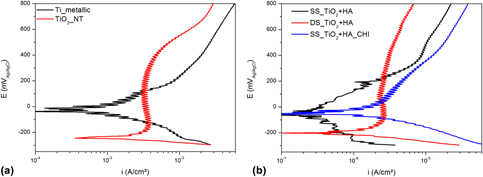
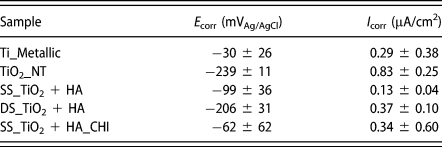
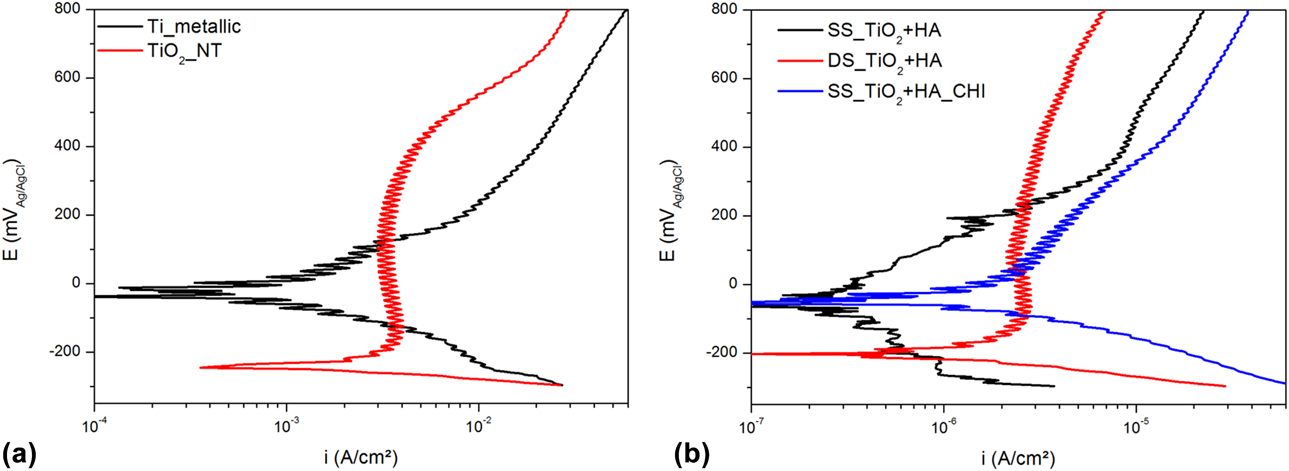
The linear polarization curves for the different analyzed samples in the artificial saliva solution at 37 °C are illustrated in Fig. 7. The graphs provide information about the potential (E corr) and corrosion current density (i corr) parameters. The E corr is indicative of the sample’s thermodynamic stability to start the anodic reactions. Accordingly, the more dislocated it was to positive values, the more it was necessary work to begin the corrosion reactions. However, for the evaluation of the corrosion resistance performance, the i corr must have been considered, since the more anodic reaction leads to a higher corrosion current density. Table I describes the E corr and i corr data with their respective confidence intervals, which were calculated from a cathodic–anodic Tafel fitting.
Linear polarization curves for samples: (a) metallic Ti and TiO2_NTs and (b) SS_TiO2 + HA, DS_TiO2 + HA, and SS_TiO2 + HA_CHI.
Potentials (E corr) and current densities (i corr) of corrosion of evaluated samples.

The only anodized sample (TiO2_NT) showed the lowest corrosion potential (−239 mVAg/AgCl), whereas the metallic titanium presented the highest corrosion potential (−30 mVAg/AgCl). This result highlights the susceptibility of the TiO2_NT to the anodic reaction, which is attributed to the structural parameter whose superficial area is considerably increased with the NTs [Reference Ahmadi, Mohammadi and Sadrnezhaad23]. Since there are more sites that are prone to the occurrence of anodic reactions, the reactions are favored and the E corr has lower values [Reference Seah and Chen24, Reference Cai, Nakajima, Woldu, Berglund, Bergman and Okabe25, Reference Aparicio, Javier Gil, Fonseca, Barbosa and Planell26]. Moreover, the i corr for the anodized sample was 0.83 µA/cm2, while that of the metallic titanium was 0.29 µA/cm2. The result of the greater i corr illustrates the enhanced anodic reaction.
When the coating layer of the samples with HA is evaluated in terms of the corrosion resistance, the E corr increases and the i corr decreases for all the species (SS_TiO2 + HA and DS_TiO2 + HA) in relation to TiO2_NT. Therefore, the HA in the materials improved their corrosion resistance, which is expected, since the HA has a nobler corrosion potential than the metallic titanium [Reference Ahmadi, Mohammadi and Sadrnezhaad23, Reference Wang, Guan, Wang, Ren and Wang27]. However, the most interesting behavior is associated with the sample coated by HA in only one step (SS_TiO2 + HA). Here, the indicative values of the corrosion resistance, mainly i corr, are substantially improved, which reached −99 mVAg/AgCl and 0.13 µA/cm2. Accordingly, the one-step sample production extensively decreases the problems found by the increased surface area due to the NTs.
The corrosion resistance of the HA is associated with its better stability and the smaller solubility of the calcium phosphates when in the solution [Reference Ahmadi, Mohammadi and Sadrnezhaad23]. According to the results exposed in Figs. 4 and 5, the SS_TiO2 + HA sample showed the HA was better distributed throughout the TiO2 crystalline structure. Therefore, in opposite form, which happens with DS_TiO2 + HA sample, the HA is not limited to the oxide layer surface but it can be found in the inner of the oxide. Thus, the better distribution of compounds with great corrosion resistance into the TiO2 structure, like HA, promoted a substantial improvement in material resistance to suffer an anodic reaction [Reference Anawati, Tanigawa, Asoh, Ohno, Kubota and Ono28].
The SS_TiO2 + HA_CHI sample increased the E corr (−62 mVAg/AgCl) in relation to both samples with HA, which means that corrosion is less likely. The observed improvement is attributed to the NTs that are partially covered by the chitosan, as seen in Fig. 2. Therefore, the surface area is decreased for the samples and their corrosion resistance is improved. When the metallic titanium species is evaluated, an increase is observed in corrosion resistance due to the complete absence of NTs on its surface. Even though there is a more positive E corr in relation to the SS_TiO2 + HA, the metallic titanium had a corrosion density current more than two times higher than the sample with chitosan. Thus, due to the similar material between the SS_TiO2 + HA and the SS_TiO2 + HA_CHI, where they differ just in the presence of chitosan, it is supposed that the increase in the current is due to the dissolution reaction of the chitosan.
A biocompatible metallic material needs to have a high corrosion resistance to extend the lifetime of implants in the human body. The oxide layer can change the composition, similar to a consequence of responses among the metallic material and living tissues [Reference Asri, Harun, Samykano, Lah, Ghani, Tarlochan and Raza29]. Thus, the superficial film on the metallic material plays an important role in the prevention of the corrosion process in the material as well as in the biocompatibility of tissues [Reference Ryan, Pandit and Apatsidis30]. Therefore, when the positive effects of the corrosion resistance, biocompatibility, and bioactivity promoted by HA [Reference Padovani, Feitosa, Sauro, Tay, Durán, Paula and Durán11] are taken into account, it is possible to conclude that the SS_TiO2 + HA and SS_TiO2 + HA_CHI are the best candidates for dental implants.
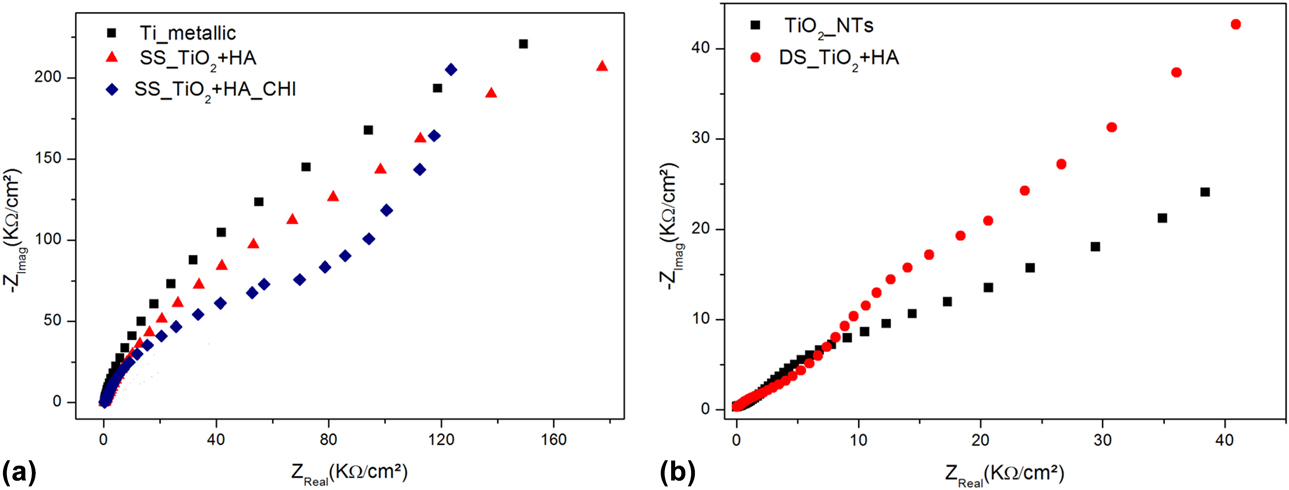
The electrochemical behavior of the deposited film in the samples after immersion in artificial saliva solution in 37 °C was observed using electrochemical impedance spectroscopy (EIS). The Nyquist graph representations of the EIS are shown in Fig. 8.
EIS curves for samples: (a) metallic Ti, SS_TiO2 + HA, and SS_TiO2 + HA_CHI and (b) TiO2_NTs and DS_TiO2 + HA.
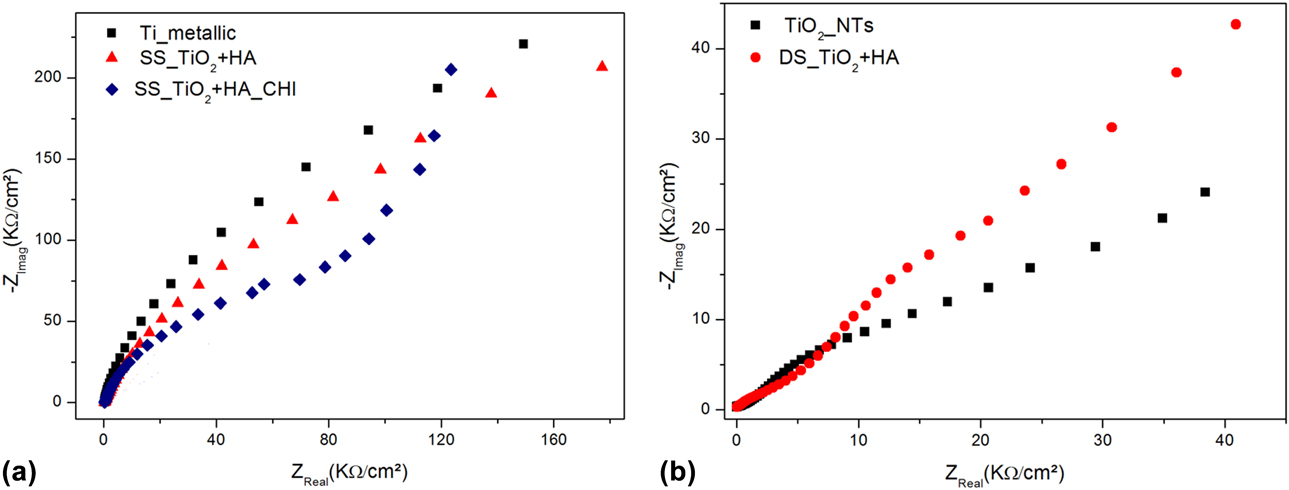
The Nyquist plots show that the metallic titanium has a substantial increase in its electric resistance (abscissa axis), as shown in Fig. 8(a), in relation to the anodized sample, as shown in Fig. 8(b). This electric resistance is associated with the resistance of the sample to corrosion, that is, the corrosive medium cannot easily penetrate the oxide layer on the titanium and it leads to a high electric resistance [Reference Farrokhi-Rad, Shahrabi, Mahmoodi and Khanmohammadi9, Reference Ahmadi, Mohammadi and Sadrnezhaad23]. The worst corrosion resistance performance of the anodized samples was associated with the increase in the superficial area, as was discussed previously.
Despite the capacitance values (ordinates axis) assume similar quantities between the SS_TiO2 + HA_CHI and SS_TiO2 + HA, the resistance to the corrosive process of the sample without chitosan (SS_TiO2 + HA) was higher. Thus, these results corroborate the data shown in Table I, since the SS_TiO2 + HA_CHI presented a corrosion current density almost 3 times higher than that for SS_TiO2 + HA. The high corrosion reaction, as verified by the i corr value, in SS_TiO2 + HA_CHI is likely attributed to the chitosan dissolution since both samples differ just in the presence of chitosan on the surface.
Among the samples with the presence of HA, the DS_TiO2 + HA had the worst corrosion resistance performance and was better only than TiO2_NTs. The HA on the surface improved the corrosion resistance due to its better chemical stability in the studied environment. Therefore, all the results that are obtained in this section corroborate all the previously obtained polarization data. That is, SS_TiO2 + HA and SS_TiO2 + HA_CHI are the best candidates for dental implants.
Conclusions
The electrochemical synthesis of tubular nanostructures containing TiO2-HA was achieved through both proposed methods, thereby allowing the obtention of NTs with different diameters. UV-vis analysis identifies the changes in the optical–electronic properties of the obtained systems, and a different behavior was observed for the sample obtained in an SS. The XRD analysis indicated that HA was incorporated into the TiO2 lattice of the SS samples, acting as a stabilizer of the rutile phase. The Raman analysis proved the addition of HA and CHI to NTs in the SS. Electrochemical analysis indicated that SS synthesis was favorable to increasing the corrosion resistance of the samples in simulated saliva, and satisfactory results were found in its application in dental implants.
Materials and methods
The substrate used in this study was a titanium commercial foil (ASTM F67 Grade#2). The samples were obtained through electrochemical methods using the Ti foil as the working electrode and cooper as the counter electrode. All the chemicals were of analytical grade and used without further purification. An illustration of this procedure is available in Supplementary material 7 (FIG. S7).
TiO2 NTs synthesis by anodization with a CP
TiO2 NTs were synthesized using the anodic oxidation method in an organic solution based on ethylene glycol containing ammonium fluoride (0.7 wt%) and water (10 wt%). The applied potential was constantly maintained at 30 V and the anodization time was varied (10, 20, and 30 min) to identify the best time for the next steps. Here, it was evaluated that the NT length, as described by Parcharoen et al. [Reference Parcharoen, Kajitvichyanukul, Sirivisoot and Termsuksawad14], is at approximately 700 nm for these applications. The sample produced here will be used as a pattern and denominated TiO2_NTs.
HA synthesis
HA was synthesized by the precipitation method using chicken eggshells as the precursors of calcium oxide. First, the eggshells were washed and calcinated to obtain calcium oxide (CaO), which was reacted to convert it into Ca(OH)2. Afterward, phosphoric acid was added and heated, and the pH was maintained from 9 to 11 through the addition of NH4OH. The obtained solid was filtered and washed with water. The obtained powder was dried and calcinated before its characterization.
Obtention of TiO2 + HA in CP
After choosing the best anodization time, the TiO2_NTs were electrodeposited with HA. The order effect of the HT was evaluated with respect to the composition and morphology of the samples. Two samples were obtained: TiO2NTs_HT_HA, where the HT was made before the HA electrodeposition, and TiO2NTs_HA_HT, where the HT was made after the HA electrodeposition. In both samples, before electrodeposition, we made a surface treatment with NaOH at 50 °C for 2 min. The solution that was used for the electrodeposition was composed of HA (1.0 mM) and NaCl (0.15 M). The pH was adjusted to 7.2 and the solution temperature was maintained at 80 °C during the process. A potential of 2.5 V was applied for 10 min to electrodeposit the HA.
Obtention of TiO2 + HA in AP
For pulse anodization, the solution that was used was based on ethylene glycol containing sodium fluoride (0.63 wt%), HA (0.1 wt%), and deionized water (10 wt%). The pH of the solution was adjusted to 7.2 and the temperature was maintained at 50 °C during the process. An alternated square wave potential of −2 V (0.1 s)/+8 V (1.0 s) was applied to the electrochemical cell (see the figure in Supplementary material 8), achieving a total time of 660 s. To compare the systems obtained, two samples were prepared using this methodology: the first using a Ti sheet as a working electrode (SS_TiO2 + HA) and the second using a previously anodized Ti sheet as a working electrode, which was produced as described in the section “TiO2 NTs synthesis by anodization with a CP” (DS_TiO2 + HA). Before this electrochemical procedure, the samples were treated in NaOH (1.0 M) at 50 °C for 2 min.
Heat treatment
After obtention of the samples described above, they were heat treated in air at 400 °C for 180 min.
Chitosan bioactivation
Chitosan bioactivation was made through electrodeposition on the surface of the SS sample, resulting in the SS_TiO2 + HA_CHI sample. A solution composed of chitosan (1.0 wt%) and acetic acid (0.25 wt%) in water was used, with its pH adjusted to 5.5. Prior to its use, this solution was filtered to remove the undiluted reagent, which was followed by electrodeposition at a CP of 1.5 V for 10 min.
Characterization
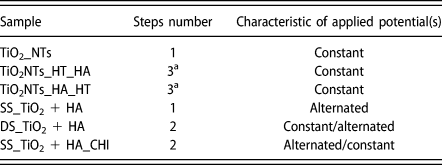
Table II shows the samples obtained, as previously described. All graphs were plotted with software OriginPro8 (OriginLab Corporation, Northampton, Massachusetts, USA).
Samples nomenclature and procedures.
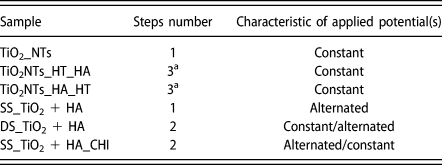
a Indicate that one of the steps was HT.
Scanning electron microscopy
SEM was used to analyze the surface characteristics of the obtained samples. The equipment used was an FEI Quanta 200FEG 30 kV (FEI Company, Hillsboro, Oregon, USA) and a Tescan FEG MIRA 3 (Tescan, Brno-Kohoutovice, Czech Republic). EDS was used to detect probable elements in the samples.
Transmission electron microscopy
TEM analysis was made to characterize HA as synthesized. EDS detector attached to TEM allowed to prove the material composition. It was used an FEI Tecnai G2 200 kV (FEI Company, Hillsboro, Oregon, USA).
X-ray diffraction
To make XRD analysis a Shimadzu XRD-7000L (Shimadzu, Kyoto, Japan) with Cu Kα radiation (1.5406 Å) was used, with a scan rate of 1°/min from 10 to 80°. To identify crystalline phases, the Powder Diffraction File (PDF) files were used: #21-1272 (anatase), #21-1276 (rutile), #44-1294 (titanium), and 9-363 (delta-calcium phosphate).
UV-vis spectroscopy
It was used an Agilent Cary-300 (Agilent, Santa Clara, California, USA) with integrating sphere to make diffuse reflectance analysis.
Raman spectroscopy
Raman was used to identify the composition and crystalline phase of the samples by inelastic scattering. The analysis was performed in a WITEC Alpha 300 Raman confocal microscope(WITEC, Ulm, Germany).
Electrochemical measurements
The electrochemical measurements of potentiodynamic linear polarization and EIS were carried out with a potentiostat Autolab 128N (Metrohm, Herisau, Switzerland) in an electrochemical three-electrode cell. The reference electrode was Ag/AgCl (3.0 M KCl), the platinum was used as a counter electrode, and the working electrode was the test specimen analyzed. In both measurements, the electrolyte consisted of artificial saliva solution (described in Table SII), nearly neutral pH, at 37 °C and was applied to the surface area of 1 cm2 in all the samples.
For the potentiodynamic linear polarization, the tests started −0.2 below the open circuit potential (E OC) and ended in 1.2 versus Ag/AgCl. The scan rate was 10 mV/s. The EIS analyses were carried out with samples immersed for 90 h in artificial saliva solution. The frequency range was of 10−2–105 Hz, using a 10 mV peak-to-peak sinusoidal potential amplitude.
Supplementary material
To view supplementary material for this article, please visit https://doi.org/10.1557/jmr.2019.23.
Acknowledgments
The authors thank CNPq (Conselho Nacional de Desenvolvimento Científico e Tecnológico), FACEPE (Fundação de Apoio à Pesquisa do Estado de Pernambuco), and CAPES (Coordenação de Aperfeiçoamento Pessoal de Nível Superior) for financial support and grants. They also thank the technical support of CETENE (Centro de Tecnologias Estratégicas do Nordeste).