I. INTRODUCTION
The formation of the most ubiquitous engineered structural material concreteReference Van Vliet, Pellenq, Buehler, Grossman, Jennings, Ulm and Yip1,Reference Amato2 is a complex reaction by which the cementitious binding phase is obtained by mixing calcium silicates with water.Reference Allen, Thomas and Jennings3–Reference Bullard, Jennings, Livingston, Nonat, Scherer, Schweitzer, Scrivener and Thomas5 As in all such complex hydrated composite materials that are nucleated in situ, it has remained challenging to validate which phases form (i.e., when and where). As a result, while several material processing steps are appreciated empirically, the dynamics of the interfacial hydration reaction mechanisms are understood poorly.Reference Gartner, Young, Dadot and Jawed4,Reference Yip and Short6 This limitation has confounded the development of new models and materials processes to manipulate the reaction kinetics and resulting properties of the phases,Reference Van Vliet, Pellenq, Buehler, Grossman, Jennings, Ulm and Yip1 as well as interpretation of laboratory-scale experiments that ostensibly monitor the formation of calcium-silicate-hydrates (often denoted C-S-H). In this particular class of hierarchical structural materials, the onset of hydration and C-S-H formation is thought key to overall reaction kinetics and subsequent mechanical durability of the hardened material. Furthermore, under realistic hydration conditions in presence of CO2, reaction kinetics are further complicated by the formation of thermodynamically favorable carbonate by-products. Despite the crucial need to quantify mechanisms of early-stage hydrate formation at the microscale and its relation to carbonate formation, current understanding is based chiefly on observations in cement pastes at the macroscale. The underlying assumption is that the predominant chemical and hydration mechanisms are shared across these length scales.
At the macroscale, hydration of the calcium silicates to form C-S-H in the bulk is well known to overwhelmingly dominate the occurrence of surface carbonation. Indeed, the predominance of hydration by-products in early-stage reactions provides the mechanical integrity of the so-called cement paste. Current efforts to quantify the early-stage reaction by-products at the microscale (rather than macroscale) are based mainly on impressively detailed yet indirect observations, such as soluble ion concentration, heat release rate, morphology of reaction by-products or soft x-ray analysis of silicate suspensions.Reference Gauffinet, Finot, Lesniewska and Nonat7–Reference Juenger, Monteiro and Gartner11 These approaches enabled comparative analysis of model systems, for example of nucleated phase morphology, but obfuscate clear identification of scale-dependent and competing chemical reactions and by-products. In this work, we present direct observations of interfacial hydration and carbonation of calcium trisilicate at microreaction volumes, which are essential to infer length scale-dependent hydration kinetics at the microscale in relation to macroscale observations. A typical example of a scale dependent phenomenon during bulk hydration is surface carbonation in calcium trisilicate pastes due to Fickian diffusion of atmospheric CO2 through the paste (detailed descriptions of relevant carbonation reactions described in SI and elsewhereReference Haselbach12). At the macroscale, classification of different carbonate phases (e.g., vaterite, calcite, amorphous carbonates) and intermediate by-products (e.g., portlandite) and mechanisms of carbonate formation has also been proposed for paste-level reaction volumes, often complemented by several characterization methods.Reference Young, Berger and Breese13–Reference Dubina, Korat, Black, Strupi-Suput and Plank17 At smaller volumes including the microscale, however, the applicability of these bulk mechanisms may not hold, due in part to the high surface-to-volume ratio at the microscale that can exacerbate evaporation effects. The balance between carbonation and hydration is determined by the surface area-to-volume ratio, which can vary from that of microscale inorganic particles to macroscale composite structures of meter-scale thickness. This multiscale variation also includes a broad range of conditions that influence carbonation during and well after this early-stage curing,Reference Haselbach12,Reference Severinghaus, Broecker, Dempster, MacCallum and Wahlen18,Reference Pade and Guimaraes19 with both immediate and long-term consequences to structural stability and aging of concreteReference Andersson, Fridh, Stripple and Haglund20 (Details in SI).
To our knowledge, no direct observations of the formation of hydration and carbonation by-products for microscale reaction volumes have yet been proposed for ambient CO2 concentrations present in air (<0.038 vol%). This work shows such incidental multiscale competition can occur at early reaction stages and depends on both the reaction volume and concentration of dissolved Ca2+ ions. While the chief byproduct of such solid and liquid reactions is hydrates under macroscopic and ideal environmental conditions and field materials processes, the findings described below indicate that nano to mesoscale formation models under realistic environmental conditions and laboratory experiments should consider the effects of presence of natural carbonation as an equally relevant microscale interfacial process during initial stages of cement hydration.Reference Amato2,Reference Yip and Short6 More generally, this environmentally reactive, multiscale-composite materialReference Yip and Short6 demonstrates the challenge and opportunity of materials process engineering afforded by direct, in situ, and spatially resolved quantification of microscale reaction products' chemical composition.Reference Bullard, Jennings, Livingston, Nonat, Scherer, Schweitzer, Scrivener and Thomas5
II. EXPERIMENTAL DETAILS: PICOLITER CONFINED HYDRATION DROPLETS
We used a novel experimental design to access both the morphology and chemical identity of reaction products at the microscale. (See SI for details.) We adapted an experimental design reported previously to study the nucleation of crystalline materials such as NaCl and macromolecules such as solvated proteins.Reference Grossier, Hammadi, Morin, Magnaldo and Vessler21 Through this approach, spatially and temporally controlled nucleation can be initiated by creating confined supersaturated solutions. This is achieved by creating an array of picoliter volumes of aqueous solution on a glass cover slip, covering the picoliter droplets with an organic liquid to encourage slow diffusion of water. The resulting array of supersaturated confined volumes allows the observation of nucleation and growth processes via an optical microscope. Time-lapse image acquisition (and related image analysis) and in situ Raman spectroscopy were conducted within microscale regions within individual droplets, as described below. The former was used to quantify the growth kinetics of reaction by-products, while the latter was used to characterize the chemical and mineral identity of the hydration and carbonation by-products.
III. RESULTS AND DISCUSSION
A. Morphological characterization of microscale reactions
To identify the chemical attributes of microscale reaction products formed when water is mixed with this model calcium silicate phase under ambient conditions, the monoclinic tricalcium silicate Ca3SiO5 (C3S), we conducted optical and microRaman spectroscopy (μRS) (see Methods in the SI) under two different conditions: high initial ratios of water-to-solid (w/s ∼ 100) and lower ratios typical of infrastructural cement pastes [w/s ∼ 0.5 (Ref. 22)]; see SI and Figs. S.1–S.4 for Methods. While calcium silicates used in cement clinkers can contain elemental impurities including Al and Fe, we chose C3S (the predominant component) to minimize the range of chemically distinct reaction products. The findings from both microRaman and time-lapse optical studies were then compared to bulk macroscale cementitious systems in which the reaction interface between cement and water is not directly accessible. Hardened cement pastes with w/s ∼ 0.5 were hydrated for durations ranging between several hours to 1 wk.
Morphological changes and growth regimes upon exposure of tricalcium silicate to water were monitored via time-lapse optical microscopy [Fig. 1, see also Fig. S.3(a)], using an experimental technique developed by Grossier et al.Reference Grossier, Hammadi, Morin, Magnaldo and Vessler21 to visualize crystal nucleation, as described in Experimental Details and in SI. Note that this optical analysis provides a basis of visual and quantitative comparison with others' morphological characterization but does not chemically identify the observed products. Here, we tracked evolution of product reaction in picoliter-scale droplets of supersaturated, degassed aqueous solutions containing tricalcium silicate microparticles (details in SI). Reaction droplets were surrounded by paraffin oil to slow but not completely eliminate evaporation or gas exchange22,Reference Grossier and Van Vliet23 ; complete water evaporation occurred after 15 h. Image analysis of reaction product growth rates quantified interface motion away from the immersed particles [Fig. S.3(b); details in SI]. Figure 1(a) illustrates the growth of the hydration product interface, indicating projections extending radially such that growth fronts (red arrows) can be approximated by arcs. The measured growth rate of this interface, for C3S particles within NaOH-containing droplets at pH 12, was ∼0.5 μm/h. In every droplet exhibiting byproduct growth, once the reacting particles were covered with this distinct phase, we then observed a transition in the growth front at later times. The stable, radial progression then became “finger-like,” dendritic projections of distinct optical contrast [Fig. 1(b) and Fig. S.8].
Evolution of the product growth front inside an aqueous microdroplet. (a) Evolution of the reaction growth front of a reaction byproduct during hydration of tricalcium silicate, by optical microscopy (scale bar: 5 μm). Calcium trisilicate particles, indicated by the red arrow, contribute to the growth of the product. Initially (in this case, from 1–5:20 h), the growth front can be approximated as a smooth arc. Eventually (in this case, after 5 h), the growth front breaks up to develop rough “finger-like” projections. (b) The increment in the radius of the byproduct is measured directly from the optical images, as described in the SI. The growth evolution follows a series of linear regimes (black lines: linear fits). The overall growth profile does not follow a power law, R ∝ t α with α ≤ 0.5 (shown as a red curve in the inset), which is typical of a diffusion-limited growth regime.22,Reference Grossier and Van Vliet23

Particles exhibiting growth in Fig. 1 were covered within 6 h by the radially expanding reaction product; after this time, irregular projections initiated. This observation is consistent with a previous atomic force microscopy-based analysis of growth from lime-wetted tricalcium silicate pellet surfaces, in which Garrault et al. reported an initially flat precipitate (up to at least 4 h) that then transitioned to a less dense, porous topography; see Fig. S.5 and discussion.Reference Garrault, Finot, Lesniewska and Nonat8 Although those authors did not report the transition time, in the present experiments we found the initiation of the unstable growth front to vary among droplets, due ostensibly to particle geometry, interparticle spacing, and/or crystallographic orientation of the exposed facets. This morphological transition has been interpreted previously as a transition from interface-controlled to diffusion-driven kinetics.Reference Garrault, Finot, Lesniewska and Nonat8,Reference Severinghaus, Broecker, Dempster, MacCallum and Wahlen18
To further characterize the growth kinetics and possible controlling growth regimes, we measured the radial evolution of the expanding byproduct fronts as a function of time (as described in SI and Fig. S.6). Diffusion-limited, circularly spreading growth fronts are typically well described by power laws R ∝ t α (α ≤ 0.5), whereas interface-controlled reaction kinetics are linear with time t.Reference Reuter, Gerth and Kirschner24,Reference Ferralis, El Gabaly, Schmid, Maboudian and Carraro25 Our measured growth evolution was initially linear [Fig. 1(b), inset], highlighting the interface-controlled kinetics of the early stage reaction.Reference Ferralis, El Gabaly, Schmid, Maboudian and Carraro25 The differing transitions from linear regimes among regions also emphasize the competition between the growth mechanisms at the reaction front with the variable diffusion rate of reagents at the source (tricalcium silicate) particle (Fig. S.7). The subsequent irregular projections resulted from partial dissolution of the tricalcium silicate and water evaporation [Fig. 1(a), Figs. S.7 and S.8].
B. Chemical characterization of microscale reactions indicates predominant carbonation
Detailed interpretations of these growth mechanisms should not rely on an a priori assumption that C-S-H is the major reaction byproduct. We thus tested the validity of the assumption that C-S-H is the predominant reaction product within these microscale reaction volumes (which would support mechanisms proposed by Juenger et al.Reference Juenger, Monteiro, Gartner and Denbeaux10; see SI) by explicitly identifying the chemical composition via μRS. RS is a critical approach for the characterization of chemical and mineral species in complex multiscale composites such as cementitious materials. In the context of industrial composites, RS is usually used at advanced stages of hydration for bulk cement pastes,Reference Black26–Reference Potgieter-Vermaak, Potgieter and Van Grieken28 rather than the early stages of interest herein. (See SI for details and methods of RS experiments.) To our knowledge, this study is the first to leverage μRS to characterize the early stages of hydration and carbonation of calcium trisilicate for microscale reaction volumes. The key benefit of microRaman is comparable length scales of the probed volume and that of either the droplet (for microscale reaction volumes) or the near-surface region of a hydrating paste (for macroscale reaction volumes).
Figure 2 shows Raman spectra for tricalcium silicate particles hydrated for 2.5 h under the same conditions used to quantify morphological growth rates. The microscale interaction volume afforded spectral acquisition at several distinct locations. Based on the presence of very prominent peaks at 281 and 1085 cm−1 (corresponding to calcite) and the absence of any spectral signature corresponding to C-S-H, we identified the main product to be crystalline calcium carbonate (CaCO3), rather than C-S-H (Fig. 2). It is expected that the Raman spectral sensitivity to calcium carbonates is approximately 30 times greater than that of C-S-H [defined by a broad spectral shoulder originating from Q1 silicates at 600–700 cm−1 (Ref. Reference Black26–Reference Potgieter-Vermaak, Potgieter and Van Grieken28)], so the co-existence of both carbonate and hydrate phases cannot be excluded entirely from this observation alone. Alternatively, C-S-H formation can be assessed through reduction in peak intensity corresponding to the silicates on the anhydrous calcium trisilicate (∼841 and 993 cm−1), and the formation of other intermediary by-products (such as calcium hydroxide or portlandite). However, in the present experiments, no intensity reduction of the C3S peak was observed, and a strong carbonate peak was present; this also supports the interpretation of these spectra as carbonate-dominated. We note that the observed calcium carbonate was found consistently and homogeneously throughout any point of the extending front that was observable via optical microscopy, and no by-products were detectable via microRaman signatures between the leading edges of the optically visible carbonate reaction fronts. Furthermore, within the time scale of early hydration prior to the acceleration period (2.5 h), significant formation of dense C-S-H by-products is not expectedReference Bullard, Jennings, Livingston, Nonat, Scherer, Schweitzer, Scrivener and Thomas5 and has not been observed previously.Reference Gallucci, Mathur and Scrivener29 Thus, despite the similar morphologies and growth rates of this product to previous reports of putative C-S-H,Reference Juenger, Monteiro, Gartner and Denbeaux10,Reference Grossier and Van Vliet23 we find that the early stage microscale product obtained in dilute, degassed aqueous suspensions under ambient conditions is not a hydration product but rather a carbonation product. We highlight that the observed calcium carbonate was formed within the hydrated volume, not ex situ upon exposure to higher ambient CO2 concentrations, and the acquisition conditions of the Raman spectra were optimized to maintain the w/s ratio and minimally affect hydration (detailed in SI).
Raman spectra of system comprising C3S particles in NaOH pH 12 after 2.5 h of hydration. MicroRaman characterization of the chemical nature of the reaction by-products of hydration of tricalcium silicate C3S, for which growth rates were computed from time-lapse image analysis. Raman spectra of pristine C3S exhibited typical peaks at ∼841 and 993 cm−1. Raman spectra of the reaction byproduct of C3S in NaOH pH 12 after 2.5 h of hydration were acquired at locations marked by a white cross in the inset optical image (scale bar: 5 μm). Spectral bands of the reaction by-products at 281 and 1085 cm−1 were consistent of those of calcium carbonate, which is formed by CO2 diffusing through the paraffin oil. Inset: Optical micrograph showing the radially symmetric by-products (white arrows), extending from irregularly shaped C3S microparticles (yellow arrows). These products share the same growth morphology as to those in Fig. 1(a).
The rapid emergence of a stable crystalline form of calcium carbonate for microscale chemical reaction volumes (as probed with μRS in the pL droplet experiments as opposed to macroscale pastes) is in contrast with the formation of various surface carbonate phases in macroscopic pastes, from amorphous to vaterite and calcite.Reference Garbev, Stemmermann, Black, Breen, Yarwood and Gasharova15–Reference Dubina, Korat, Black, Strupi-Suput and Plank17 This points to a rapid carbonate formation at the microscale, induced by a rapidly changing solvent composition within the microscale chemical reaction volume and enhanced by water evaporation, that is not common or expected within the calcium silicate hydration that proceeds in typical macroscopic bulk pastes.
C. Time and length scale-dependent susceptibility to carbonation
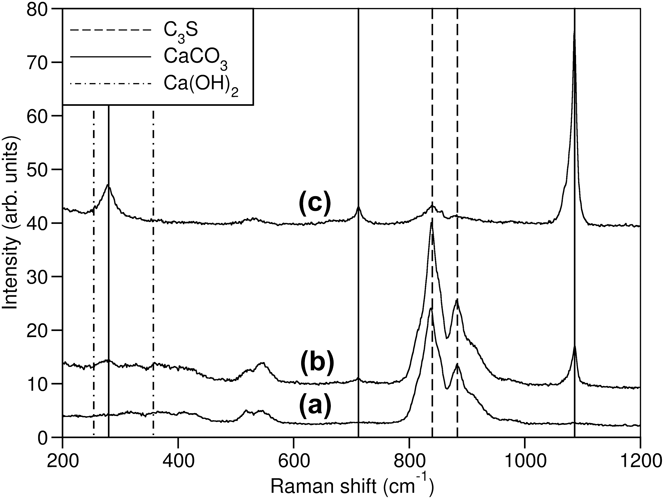
While not the chief product of calcium silicate hydration in typical bulk synthesis of cement pastes or concrete used for structural applications, the formation of surface carbonate by-products is usually artificially induced under CO2 rich hydration conditions, rather than normal ambient conditions. Therefore, one may question the relevance of hydration and carbonation in microreaction volumes in relation to standard bulk processing conditions. We note that these experiments in pL-scale confined environments differ from typical bulk processing of cement pastes in two key characteristics: (i) water/solid ratio, w/s; and (ii) surface area-to-volume ratio, s/v (i.e., microscopic scale reaction volumes). Given that carbonation occurs through dissolved CO2 in the aqueous media over several hours of observation, one would expect the high w/s ratio in the droplets to be the principal cause of carbonation, and that larger scale experiments at similarly high w/s ratios should also promote carbonation. However, this was not the case: Fig. 3(a) shows no evidence of calcium carbonate from the Raman spectra of a cement suspension with 108-fold greater mass of tricalcium silicate particles, as compared to pL-volume droplet experiments. Clearly, high w/s ratio is not the main driver toward extensive microscale carbonation.
Role of length scales of reaction volumes in carbonate formation at the early stages of tricalcium siliate (C3S) hydration. (a) Raman spectra of a suspension of 500 mg of C3S in 50 mL of water, with high water-to-solid ratio (w/s = 100) after 6 h of hydration: This paste had a 108-fold increase in tricalcium silicate mass as compared to picoliter-volume droplet experiments. The absence of the band at 1085 cm−1 indicates the absence of carbonates. (b) Raman spectra of the same amount of C3S as in (a) after 6 h of hydration with uncontrolled evaporation of the aqueous media, but with a much lower water-to-solid ratio (w/s = 0.5) than that used in the picoliter-volume droplet experiment. Carbonation is clearly identified by the band at 1085 cm−1. (c) The significantly higher intensity of the carbonate peak in the Raman spectra of the same hydrated C3S in (b), but after laser-induced enhanced water evaporation, shows that enhanced evaporation strongly favor carbonate formation, even at larger reaction volumes.
It is known that carbonation is enhanced if the w/s ratio was reduced to approach levels typical of cement paste synthesis in excess of CO2. Figure 3(b) shows that a cement paste of w/s ratio reduced to 0.5, mixed and then cured for 6 h in air with uncontrolled evaporation of aqueous media leads to formation of calcium carbonates. We infer that the change in surface area/volume ratio leads to a substantially different and dominating surface reaction dynamics, which cannot necessarily be assumed to remain the same as in bulk. Furthermore, the extreme sensitivity to carbonation for microscale reaction volumes, and the low levels of CO2 needed (<0.038 vol%) to promote this, underscores the essential requirement of assessing in situ and in real time the dynamical evolution of the reaction product composition under realistic environmental conditions that include such species. Whenever such conditions cannot be satisfied (e.g., ex situ or in vacuo), only a static snapshot of the reaction conditions and by-products can be expected; such conditions can also modify the by-products via exposure to air and/or dehydration.
To further demonstrate the crucial role of water evaporation in the preferential formation of calcium carbonate, we artificially enhanced the formation of calcium carbonates by accelerating evaporation at ambient, constant (CO2) via heating induced by the Raman excitation laser-probe at full power [Fig. 3(c), with details in SI]. We note that while a nonadiabatic environment within the micro reaction volume limits the quantification of heat transferred by the laser, optimization of the laser power levels between 1 and 50 mW/m2 was sufficient to guarantee from none to rapid evaporation. Further, based on the kinetic analysis of growth mechanisms above, we posit that the mobile species within the aqueous media are the Ca2+ ions supplied from the C3S particle. During interface-controlled growth, evaporation increases the local concentration of Ca2+ ions, due to both continued ion leaching from the tricalcium silicate particle and reduced water volume. Once a critical concentration of Ca2+ ions is reached at the microscale, cations are available for two competing reactions: hydration and/or carbonation. Our findings show that the thermodynamically preferred reaction is carbonation. Even assuming that hydration by-products could form under these conditions but that their spectral signature was to be below detection limits (due to the low Raman spectral sensitivity of C-S-H compared to carbonates), the very rapid reaction times (below 5 s) would not be favorable toward the much longer the formation time of C-S-H.Reference Bullard, Jennings, Livingston, Nonat, Scherer, Schweitzer, Scrivener and Thomas5,Reference Gallucci, Mathur and Scrivener29 From these results, we conclude that susceptibility of cementitious systems to carbonation is modulated strongly by the evaporation rate of aqueous media—and therefore by the locally high concentration of Ca2+ ions that can depend on reaction volume or calcium silicate volume—but not by the initial ratio of water to calcium silicates.
D. Mechanisms of carbonation, hydration acceleration, and suppression
Microscale understanding of the evolution of Ca2+ supersaturation induced by evaporation is essential in optimizing carbonate formation, whether enhancement or suppression is the goal. Such insight applies to both applications and mechanistic studies of interfacial growth of hydration products in cementitious materials. Furthermore, while it is typically desirable to promote hydration over carbonation in macroscale structures, in specific applications the capacity to control and therefore tune early stage carbonation at the microscale may facilitate certain hydrate/carbonate mixtures.Reference Rostami, Shao, Boyd and He14 Thus, we investigated potential chemical approaches to control and reduce surface carbonation during early stage hydration induced by enhanced evaporation, benefiting from ability to probe microscale volumes with μRS. We note that such approaches to modulate carbonation can also be explored empirically, for example in enabling chemical reactions that prevent Ca2+ and CO2− ions from reacting.Reference Morse and Luttge30 However, μRS can elucidate the reasons why such processing conditions work.
For evaporation-influenced carbonation, aqueous media is the source of both Ca2+ and CO2− ions. Use of an acidic aqueous medium could suppress carbonation by effectively increasing the solubility limit of calcium carbonateReference Morse and Luttge30 without solvating the Ca2+ ions required of hydration products, such as C-S-H and Ca(OH)2. We explored this possibility by comparing early-stage cement pastes hydrated with neutral deionized water and acidic HCl (pH 2) solution. Note that this strategy is most effective within the first ∼10 h of hydration when the paste is moist (i.e., damp but not immersed). Figure 4(a) compares Raman spectra of cement pastes of w/s = 0.5 using water or this acidic media and hydrated in a high relative humidity environment to minimize evaporation of aqueous media. Hydration spectra at 3 h showed early signs of carbonate formation for pastes initiated with water.
Carbonation dynamics through hydration acceleration and suppression. (a) Calcium carbonate formation induced by water evaporation is mitigated through the use of acidic aqueous medium, as indicated by the low intensity of the calcium carbonate band in the Raman spectra on the surface of C3S pastes mixed an aqueous solution of HCl pH 2 after 3, 6, and 10 h of hydration. (b) The crucial role played by evaporation in carbonate formation is evident in the absence of CaCO3 Raman band in the bulk of C3S pastes mixed with deionized water and HCl pH 2 after 10 h of hydration. The intensity of the CaCO3 band is instead rather significant at the surface of the same paste. (c) Reduction in surface carbonation and increase in paste hydration homogeneity are also achieved by extending the initial mixing time (5 and 30 min, respectively, with hydration times up to 75 h). (d) Schematic of surface carbonation mechanisms induced by the gradient in CO2 concentration from the environment into a suspension or paste. Scale bar is approximate in this schematic.
We note that the carbonate signature at ∼1085 cm−1 (Ref. Reference Black26) is broad compared to standard crystalline calcite, suggesting the structure is not fully crystalline or includes other carbonate polytypes such as vaterite [Fig. S.9, Refs. Reference Garbev, Stemmermann, Black, Breen, Yarwood and Gasharova15–Reference Dubina, Korat, Black, Strupi-Suput and Plank17]. The principal hydration product, low density C-S-H,Reference Gallucci, Mathur and Scrivener29 at very early stages of hydration may have a similar morphology as carbonation, underscoring the importance of chemical characterization of early stage reaction products. In contrast, pastes hydrated with acidic media exhibited a spectral band at ∼1085 cm−1 of lower intensity after 3 h, indicating the presence of little or no carbonates; but spectra at later times up to 10 h in these samples showed comparatively sharper carbonation signatures. At these later time points, it is likely that acidity of the aqueous medium was not maintained sufficiently controllable to prevent the precipitation of calcium carbonate: continuous dissolution of tri-calcium silicate in the aqueous media increases the concentration of Ca2+ ions, eventually rendering acidity ineffective against carbonation. Thus, for aqueous media at initial pH 2, we find this critical time to be between 3 and 6 h.
Carbonation during early-stage hydration can also be suppressed, perhaps counter intuitively, via mechanical mixing that minimizes the exposure of given surface to air and thus to evaporation. These conditions have long been met empirically in macroscale processing, which typically includes copious addition of water at early stages and mechanical mixing of reacting suspensions. Figure 4(c) provides microscale analysis that elucidates one reason that this practice is beneficial: longer mixing times (30 min) reduced carbonate formation and promoted phase heterogeneity throughout the paste volume (probed through at least 20 μRS spectral scans), whereas brief mixing (5 min) in air promoted phase heterogeneity at only the paste surface. This observation supports the concept that mechanical mixing can overcome poor hydration conditions that would otherwise fail to homogenize the Ca2+ concentration throughout the macroscale volume itself and avoids imbalances due to longer exposures of a particular portion of the macroscale volume to air evaporation. Figure 4(d) summarizes this dependence of carbonation on CO2 gradients such as those extending from an air-exposed surface of the reacting aqueous suspension.
E. Relating reaction mechanisms across time and length scales
These results for microscale reaction volumes, contrasted with macroscale volumes, shape the understanding of “surface” and “bulk” regions within macroscale, hydrating calcium silicate pastes. For a microscale particle, hydration conditions can deviate substantially from the expected “bulk” behavior, similarly to the surface of a macroscale sample. Hence, the microscale reaction volume can be considered a realistic representation of the paste surface, and more generally of microscale regions exposed to even ambient CO2 concentrations. For example, the microscale reactions may favor carbonation at the bulk level at early-stage hydration of concrete with high degrees of air entrainment (i.e., many internal micropores, where the internal pore wall is exposed to the entrapped air during early-stage hydration).Reference Cebeci31,Reference Cultrone, Sebastian and Ortega Huertas32 In this way, it is not unexpected that the predominant reaction products differ as a function of length scale, as well as with time scale. For example, we did not observe significant spectral signature of hydration products such as Ca(OH)2 and C-S-H in the Raman spectra of these paste surfaces 10 h after initial mixing, for addition of either neutral or acidified (HCl, pH 2) water. (See SI and Fig. S.9 for discussion of longer time scales.) Referencing previous studies on pastes with similar hydration conditions (particle size ∼ 50 μm and w/s ∼ 0.5), this hydration time point lies toward the end and rate-maximum of the hydration kinetics acceleration period.Reference Bullard, Jennings, Livingston, Nonat, Scherer, Schweitzer, Scrivener and Thomas5,Reference Berliner, Popovici, Herwig, Berliner, Jennings and Thomas33 Given that the acceleration period is associated with the nucleation and growth of the C-S-H phase, the observed lack of C-S-H signature can be attributed directly to a retardation of C-S-H formation and to surface carbonation suppressing the formation of hydration products.
At the macroscale, preferential surface carbonation is appreciated in practice. Here, direct chemical analysis of microscale regions within such macroscale samples also facilitates comparison through the thickness of macroscale cementitious pastes (details in SI), to elucidate the role of initial mix chemistry in speed and extent of carbonation at the surface versus the interior. Figure 4(b) compares the Raman spectra for the surface and bulk, in pastes hydrated for 10 h upon mixing with pure H2O or HCl, pH 2. In spectra from bulk paste mixed with H2O, we observed a sharp peak at 350 cm−1 attributable to Ca(OH)2, as well as two broad crests at 600–750 cm−1 attributable to presence of both Ca(OH)2 and C-S-H. In contrast, spectra from the bulk paste mixed with HCl exhibited a single broad crest centered approximately at 680 cm−1. While this feature can be attributed to contributions from both C-S-H and Ca(OH)2, given the absence of a Ca(OH)2 peak at 350 cm−1, we assign this broad feature to the C-S-H phase. Additionally, we note that the acidic medium can deter the precipitation of Ca(OH)2. These results are consistent with the concept that the C-S-H phase nucleates and grows in the acceleration period.Reference Thomas, Jennings and Chen34,Reference Thomas, Biernacki, Bullard, Bishnoi, Dolado, Scherer and Luttge35 In sharp contrast to the bulk spectra, hydration products were not prominent spectral features of the paste surface [Figs. 4(a) and 4(b)] and therefore were substantially delayed compared to the bulk. This illustrates that surface carbonate formation in early stages of hydration for macroscale reaction volumes delays the formation of hydration products, such as Ca(OH)2 and C-S-H, and supports an evaporation-based model of carbonate formation [Fig. 4(d)] in pastes hydrated for less than one day. In short, the rapid evaporation leads to predominant and fast carbonation reactions that compete with and limit the hydration reaction over long time scales, in particular for microscale reaction volumes comprising Ca3SiO5 and H2O. This predominant carbonation in microscale reaction volumes is attributed to the fact that even subambient levels of CO2 act as an important reactant in concert with dissolved Ca2+ ions in such volumes. That predominance of carbonation within small reaction volumes is of note, particularly in design of experiments that aim to probe the hydration processes relevant to the dominant reaction product in macroscale volumes.
IV. CONCLUSIONS
In summary, direct chemical analysis of microscale reaction products formed when mixing tricalcium silicate with water purposefully carried out under ambient or low-CO2 conditions demonstrates the potential for an interfacial competition between carbonation and hydration for microscale reaction volumes (with high surface to volume ratio); the predominant product depends strongly on length and time scales. μRS confirms that calcium carbonates can nucleate heterogeneously on microscale Ca3SiO5 particle surfaces, over shorter time scales and to a greater extent than competing hydration reactions, for low water/tricalcium silicate ratios promoted by evaporation. We attribute decreased hydration to the depletion of calcium ions due to carbonate formation at such low water/tricalcium silicate ratios during the initial, interface-controlled growth of calcium carbonates. This carbonation can be an inadvertent byproduct in microscale, fundamental studies of hydration reactions or particle–particle interactions, even in degassed aqueous environments. Thus, micro- to mesoscale studies or interfacial materials process that aim to quantify early-stage hydration products and growth interfaces should not assume the chemical composition of microscale growth interfaces a priori based on ex situ morphological analysis in vacuum or in low-oxygen environments. Rather, such studies must be designed to account for realistic hydration environments that include surface sensitive reactivity phenomena (such as carbonation) that are not predominant in bulk, macroscale pastes.
The chemical insight of competing carbonation versus hydration processes at the microscale also indicates new interfacial processes to retard carbonation in microscale reactions, for example via acidification of the hydrating fluid, even under poor hydration conditions that may promote evaporation at exposed surfaces. Similarly, this approach enables systematic consideration of varying calcium silicate-based structures, compositions and impurity levels (beyond the model tricalcium silicate analyzed herein) that may promote the rate and extent of hydration. Further, this microscale analysis suggests engineering of the internal porosity to promote carbonation at the pore wall surfaces. Such iterative approaches to maximize the extent of hydration in macroscale applications of these cementitious materials can be guided by this understanding of competitive microscale reactions, which will inform and speed optimization of currently empirical processing methods and of predictive models.
Supplementary Material
To view supplementary material for this article, please visit http://dx.doi.org/jmr.2015.224.
ACKNOWLEDGMENTS
The authors acknowledge financial support from the MIT Concrete Sustainability Hub, with sponsorship provided by the Portland Cement Association (PCA) and the Ready Mix Concrete (RMC) Research & Education Foundation, and the U.S. Department of Homeland Security, Science and Technology Directorate, Infrastructure Protection and Disaster Management Division, under the direction of the Engineer Research and Development Center (ERDC), U.S. Army Corps of Engineers. We appreciate R. Grossier's implementation of the microdroplet apparatus and discussion of initial dissolution observations, as well as S. Yip and the late H. Jennings for helpful discussion.