DOHaD and heart disease
Cardiovascular disease (CVD) plays a major role in the genesis of human morbidity and mortality. Some of the earliest clues that early life stresses can predispose to severe health consequences in later life were the links found between perinatal dietary challenges imposed by war and famine and the increased risk for chronic later life CVD.Reference Barker1 Further human epidemiological studies and carefully controlled animal experiments established that both maternal nutrient restriction (MNR) and overnutrition predispose offspring to an increased prevalence of obesity, glucose intolerance, insulin resistance, endocrine and renal dysfunction, hypertension, and vascular dysfunction as well as heart disease that varies with the precise timing of the nutritional challenge.Reference Dong, Zheng, Ford, Nathanielsz and Ren2 These same insights have been reported in a variety of studies conducted in multiple countries over the last two decades.Reference Roseboom, van der Meulen and Osmond3,Reference Barker and Bagby4
The study of the developmental origins of health and disease focusses on the process of “developmental programming”, which aims to discover mechanisms that underlie adaptations to a poor nutritional environment and other challenges occurring during development. The premise is that responses to developmental challenges can enhance short-term survival outcomes, but in so doing alter the trajectory of development in many physiological systems (metabolic, cardiac, renal, neural, and reproductive). Consequently, programming predisposes an individual to be more susceptible to chronic diseases later in life.
During development, a series of epigenetic processes are central to normal fetal development. In utero challenges to the fetus such as nutrient restriction, fetal hypoxia due to placental insufficiency, anemia, maternal obesity, and overnutrition, respiratory disease, and/or preeclampsia elicit physiological adaptations aimed at overcoming nutrient deficiencies in order to maintain fetal viability.Reference Gluckman, Hanson, Buklijas, Low and Beedle5,Reference Agarwal, Morriseau, Kereliuk, Doucette, Wicklow and Dolinsky6 These challenges begin a process that includes other epigenetic changes that can predispose the offspring to CVD in later life.Reference Nathanielsz7 Key myocardial biomarkers resulting from these processes are ventricular remodeling and cardiac fibrosis.Reference Watson, Collier and Tea8 More recently, the life course consequences of exposure to perinatal environmental toxins due to maternal smoking, pollution, alcohol, and consumption of drugs of abuse have increased the scope of intensive programming investigations.Reference Lee and Lupo9,Reference Reid, Akison, Hoy and Moritz10
Epidemiological studies typically employ public medical databases and focus on diagnostic end points. This approach provides powerful distribution patterns, but lacks the ability to determine causative mechanisms by which malnutrition and other early challenges alter the physiology of maturation, life course disease pathology, and aging. Mechanistic pathways are best obtained in carefully controlled experiments studying appropriate animal models of fetal programming.
Application of classical physiological and molecular biological methods has improved specific understanding of the potential mechanisms involved in the developmental programming of CVD. For example, the expressions of cardiac-specific transcription factors have been shown to be disrupted during fetal development affecting the renin–angiotensin system (RAS).Reference Govindsamy, Naidoo and Cerf11 Altered expressions of angiotensin II type 1 and type 2 occur with perinatal hypoxia in many species, which result in impaired kidney development and lead to hypertension in adult life.Reference Blackmore and Ozanne12 Histone deacetylases have been shown to play complicated roles in cardiomyocyte development and are implicated in the programming of endothelial dysfunction.Reference van der Harst, de Windt and Chambers13 Also, sex-dependent accumulation of fibrotic tissue, activation of cardiac autophagy, and myocardial miRNAs were found in fetuses of baboons with calorie-restricted diets during pregnancy.Reference Muralimanoharan, Li and Nakayasu14 Changes in cardiac miRNA also have been demonstrated in the response to maternal obesity and high-fat diets.Reference Maloyan, Muralimanoharan, Huffman, Cox, Nathanielsz, Myatt and Nijland15 The degree to which each of these factors, and many others affecting multiple systems, combine to determine the phenotype of the programmed heart is still incompletely understood despite abundant knowledge of individual mechanisms.
In this review, we discuss the use of noninvasive cardiac magnetic resonance imaging (CMR) to evaluate developmental programming in both human cohorts and animal models with a spotlight on its ability to assess cardiovascular physiology. Although ultrasound has been widely used in obstetrical research, here we focus on CMR as an imaging modality that has unique and powerful capabilities to evaluate cardiovascular morphology, physiology, tissue microstructure, and biochemistry. We describe the technical capabilities of CMR, review the research reported to date, and discuss additional applications for potential exploitation of CMR in future studies on the developmental origins of CVD. The following discussion also will explain how CMR can not only produce information on physiological consequences, but also may provide insights into which cell types are susceptible to epigenetic modifications and other alterations relevant to developmental programming.
CVD imaging phenotypes in developmental programming
Until recently, technological limitations did not allow for a detailed understanding of the overall effect of disease progression in complex mammalian organisms. Now, advances in noninvasive quantitative imaging methods applied to whole organisms provide tools and methods for gaining new insights into underlying physiological and pathophysiological processes. For example, the details of atherosclerotic plaque progression were not appreciated until intravascular ultrasound became available in the 1990s, allowing physicians to discern the differences between vulnerable and stable coronary plaques and to appreciate the role of atheromatous plaque remodeling on coronary restenosis.Reference Alfonso, Macaya, Goicolea, In, Hernandez, Zamorano, Perez-Vizcayne and Zarco16 However, intravascular ultrasound is invasive and requires placement under fluoroscopy guidance, which can produce a significant radiation dose.
Ultrasound is a well-established and extensively used tool for obstetric evaluations of fetal and placental health, which can also be used to assess early life course adaptations to fetal stress exposures in humans. In studying developmental programming, echocardiographic investigations of late-onset small fetuses have reported relative increases in left ventricle (LV) sphericity (globular phenotype), LV length (elongated phenotype), and LV myocardial wall thickness (hypertrophic phenotype).Reference Crispi, Miranda and Gratacos17,Reference Rodríguez-López, Cruz-Lemini and Valenzuela-Alcaraz18 The hypertrophic phenotype has been attributed to early onset intrauterine growth restriction (IUGR) while the elongated and spherical phenotypes represent degrees of remodeling in late-onset IUGR.Reference Comas, Crispi, Cruz-Martinez, Figueras and Gratacos19 Further, fetal M-mode and Doppler echocardiography studies have revealed deficits in both systolic and diastolic function associated with IUGR.Reference Comas, Crispi, Cruz-Martinez, Figueras and Gratacos19
Echocardiography can also reveal CVD progression after birth. A study conducted in neonates deemed small for gestational age (SGA), both prenatally and at 6 months, showed a more globular cardiac shape prenatally and as infants compared to controls.Reference Cruz-Lemini, Crispi and Valenzuela-Alcaraz20 In addition, there were signs of systolic longitudinal dysfunction, both prenatally and postnatally, tricuspid annular plane systolic excursion, and diastolic dysfunction. In a separate study, Ponderal index was significantly lower, blood pressure was significantly higher, diastolic dysfunction was greater, and aortic intima-media thickness was significantly greater in term-born SGA infants compared to controls.Reference Sehgal, Doctor and Menahem21
Echocardiography also has been used in small animal models to study the mechanisms of CVD in the setting of fetal programming. High-resolution echocardiography has been used to evaluate the effect of a prenatal hypoxic insult on cardiovascular function in a rat model of IUGR.Reference Rueda-Clausen, Morton, Dolinsky, Dyck and Davidge22 This study revealed an increased susceptibility to additional stresses, such as myocardial ischemia, for offspring with hypoxia-induced IUGR. The same group studied a placental hypoxia rat model, using echocardiography to demonstrate improved diastolic function in 7-month-old female rat offspring, whose mothers had been treated prenatally with the antioxidant, MitoQ.Reference Aljunaidy, Morton and Kirschenman23 Administration of a low-protein diet during pregnancy and lactation to Wistar–Kyoto dams was found to reduce aortic peak systolic velocity measured by echocardiography in 18-week-old offspring.Reference Zohdi, Pearson and Kett24
Transthoracic echocardiography is widely employed to assess cardiovascular hemodynamics, yielding physical parameters that are used to characterize blood flow. The success of studies that have used echocardiography to identify CVD imaging phenotypes of developmental programming, in both humans and rodents, implies that there may be applications for other noninvasive imaging technologies with greater levels of sensitivity that can discern additional characteristics related to heart structure and function. Echocardiography is convenient due to its availability, relatively low expense, portability of the equipment, and high temporal resolution. However, the ultrasonic imaging process relies on a sound beam entering and leaving the body through the standard “acoustic windows”, which often necessitates visualizing deep structures from limited perspectives. In addition, studies may have inadequate image quality due to the inability to compensate for respiratory variation and lack of operator skill. Echocardiography also suffers from numerous artifacts that are associated with the physics of sound reflection and refraction in the body, ultrasound beam properties, and/or transceiver electronics.
CMR is equally noninvasive and can generate extensive physiological information about subclinical functional and structural abnormalities of the heart. Like ultrasound, CMR can be used multiple times across the life span of a subject to follow the trajectory of the cardiovascular changes without dangers such as repeated ionizing radiation exposure. However, some patients may not be able to tolerate CMR well, being anxious at confinement in a tube for up to an hour or unable to hold their breath during data acquisition. Patients with arrhythmias or who present challenges in detecting ECG vectors make it difficult to obtain static images at specific times in the cardiac cycle. In conventional cine CMR, magnetic field inhomogeneities can produce black lines that have to be avoided. Also, signal voids in the anterior LV wall can appear due to sternal wires in patients who have had thoracic surgery. Other artifacts that appear include chemical shift artifacts that present as the signal from pericardial fat overlapping the myocardium and ghosting artifacts due to pulsatile flow of blood in the pulmonary arteries and aorta. This article explains the particular advantages of using CMR to evaluate the interrelationships of fetal programming and life course and aging cardiovascular changes.
Cardiac MRI evaluations of heart anatomy, physiology, and biochemistry
Almost four decades after its establishment as an effective clinical diagnostic modality, CMR also is becoming recognized as a research tool that can produce quantitative imaging biomarkers to understand both normal and subtly dysregulated biological processes. CMR is a specialized application of MRI that includes a group of tools that have been developed to assess cardiac function and structure. In particular, CMR can be used to evaluate both rest and stress left ventricular (LV) and right ventricular (RV) function and anatomy, atrial function/anatomy, ventricular stresses and strains, tissue composition, the biochemical environment, pericardial fat deposition, and blood flow within vessels and chambers.
Since the clinical introduction of MRI in the early 1980s, CMR has exhibited the capability to measure important cardiological parameters with great flexibility and high precision. These assessments all are performed in vivo, requiring only that the subject stay immobile during scanning, probably having to perform a breath hold during each scan. A few CMR measurements also utilize exogenous contrast agents, which are injected intravenously. In spite of its general acceptance, the scope of utilization of CMR largely has been limited because of instrumentation cost, availability, and the technical skill required to successfully perform quantitative CMR studies and analyses.
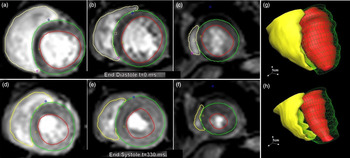
It was soon recognized that CMR could produce accurate measurements of LV volume and myocardial mass.Reference Keller, Peshock and Malloy25 However, these early studies covered limited portions of the heart and were not time or cost-efficient. Acquisition of lines of CMR image data are triggered to an ECG signal and are acquired during a series of heartbeats to create an image. The development of breath-hold segmented gradient-echo CMR techniques allowed reduced data acquisition which lowered scan time to 15–20 heartbeats, allowing accurate assessments of LV function.Reference Buser, Auffermann, Holt, Wagner, Kircher, Wolfe and Higgins26 Initially, the motion of a single myocardial slice could be imaged as a cine loop across the R-R interval. With modern hardware and image reconstruction methods, multiple slices and currently, the entire beating heart can be imaged in a single breath hold. Although they are readily visualized on CMR, the papillary muscles and trabecular tissues typically are routinely ignored in measurements of ventricular volume, in order for CMR results to be comparable to those obtained from modalities in which these structures cannot be identified. Being able to measure ventricular volumes at end-diastole (ED) and end-systole (ES) allows for the direct calculation of ejection fraction, stroke volume, and cardiac output (Fig. 1a–f).Reference Soldo, Norris and Gober27 The ability to measure LV and RV volumes at ~30 ms intervals during a cardiac cycle enables measurements of ventricular ejection rates and ventricular filling rates. Further, the disordered backflow due to regurgitation can be visualized in these cine images as black jets (signal voids) that are a sign of valvular insufficiency.Reference Spielmann, Schneider, Thiele, Heller and Bücheler28 Today, a typical whole-heart cine CMR study typically is 25–30 cardiac phases and 20–25 slices of the heart, comprising a total of 500 or more images.
Determining the functional phenotypes from these image datasets requires delineation of the cardiac boundaries. Performed manually, this is a very time-consuming process, so state-of-the-art techniques incorporating machine learning have been developed for the automatic and semi-automatic segmentation of cardiac structures and calculation of physiological parameters.Reference Peng, Lekadir, Gooya, Shao, Petersen and Frangi29 Several cardiac image analysis software products are available, both commercial and freely available packages.Reference Heiberg, Sjögren, Ugander, Carlsson, Engblom and Arheden30,Reference Leng, Ge and He31 Most of the MRI system manufacturers also offer cardiac post-processing modules. Fig. 1 shows the steps performed for a typical baboon heart segmentation of the RV and LV using the cmr42TM cardiac image analysis software (Circle Cardiovascular Imaging Inc., Alberta, Canada).
Selection of left ventricular (LV) subendocardial margin (red lines), LV subepicardial margin (green lines), and right ventricular (RV) subendocardial margin (yellow lines) is performed manually or semi-automatically for up to 20 slices. Typical basal slice (a), midventricular slice (b), and apical slice (c) are shown at end-diastole (ED). Basal slice (d), midventricular (e), and apical slices (f) are also determined at end-systole (ES) and at 25–30 cardiac phases in between. From these data, full RV and LV volumes can be reconstructed at ED (g) and ES (h).

One reason for the limited use of CMR is that many clinically important measures can be obtained using other, more established, imaging modalities. Biplanar fluoroscopic X-ray angiography and multi-detector X-ray computed tomography (CT) can both visualize the ventricular lumens and provide model-based estimations of ejection fraction and cardiac output. However, these modalities come with risks to the patient from iodinated contrast agents and ionizing radiation exposures. Radiation risks also may be greater in pediatric patients.Reference Trattner, Chelliah and Prinsen32 Single-photon emission computed tomography (SPECT) can also produce ejection fraction estimates, but also imposes a radiation burden and has inherently poor spatial resolution compared to CMR.
Echocardiography can be used to evaluate LV function with high temporal resolution and essentially no biological risk. However, the application of echocardiography may be impaired by the depth of tissue penetration of the ultrasound beam and the limited availability of adequate acoustic windows. Echocardiography is highly operator dependent, requiring manipulation of the ultrasound transducer by a skillful sonographer. Also, echo measurements of RV and LV volumes rely on geometrical assumptions based on a limited number of views, while CMR measures each ventricle in its entirety, slice-by-slice.
Although the absolute size of heart structures can be determined by CMR with high accuracy and reproducibility, it is well-established that the absolute sizes, volumes, and rates of cardiac parameters are strongly associated with body size.Reference Kleiber33 Thus, a method to assess relative differences, independent of body size is desirable. The most common method to address this variability is by indexing to body surface area (BSA), though in some situations myocardial mass is referenced. Estimation of BSA itself is no trivial matter, often relying on approximations using formulas based on height/length, weight, or both. Allometric indexing of intracardiac areas to BSA during normal growth has also been validated, although linear dimensions should be indexed by the square root of BSA and volumes should be indexed by BSA to the 1.5 power.Reference Gutgesell and Rembold34 Despite this limitation, normalization to BSA has proved useful for various measurements of the LV, RV, aortic root, and pulmonary vein.Reference Gutgesell and Rembold34,Reference D’Oronzio, Senn and Biaggi35 Thus, normalization to BSA is the preferred approach when comparing cardiac structure and function parameters between sexes and during natural growth periods.
CMR is particularly useful for evaluating RV function. RV functional parameters are similar to those measured in the LV, including RV systolic and diastolic volumes, RV ejection fraction and stroke volume, and RV cardiac output. The combination of soft-tissue contrast and spatial resolution available with CMR makes it a useful tool for studying the changes in RV structure and function, mitigating the fact that the RV has a more complex geometry than the LV and a myocardial wall thickness that is often one-fifth that of the LV wall.Reference Beygui, Furber and Delépine36 CMR has been used to measure RV functions in mice effectively.Reference Wiesmann, Frydrychowicz and Rautenberg37 CMR can produce reliable measurements of RV myocardial mass, which can inform our understanding of perinatal programming on cardiac development.Reference Kuo, Li and Huber38 MRI-derived assessments of RV pressure–volume loops can be constructed and used to evaluate RV contractility.Reference Kuehne, Yilmaz and Steendijk39 The CMR-derived ventricular mass index affords an accurate and practical method to noninvasively assess pulmonary artery (PA) pressure and may produce a more accurate estimate than Doppler echocardiography in pulmonary hypertension.Reference Saba, Foster, Cockburn, Cowan and Peacock40
CMR studies of the atria have mostly been applied to the left atrium (LA). The LA acts as a volume sensor, which through atrial stretching inhibits the secretion of vasopressin thus altering the RAS. Vasopressin’s effects are mediated through several physiological mechanisms including escalation of arterial blood pressure, central blood volume, central venous pressure, and altering the sympathetic baroreflex set point.Reference Szczepanska-Sadowska, Czarzasta and Cudnoch-Jedrzejewska41 Concurrently, left atrial stretching triggers the release of natriuretic peptides that decrease systemic vascular resistance, reduce central venous pressure, and increase the excretion of sodium by the kidneys.Reference Houben, van der Zander and de Leeuw42 Thus, it is not surprising that changes in LA size can be a biomarker for sustained elevations of LV filling pressures, especially in patients with heart failure with preserved ejection fraction complicated by hypertension.Reference Perrone-Filardi, Coca and Galderisi43 Measures obtained by CMR include maximum/minimum LA volumes, total LA emptying volume and fraction, passive LA emptying volume and fraction, active LA emptying volume and fraction, and conduit volume. Changes in LA volume, indexed to myocardial mass, have been shown to be generally related to diastolic function in the normal population, although it may be predictive for more specific issues depending on the population being studied.Reference Hoit44 Right atrial (RA) volumes also have been investigated with CMR with regards to chronic heart failure and pulmonary hypertension. The utility of atrial imaging measurements in the setting of cardiac physiology altered by developmental programming in animal models has not yet been studied and is an emerging area of investigation.
Myocardial remodeling is a characteristic of developmental programming, which has been identified using echocardiography in fetuses and infants.Reference Crispi, Miranda and Gratacos17 The “sphericity index” is used in echocardiography as an indicator of ventricular remodeling. Typically, in echocardiography studies, a sphericity index is approximated by calculation. Since CMR is used to measure the full ventricular volumes, the 3D sphericity index can be used, which is the ratio of the ventricular volume to the volume of a sphere that has the ventricular length as its radius.
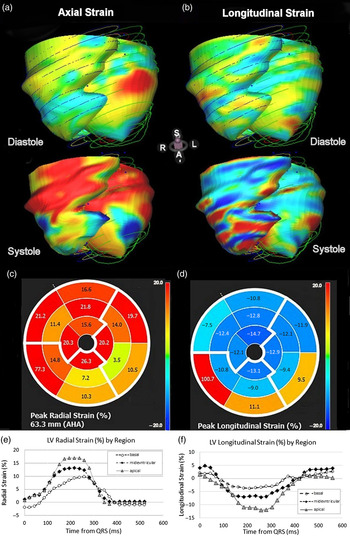
In addition, CMR can be used to assess myocardial deformation. Myofibers in the mid-wall layer encircle the heart while longitudinal fibers in the endocardial and epicardial layers pull the heart from apex to base. The complex motion during contraction includes forces acting along a right-handed helix in the sub-endocardium but in a left-handed helix in the sub-epicardium. The resulting deformation, or “strains” can be resolved into components along with three directions: axial, circumferential, and longitudinal. Strain is defined in relation to the original length as a dimensionless percentage. The rate of deformation, “strain rate”, is the spatial derivative of velocity and has units of inverse seconds. The initial method used a so-called “tissue tagging” approach, in which a special sequence “spoils” the magnetic nuclei so that lines of a null signal are deposited and tracked throughout the heart cycle.Reference Axel and Dougherty45,Reference Kraitchman, Young, Chang and Axel46 A recent innovation, CMR feature tracking, evaluates anatomic elements that are different along the margins of the myocardium along the chamber wall/endocardium and epicardial/subepicardial boundaries. RV and LV systolic and diastolic function can be characterized using strain and strain rate as well as myocardial torsion and diastolic recoil. Myocardial strain parameters from CMR studies produce more sensitive and earlier markers of contractile dysfunction than ejection fraction.Reference Schuster, Hor, Kowallick, Beerbaum and Kutty47 Fig. 2 displays examples of data obtained from myocardial feature tracking of LV cine images. Parameters measured include ventricular radial (Fig. 2a, c, e), circumferential, and longitudinal strains (Fig. 2b, d, f), strain rates, velocities, and displacements. Several commercially available image processing packages are available with feature tracking functionality.Reference Barreiro-Pérez, Curione, Symons, Claus, Voigt and Bogaert48 Speckle tracking echocardiography has also been used to assess myocardial strain. However, the echo speckle results do not directly correspond to the MRI results. This may be due to the inherent sensitivity of echo speckle to noise and/or the relatively poor lateral resolution of the method.Reference El Ghannudi, Germain and Jeung49
Examples of parametric strain images calculated using MR feature tracking from breath-hold cine acquisitions (a) axial and (b) longitudinal strain surface coding for diastolic (top) and systolic (bottom) phases. Middle insert shows polar plots of maximal strain in the axial (c) and longitudinal directions (d). Plots of radial strain (e) and longitudinal strain over the cardiac cycle shows greater strains in both directions in the apical region of the baboon heart.

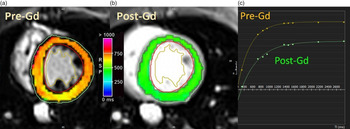
CMR also can be used to assess the focal or diffuse expansion of the myocardial extracellular space, which may result from prior infarction, infection, or other causes of tissue composition derangement. Hematocrit (hct) should be gathered on the same day as the MRI examination as it can fluctuate. Following administration of intravascular gadolinium contrast agent and a time delay (>10 min), focal scarring/extracellular space expansion can be directly visualized and quantified. For evaluation of diffuse extracellular space expansion, the longitudinal relaxation time (T1) of the myocardium and the T1 of blood in the ventricular lumen must be measured (Fig. 3a, b). In a common protocol, myocardial T1 is measured again ~10 min after administration of a gadolinium contrast agent. Reference Moon, Messroghli and Kellman50 From these datasets, and the patient’s hct, the extracellular volume (ECV) of the myocardial tissue can be calculated as: myocardial ECV = (1−hct) × Δ T1blood)/(Δ T1myocardium). ECV was found to be directly associated with myocardial fibrosis related to aging in a large human study. Reference Salemi, Rochitte and Shiozaki51 Diffuse myocardial fibrosis is believed to be one of the conditions associated with impaired ventricular function due to developmental programming. An example of how myocardial T1 is altered ~10 min after Gd infusion in the baboon heart is shown in Fig. 3. A more advanced approach, diffusion tensor CMR (DT-CMR), can be used to evaluate myocyte orientation and sheetlet function, however this a technically challenging method. Reference Khalique, Ferreira, Scott, Nielles-Vallespin, Firmin and Pennell52 New approaches that combine improved spatial and angular resolution with greater scanning speed and increased coverage may allow DT-CMR to become a routine research tool in the near future. The power of sampling myocardial tissue at necropsy in animal models of developmental programming can be used to correlate features such as fibrosis with in vivo images of the tissue structure. Reference Muralimanoharan, Li and Nakayasu14
Parametric maps of the T1 of the baboon left ventricle in short-axis views. (a) T1 parametric map of native myocardium. (b) T1 parametric map of myocardium ~10 min after gadolinium (Gd) administration. Note the GD reduces T1. (c) T1 measurement requires acquiring several images with different timing intervals. T1 recovery curves were generated for nine images taken at different timings. Circumferential strain, not shown, can also be calculated and displayed in a similar fashion.

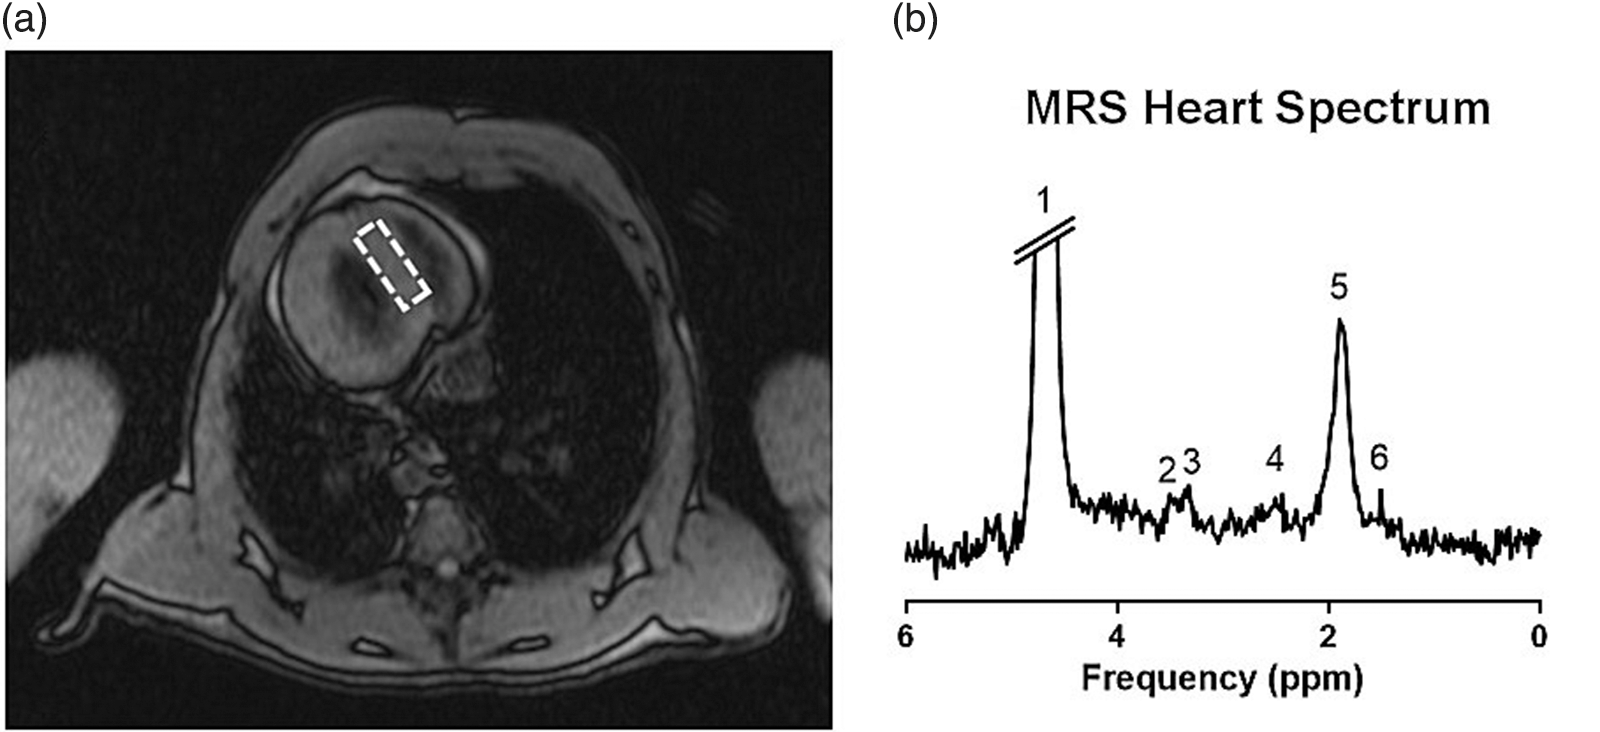
MRI is also useful for differentiating between muscle tissue and fat, making it useful for discerning fatty infiltration of the myocardium. Epicardial fat and pericardial adiposity, which are common in patients with insulin resistance, have been associated with a number of cardiovascular conditions. Reference Guglielmi and Sbraccia53 Increased pericardial fat deposition, measured by CMR has been reported in male IUGR baboons, but not females at 5–6 years (human equivalent 20–24 years). Reference Kuo, Li, Mattern and Huber54 Volume-localized magnetic resonance spectroscopy (MRS) can be used to determine the amount of fat within the myocardium (Fig. 4a), although the process is more time-consuming and technologically demanding. Reference Gastl, Peereboom and Gotschy55 Fig. 4 depicts an example of a hydrogen-1 CMR spectrum obtained from the interventricular septum of a baboon heart. Note that there are three triglyceride peaks (Fig. 4b). However, due to the complex myofiber orientations in heart muscle, MRS measures total fat and cannot yet distinguish intra- and extracellular lipids, which may have different metabolic origins. Reference Fillmer, Hock, Cameron and Henning56
Example of a hydrogen-1 magnetic resonance spectrum (1 H-MRS) from a baboon heart. (a) Scout image is used to define the position in the interventricular septum (dashed rectangle) from which the 1 H-MRS data is sampled. (b) Sample spectrum from a prior study identifying six major resonances, including three peaks of triglyceride (4, 5, and 6) and single peaks of creatine (3), trimethyl-ammonium compounds (2), and water (1).

CMR can also be used to measure blood flow, although not with the same temporal resolution afforded by Doppler echocardiography. Phase-contrast MRI can be used to measure the velocity of flowing blood in the great vessels or smaller arteries by relating the change in phase of the MRI signal from blood to the change in position of the blood. Because imaging slices can be positioned flexibly and accurately, CMR can provide precise measures of cardiac output and coronary blood flow. Reference Pelc, Herfkens, Shimakawa and Enzmann57,Reference Hundley, Lange and Clarke58 CMR is used to determine aortic compliance and flow across the mitral valve. Aortic distensibility can be calculated from measurements of the cross-sectional area of the distal descending aorta at the level of the heart, taken at ES and ED. Reference Pelc, Herfkens, Shimakawa and Enzmann57 Distensibility is defined as the fractional decrease in aortic area divided by the difference between systolic and diastolic blood pressure. Pharmaceutical agents, such as dobutamine and adenosine, can be infused during CMR to assess myocardial perfusion during vasodilation and myocardial function during cardiac stress. Reference Sensky, Jivan and Hudson59 4D flow MRI combines three-dimensional spatial encoding combined with three-directional velocity-encoded phase-contrast MRI allowing quantitative visualization of complex, three-directional blood flow patterns in vascular structures and entire vascular territories such as the heart, the adjacent aorta, and coronary arteries. Reference Markl, Frydrychowicz, Kozerke, Hope and Wieben60 These approaches allow assessments of cardiac performance under physiological conditions that normally occur with increasing workloads.
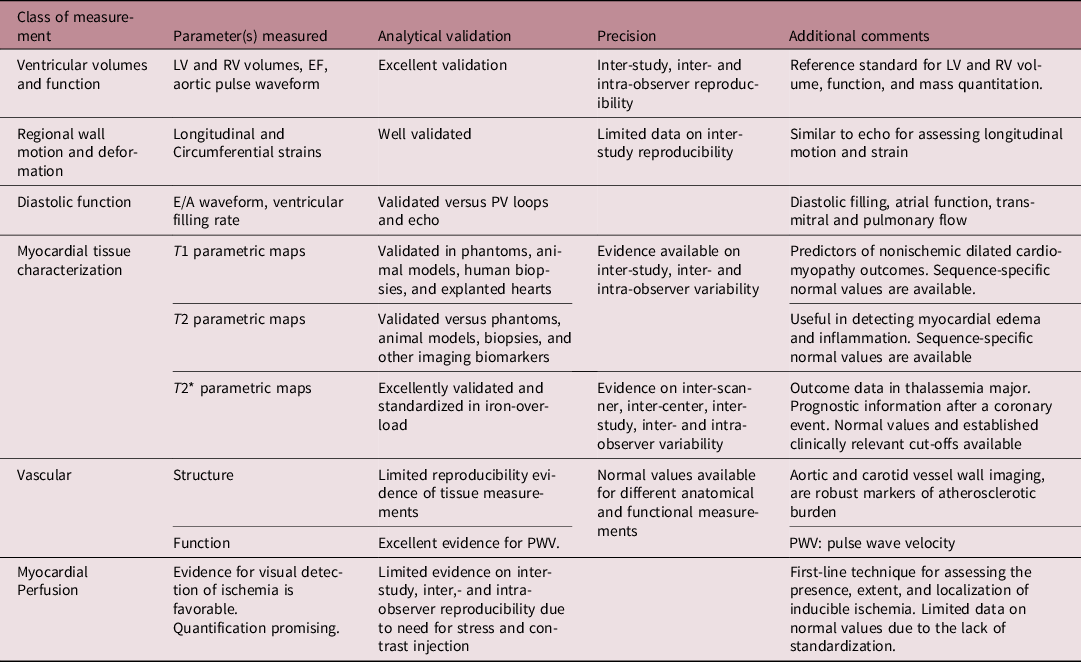
The Society for Cardiovascular Magnetic Resonance (SCMR) has developed an expert consensus report that assesses evidence of the accuracy and precision of CMR-derived cardiovascular parameters. Reference Puntmann, Valbuena and Hinojar61 Although these parameters were considered in the context of diagnosing and evaluating disease severity, the report clarifies the strengths and weaknesses of modern, quantitative CMR. Data presented in the SCMR report have been compiled and summarized in Table 1.
CMR quantitative endpoints and relative accuracy [after Puntmann, 2018]

Normative values of CMR parameters
As delineated above, quantitative CMR can provide a multitude of data, not only with regard to chamber sizes and function, but also concerning the regional function of the heart, blood flow, and tissue composition. A recent review of published data lists reference values and influencing factors, such as age and sex, on normative cardiac physiological parameters derived from various CMR techniques and pulse sequences. Reference Kawel-Boehm, Maceira and Valsangiacomo-Buechel62
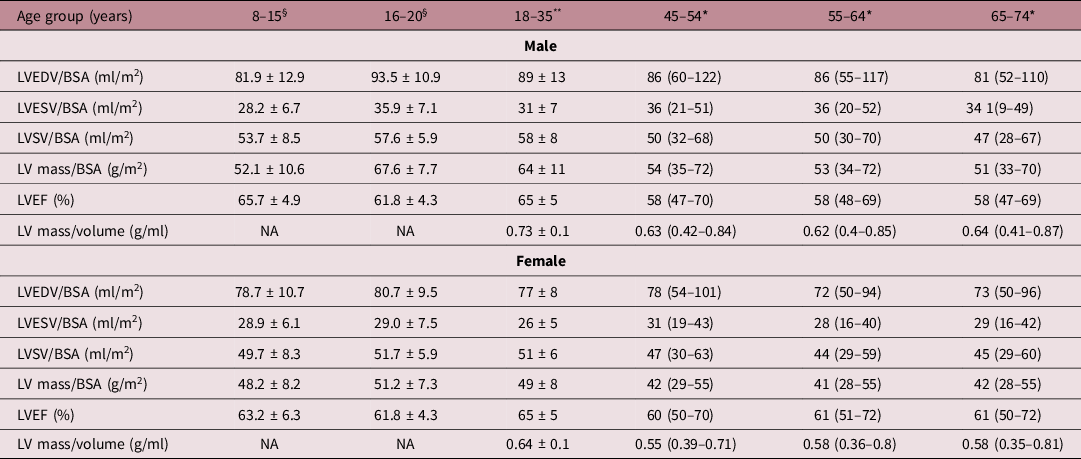
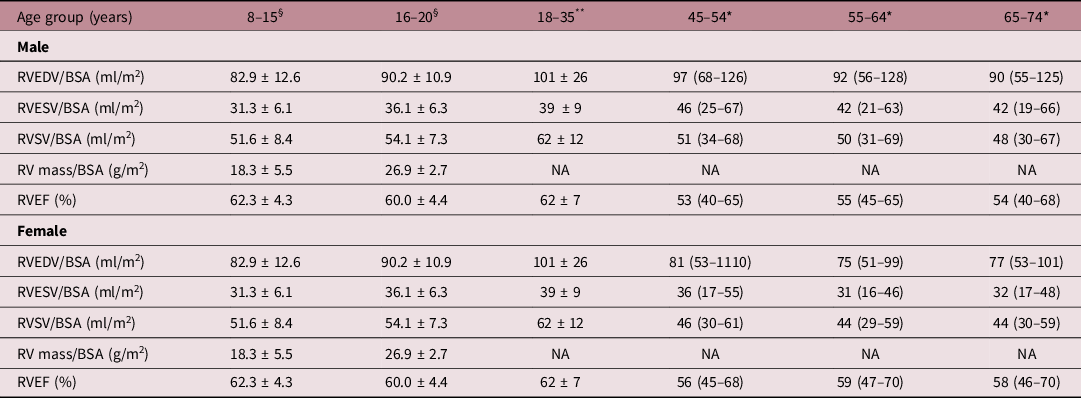
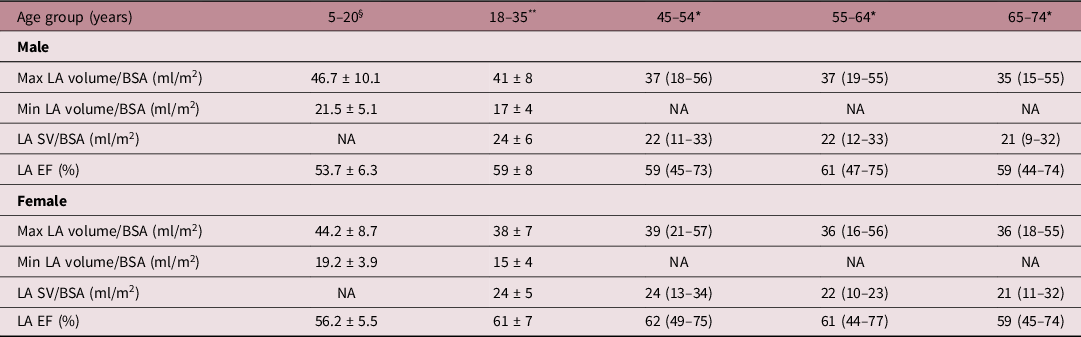
A recent study of 800 adult UK subjects evaluated CMR data from healthy Caucasian British participants in order to establish reference values and abnormal ranges, for LV, RV, LA, and RA structure and function. Reference Petersen, Aung and Sanghvi63 Bland–Altmann analyses of these data found that for LV and RV end-diastolic volume, end-systolic volume, and stroke volume and LA and RA maximal volume and stroke volume, excellent inter- and intra-observer agreement was achieved. Another study reported the same cardiovascular parameters from CMR, but focused on over 400 healthy Caucasian participants between the ages of 18 and 36 years. Reference Le Ven, Bibeau and De Larochellière64 Using both intra-class correlation coefficients (ICC) and by the Bland–Altman method, these investigators showed that LV and RV EDV has biases ≤2.3 ml, LA and RA EDV have biases <6.5 ml, and all had ICC values ≥0.92. Two other investigations have aimed to establish normative ranges for RA and LA structural and functional parameters normalized for independent influences such as age, sex, and BSA. One studied 120 asymptomatic medical workers in Great Britain Reference Maceira, Cosin-Sales, Prasad and Pennell65 and the other assessed 115 healthy children and adolescents in Germany. Reference Sarikouch, Peters and Gutberlet66,Reference Sarikouch, Koerperich and Boethig67 The latter study found high interobserver and inter-examination agreement by the Bland–Altman method, even for pediatric subjects. BSA-indexed normative cardiac functional data by age group reported from these studies have been compiled in Tables 2–4.
Normative reference ranges for human left ventricular (LV) function by age

NA, not available.
* Petersen, 2017 (variability given as prediction interval).
** Le Ven, 2016.
§ Sarikouch, 2010 (variability given as +SD).
Normative reference ranges for human right ventricular (RV) function by age

NA, not available.
* Petersen, 2017 (variability given as prediction interval).
** Le Ven, 2016.
§ Sarikouch, 2010 (variability given as +SD).
Normative reference ranges for human left atrial (LA) function by age

NA, not available.
* Petersen, 2017 (variability given as prediction interval).
** Le Ven, 2016.
§ Sarikouch, 2011 (variability given as +SD).
The studies, cited above, primarily report data from North American and European Caucasian cohorts. A direct comparison between four American ethnicities (Caucasian, Hispanic, African-American, and Asian-American) showed that Asian-American participants, in general, had lower values for LV mass and volumes than other ethnic groups even when adjusted for BSA. Reference Natori, Lai, Finn and Gomes68 A more recent study from the same group found that LA volume also was smaller in Chinese-American subjects even after allometric indexing. Reference Zemrak, Ambale-Venkatesh and Captur69 A comprehensive study of 20–69-year-old Singaporean Chinese subjects (n = 180) found smaller cardiac volumes (LV EDV: 128 ± 28 vs. 146 ml; RV EDV: 143 ± 35 vs. 162 ml) and lower LV mass (76 ± 22 vs. 116 g). These differences remained after normalizing for BSA but, as in Caucasians, negative correlations between ventricular volumes and age were found without associations between LV mass and age. Reference Le, San Tan and De Deyn70 Further studies are required to understand the normative age-related variability of normal cardiac structure and function across diverse ethnic groups.
MRI tissue parameters also have been measured by CMR. The MRI relaxation times, T1, T2, and T2*, can be determined in myocardium using specialized pulse sequences that measure the changes in the CMR signal with changes in acquisition timing parameters. Reference Kim, Hong and Im71 Relaxation measurements require multiple rescans using different timing parameters in order to derive the relaxation times from the signal intensity versus time curves via nonlinear regression as shown in Fig. 3c. T1 increases with the magnetic field strength used for MRI, but also is associated biologically with disease states that lead to fibrosis, edema, and amyloid deposition. T1 is reduced by administration of a gadolinium-based contrast agent (Gd), which briefly is retained in the interstitial space. Reference Lee, Liu and Nacif72 By making measurements before and after Gd, the ECV can be determined and used as a biomarker for myocardial fibrosis (Fig. 3). A study conducted at 3 Tesla in a cohort (n = 76) of asymptomatic volunteers 20–90 years of age-reported native myocardial T1 and ECV, but not T2, were significantly greater in age-matched women than in men. Reference Roy, Slimani and de Meester73 In addition, T1 and ECV increased with increasing age. However, in children (aged 9–18) T1 did not change with age but was significantly correlated (r = 0.448, p − 0.005) with body mass index (BMI). Reference Barczuk-Falęcka, Małek, Werys, Roik, Adamus and Brzewski74 Although apposite interobserver variability has been reported for myocardial T1 measurements with ICC > 0.90, Reference Burkhardt, Menghini, Rücker, Kellenberger and Valsangiacomo Buechel75 for multicenter investigations, it is good practice to certify that the T1 mapping method utilizes a standardized acquisition and post-processing approach. Reference Dabir, Child and Kalra76
Studies also have evaluated T2, which increases with water content in myocardial tissues, as in myocardial edema. T2 is reported to decrease significantly with increasing age. Reference Roy, Slimani and de Meester73 Decreases in the related parameter, myocardial T2*, have been associated with iron deposition which is indicative of thalassemia in children. Reference Magri, Sciomer and Fedele77 A high-field (7 T) study of chicken embryos reported that T2 in the heart and other organs decreased during embryonic development. Reference Boss, Oppitz and Wehrl78 In a Polish study of 41 healthy children, 9–18 years old, myocardial T2 was found to be significantly higher (44.6 ± 4.2 vs. 40.4 ± 3.8 p = 0.002) in females than in males. Reference Barczuk-Falęcka, Małek, Werys, Roik, Adamus and Brzewski74 Normative values of T1, T2, and T2* for various age groups are listed in Table 5.
Normative values for relaxation time in healthy human myocardium by age groups

NA, not available.
§ Burkhardt, 2020.
‡ Barczuk-Falęcka, 2020.
* Dabir, 2014.
** Roy, 2017.
The development of the heart in early childhood has also been studied using CMR. Most of these studies have focused on infants with congenital heart diseases such as patent ductus arteriosus (PDA) and preterm infants. In studies of extremely young subjects, cardiac dimension measurements are typically indexed to body weight. Indexed cardiac parameters were significantly greater in a group of 16 PDA infants compared to 29 control infants in a study that showed good intra- and interobserver agreement. Reference Broadhouse, Finnemore and Price79 These parameters included LV stroke volume (2.81 ± 0.83 vs. 1.82 ± 0.29 ml/kg, p < 0.001), end-diastolic volume (3.38 ± 1.34 vs. 2.47 ± 0.38 ml/kg, p = 0.001), and LV mass (2.46 ± 0.59 vs. 1.39 ± 0.23 g/kg, p < 0.001). However, there were no significant differences in ejection fraction or fractional thickening between the two groups. Currently, studies of RV function and structure in infants have not demonstrated adequate reproducibility.
CMR was used to measure cardiac output and tricuspid and mitral E/A trans-mitral waveforms with Doppler at median 30.4 weeks gestational age (95% range 28.4–32.7), and then again at a median age of 10.0 years (95% range 9.4–11.7) in 547 subjects. Reference Toemen, Jelic and Kooijman80 These investigators found that higher third-trimester umbilical artery resistance was associated with higher childhood RV EF (p < 0.05), but not with other cardiac outcomes. The third-trimester umbilical artery to cerebral artery pulsatility index ratio was not associated with childhood cardiac outcomes. Higher third-trimester fetal LV output was associated with lower childhood LV EF and higher LV mass-to-volume ratios (p < 0.05). Third-trimester fetal RV output was not associated with childhood cardiac outcomes. A higher third-trimester fetal tricuspid valve E/A mitral waveform ratio was associated with higher childhood RV EF (p < 0.05).
Through-plane phase-contrast MRI velocity measurements have been used to assess left and right ventricular output in preterm and term newborns in a neonatal unit. Reference Groves, Chiesa and Durighel81 PA pulse wave velocities, measured in children (ages 9–12-year-old) using velocity-encoded MRI, have been shown to be reproducible and sufficiently sensitive to detect differences in PA compliance between normoxia and hypoxia. Reference Poon, Edwards and Evans82 CMR-derived longitudinal, radial, and circumferential strain measurements also have been characterized recently in children. Reference André, Robbers-Visser and Helling-Bakki83
CMR developmental programming phenotypes
Quantitative CMR in fetal hearts, including cardiac function, blood flow, and blood oxygenation, is an area of active development. The high resolution demanded in fetal hearts can be confounded by the need to avoid aliasing artifacts from other parts of the mother’s body. However, the primary technical challenge is to deal with the various sources of motion artifacts which include cardiac and respiratory motion of the mother, cardiac motion of the fetus, and fetal body motion. Innovations such as metric-optimized gating, self-gating, and the development of MRI-compatible fetal heart monitoring hardware allow fetal CMR to be more tolerant to motion, thereby allowing high-resolution dynamic imaging of the fetal heart and its associated vessels. Reference Roy, Marini, Seed and Macgowan84 With adequate control for physiological motion, fetal ventricular volumetry has been shown to be very reliable in the sheep model. Reference Cho, Darby and Saini85 The development of 4D cine methods, using highly accelerated dynamic MRI with slice-to-volume reconstruction, can capture fetal cardiac motions in real-time. Reference Roberts, van Amerom and Uus86 The use of 4D flow CMR has been validated for directly measuring flow through fetal vessels of the central circulation and their shunts in an in utero sheep model. Reference Schrauben, Saini and Darby87 Also, T2 relaxometry measurements have been used in fetal sheep models to quantitate blood oxygenation with CMR and validate these against blood gas analyzer measurements. Reference Saini, Darby and Portnoy88 These methods have been applied to assess cardiac function in a study of late-onset IUGR human fetuses with reported values indexed to estimated fetal weight. Reduced umbilical vein and pulmonary blood flow, along with increased superior vena caval flow, were found in IUGR compared to normal fetuses. Reference Zhu, Milligan and Keating89 Also, blood T2 values, oxygen delivery, and oxygen consumption were significantly lower in the IUGR fetuses. The development of reliable CMR methods for assessing fetal hemodynamics and morphometrics will provide more reliable data for understanding the development of IUGR in utero and allow improved classification of IUGR at the early stages of pregnancy.
CMR has shown that small size for gestational age (SGA) at birth was associated with smaller LV and RV end-diastolic volume relative to current BSA, but with larger LV mass-to-volume ratio (p < 0.05). Children in the larger quartile at birth who grow taller and leaner in childhood have larger hearts relative to BSA. In contrast, children in the lower quartile of RV and LV end-diastolic volume and LV mass were smaller at birth and became shorter and heavier in childhood (p < 0.05). Both fetal and childhood growth were independently associated with childhood RV and LV end-diastolic volume and LV mass. Reference Toemen, Gaillard and Roest90
In a CMR study of 29 fetuses with IUGR compared to 127 fetuses with various congenital heart diseases, IUGR fetuses were significantly heavier than fetuses with transposition of the great arteries (p = 0.03) and coarctation of the aorta (p = 0.02), but there were no significant fetal body weight differences between IUGR and other congenital heart diseases. Reference Kingdom, Zhu and Porayette91 The same group studied 14 IUGR and 26 non-IUGR fetuses at 35 weeks’ gestation using MRI, reporting that IUGR fetuses had lower umbilical vein (p < 0.004) and pulmonary blood flow (p < 0.01) and higher superior vena caval flow (p < 0.0001). Reference Zhu, Milligan and Keating89 The latter change is exemplary of the classical preferential delivery of blood to pre-ductal vascular beds in the presence of intrauterine challenges. Reference Cohn, Sacks, Heymann and Rudolph92
A recent study of 34 preterm infants and 10 term controls reported greater CMR weight-indexed LV mass and higher weight-indexed end-diastolic volume at term-corrected age (p < 0.05 for all preterm gestations). Reference Cox, Bai, Price, Edwards, Rueckert and Groves93 Independent associations of increased term-corrected age LV myocardial wall thickness were (false discovery rate <0.05): degree of prematurity, antenatal glucocorticoid administration, and a requirement for >48 h postnatal respiratory support. Principal component analysis of LV volumes, geometry, myocardial mass, and wall thickness revealed statistical differences between all preterm infants at term-corrected age and term controls. Reference Cox, Bai, Price, Edwards, Rueckert and Groves93
Intrauterine growth restriction due to reduced maternal nutrition and cardiac health in baboon offspring
Investigations of the effects of developmental programming need to consider the species and sex of offspring differences in outcomes. The common experimental model of the laboratory rat is a polytocous, altricial species. Mothers, thus, nurture a much larger nutritional load and fetuses and neonates have a different trajectory of development from monotocous, precocial mammals such as humans. Reference Rabadan-Diehl and Nathanielsz94 For this reason, a nonhuman primate, baboon model has been developed and characterized. Reference Schlabritz-Loutsevitch, Howell and Rice95 Molecular techniques were used to evaluate the functional, biochemical, and epigenetic mechanisms and interactions in the heart that result from the challenge of maternal undernutrition and obesity from overnutrition. Reference Muralimanoharan, Li and Nakayasu14,Reference Maloyan, Muralimanoharan, Huffman, Cox, Nathanielsz, Myatt and Nijland15
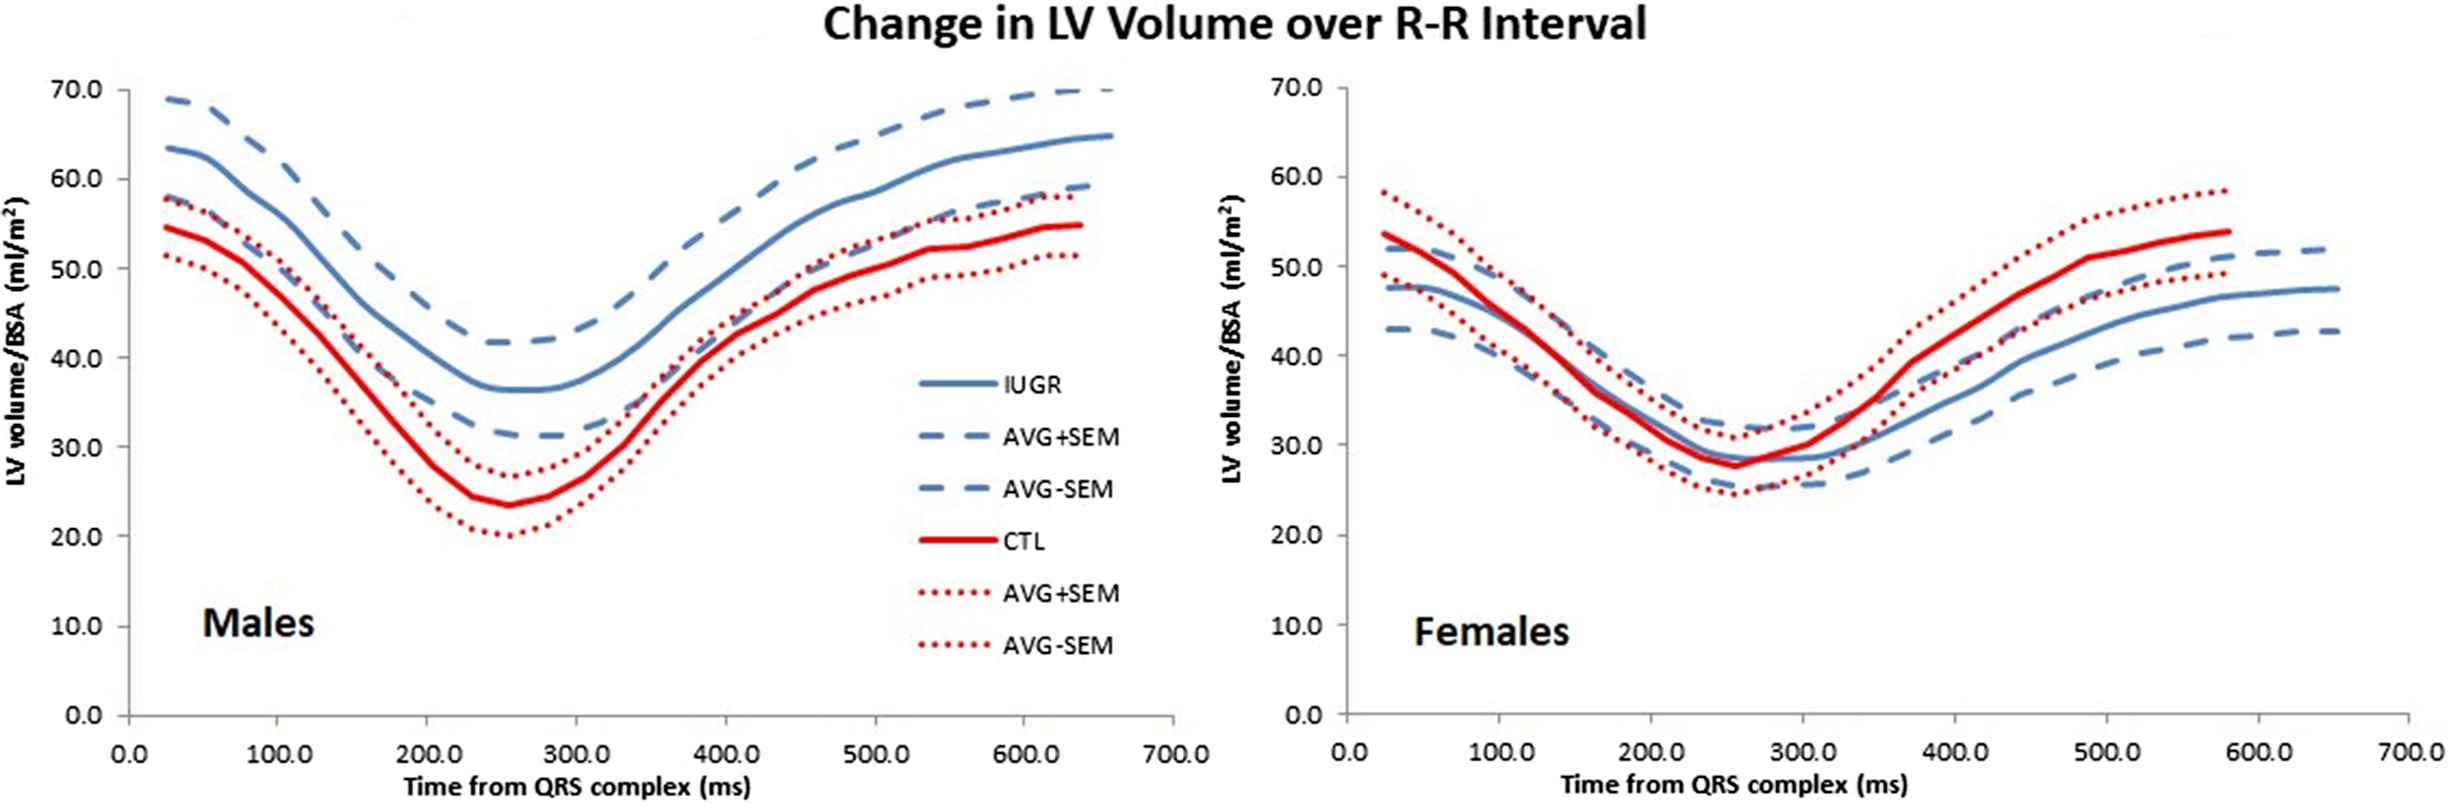
CMR has been extensively applied in this IUGR baboon model to study CV changes that arise from developmental programming secondary to moderate (30%) MNR during pregnancy and lactation. Both LV and RV function were impaired in the offspring, including decreased ejection fractions, ventricular shortening, and increased chamber volumes. Reference Kuo, Li and Huber38,Reference Kuo, Li, Li, Huber, Nathanielsz and Clarke96 Fig. 5 illustrates differences in the BSA-normalized LV volume–time curves obtained by CMR over the cardiac cycle control and IUGR baboons, differentiated by sex. The results underscored that MNR affected RV function more drastically than the LV function. The severity of the impairment in RV function may be due to increased pulmonary resistance, which would be attributed to decreased fetal pulmonary alveolarization, and pulmonary vessel density, found in a sheep model of IUGR. Reference Rozance, Seedorf and Brown97 While these data have been interpreted as indicating that growth restriction mimics accelerated aging of the heart, the most essential finding was the interplay and synergistic effect of these changes toward jeopardizing overall cardiovascular health.
Sex differences were found in normalized LV time–volume curves across the cardiac cycle. Right for IUGR male baboons (blue lines), LV volumes tend to increase relative to control animals (red lines). Left for females, LV volumes tend to decrease in IUGR relative to younger subjects. Resting heart rate for IUGR animals is slower for both sexes. Data represent average normalized LV volume (continuous lines) and mean ± SEM (dashed lines) for animals, and are described in Ref. 96.

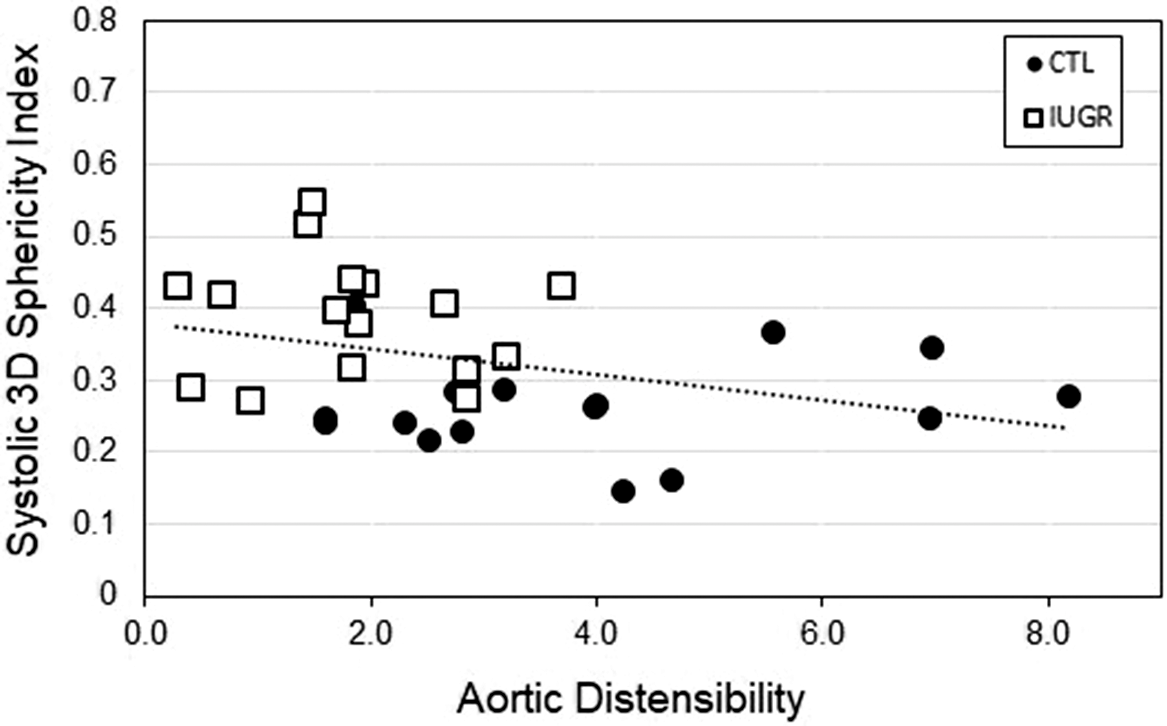
Changes in heart morphology and function that are expected to be associated with broader cardiovascular features also can be assessed using CMR. Distal descending indexed aortic cross section and aortic distensibility were decreased in the same IUGR baboons. Reference Kuo, Li, Li, Huber, Nathanielsz and Clarke98 Fig. 6 depicts how the increased systolic 3D sphericity index (3DSI) was significantly correlated with reduced aortic distensibility (r = 0.35, p = 0.048). Diastolic 3DSI also was significantly and negatively correlated with aortic distensibility (r = 0.36, p = 0.044). Complementary changes in carotid, brachial, and iliac artery sizes, distensibility, and blood flow pattern also have been identified in young adult IUGR baboons using ultrasound. Reference Kuo, Li, Huber, Clarke and Nathanielsz99
Data are from 16 controls (8M/8 F), open boxes, and 16 IUGR (8M/8 F) baboons, black circles. Three-dimensional (3D) sphericity index is negatively correlated with aortic distensibility in the baboon (r = −0.36, p = 0.04). Increasing LV sphericity is an index of ventricular remodeling.

The biventricular changes signify the core components of the observed findings. In the LV, there is impairment of myocardial contraction. Based on studies from other animal models of poor maternal nutrition, the weakened contraction may be due to diminished cardiomyocyte number, Reference Corstius, Zimanyi and Maka100,Reference Botting, McMillen, Forbes, Nyengaard and Morrison101 cardiomyocyte immaturity, Reference Morrison, Botting, Dyer, Williams, Thornburg and McMillen102,Reference Bubb, Cock and Black103 abnormal calcium handling, Reference Harvey, Murphy, Morrison and Posterino104 and/or sarcomere dysfunction. Reference Iruretagoyena, Gonzalez-Tendero and Garcia-Canadilla105 With this decrease in contractile force, an increase in end-systolic volume is seen with MRI without significant modification in the end-diastolic volume, resulting in decreases in stroke volume and cardiac output. The decreased wall thickening fraction and trend of reduced rotation together suggest a decline in systolic function. Due to the increased end-systolic volume, there is increased difficulty in LV filling, reflected by a prominent decrease in peak and average filling function.
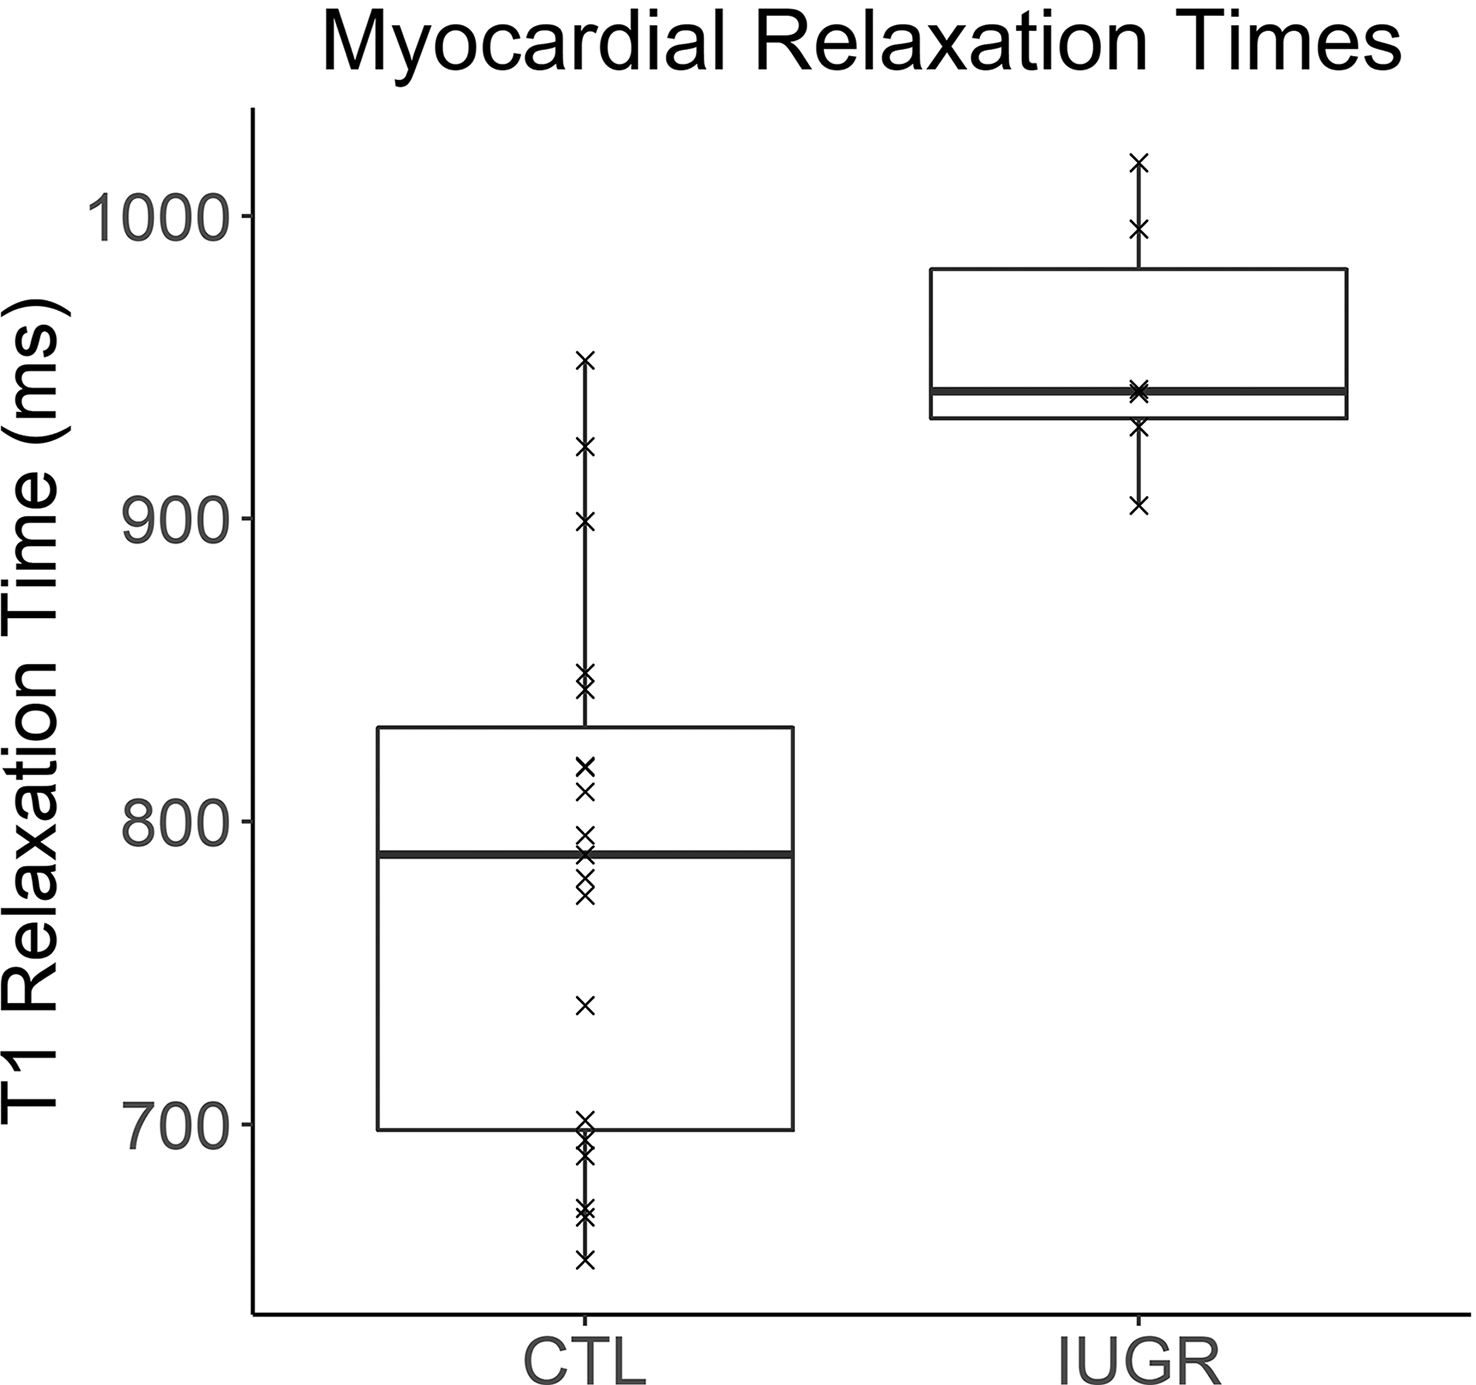
The struggle to fill the LV may be further compromised by extracellular fibrosis previously seen in the fetal baboon myocardium and as reported in other models. Reference Muralimanoharan, Li and Nakayasu14,Reference Bezerra, Andrade, da Cruz and Mandarim-de-Lacerda106 A study on 36 patients with dilated cardiomyopathy (DCM) examined the degree to which native myocardial T1 could be used to characterize collagen volume fraction measurement from histology. Reference Nakamori, Dohi and Ishida107 These investigators found that the native myocardial T1 value was significantly and positively correlated with biopsy-proven collagen volume fraction (r = 0.77, p < 0.01). We have measured native myocardial T1 to be significantly greater in IUGR baboons (1033 + 93 ms) than in controls (905 + 93 ms, p = 0.001), Fig. 7.
Significant increase (p = 0.001) of native myocardial T1 values was measured in IUGR compared to control (CTL) group (n = 19, M/F = 8/11, age = 6.1 + 1.3 years.) versus IUGR group (n = 6, M/F = 2/4, age = 4.8 + 0.5 years.). T1 is indicative of higher myocardial collagen content even though control group is, on average, slightly older than IUGR group. Solid line = median; box covers interquartile range; whiskers cover full data range.

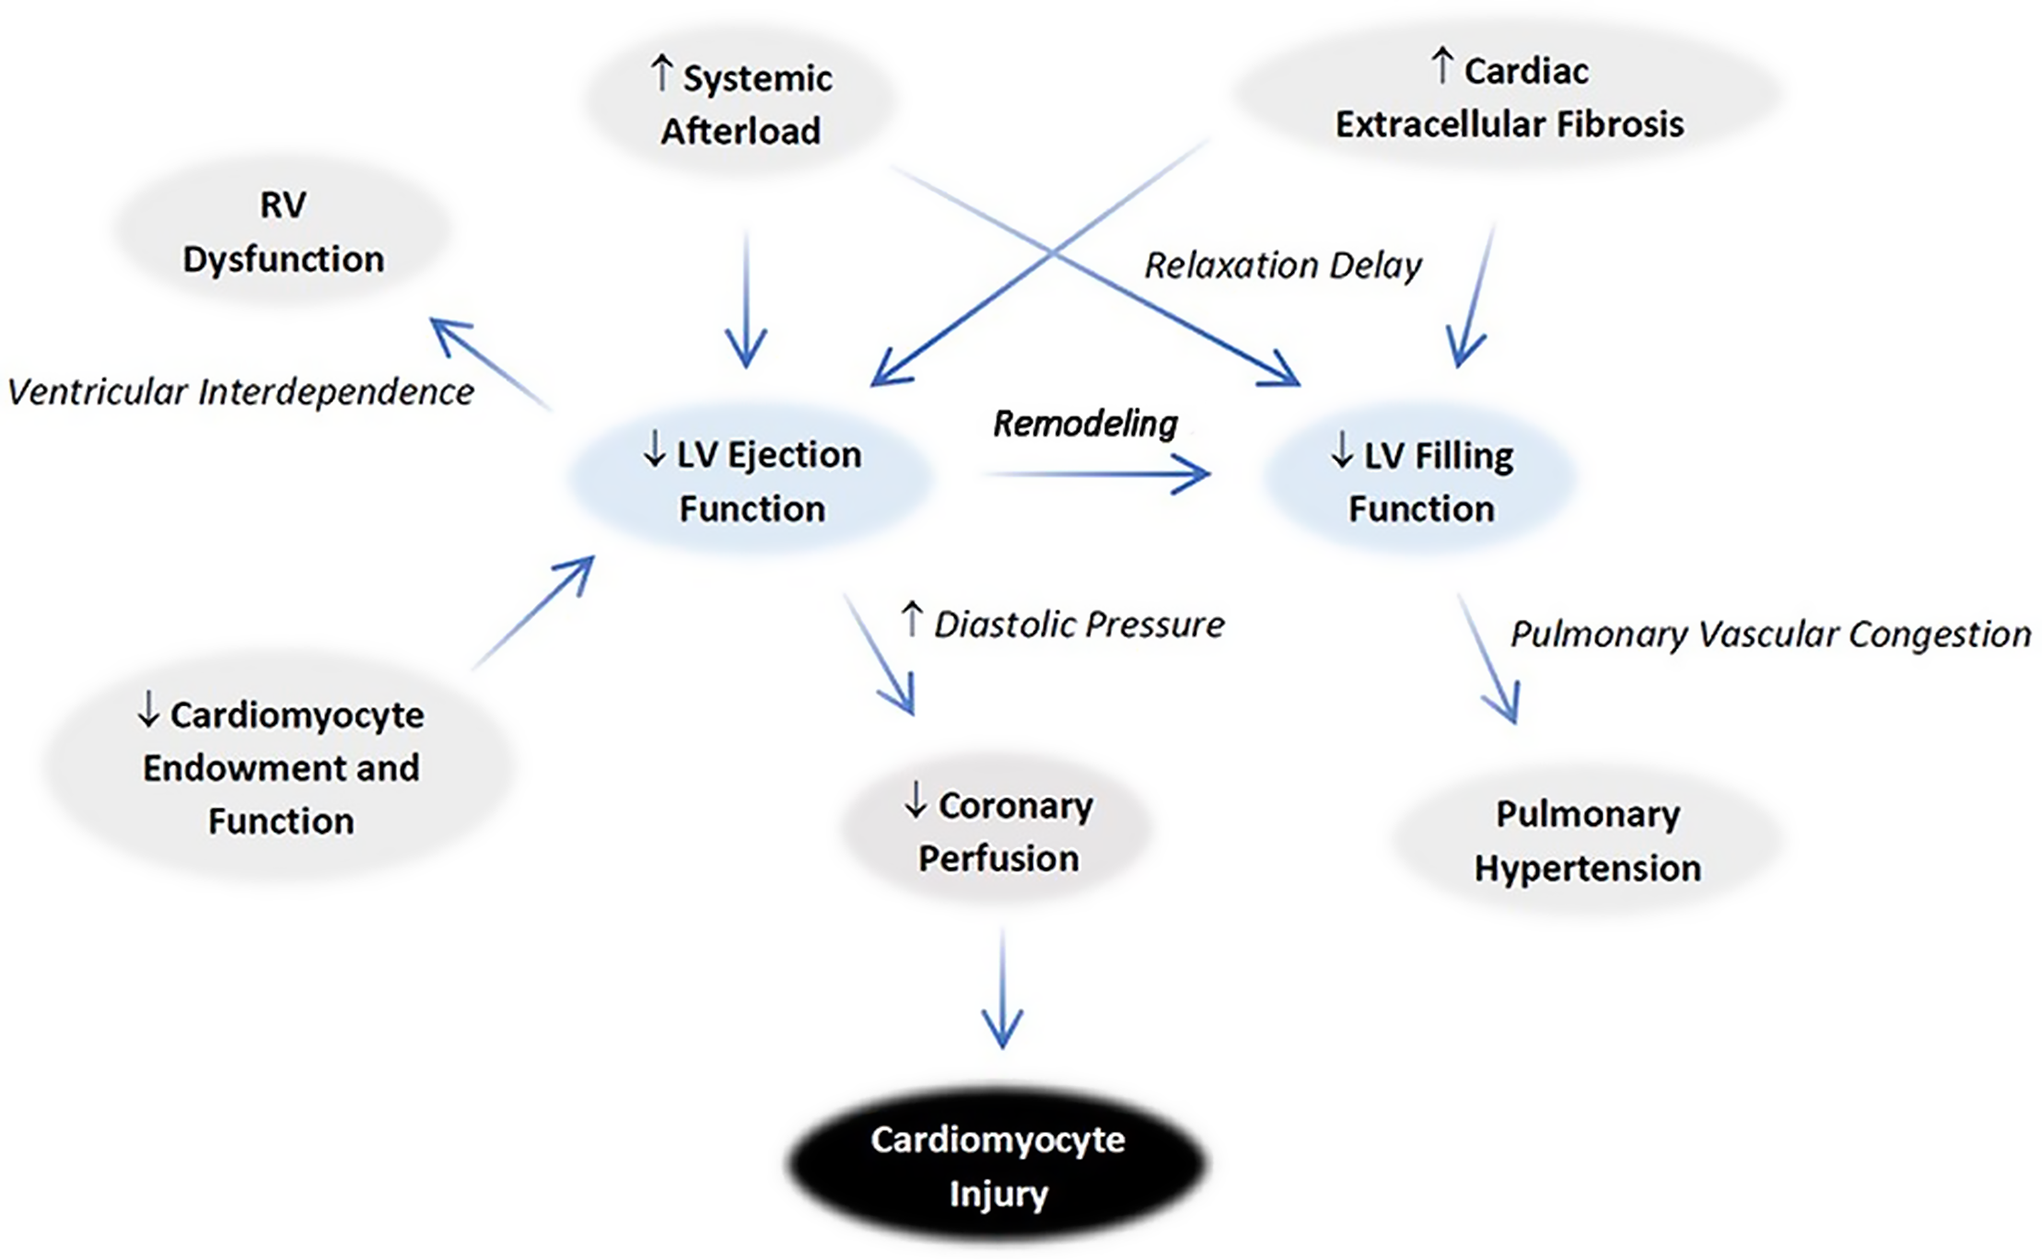
The LV systolic and diastolic function abnormalities as a result of IUGR may originate from cardiomyocyte changes discussed in prior reports. The relationship between RV and LV dysfunction is depicted schematically in Fig. 8. The contractile force of the RV was weakened as in the left, supported by decreases in both wall thickening and longitudinal shortening seen on MRI. RV end-systolic volume increased, and RV stroke volume and cardiac output fell. An attempt to increase the ejection function in the form of a mild increase in end-diastolic volume is suspected. Nonetheless, the increased end-systolic volume from inadequate ejection hinders RV filling, reducing both average and early filling rates. Although decreased sphericity indices are anticipated based on LV sphericity increase, no such difference is seen. This finding likely represents simultaneous RV congestion. Importantly, the impaired LV filling may further deteriorate RV ejection via increasing pulmonary pressure. Reference Enriquez-Sarano, Rossi, Seward, Bailey and Tajik108 These findings are consistent with impairment of coronary filling and mild hypoxia can be suspected, given the probable rise in diastolic pressure.
Proposed mechanisms for IUGR cardiac pathophysiology. An overall congestive physiology is evidenced by the ventricular remodeling that increases sphericity in both systole and diastole. The decrease in ejection fraction worsens filling dysfunction via an increase in diastolic pressure. The RV changes mirror the left in many regards. The increase in diastolic pressure contributes to decreased coronary perfusion, which predisposes to cardiomyocyte injury. The pattern of ventricular changes raises concerns that afterload increases as well.

On the mechanical level, weakening of one ventricular chamber’s contraction aggravates the other, as normally the cardiac longitudinal shortening force depends on concurrent pull of both the mitral and tricuspid annuli. Exaggerated septal movement toward the LV during systole, which normally only accounts for ~10% RV stroke volume, is interpreted as an attempt to normalize LV ejection, which may hamper RV ejection. Decreased LV systolic function also results in a weakening of the RV output due to ventricular interdependence. The more pronounced decrease in RV function, compared to the LV, indicates a primary component of RV dysfunction is present, which may originate in part from changes in the pulmonary system. However, the status of the RV myocardium and its relationship to pulmonary arterial dysfunction remain to be investigated given the lack of sufficient prior studies.
In the IUGR baboon model, the large systemic arteries demonstrated regional divergent findings. MRI revealed the descending thoracic aorta was decreased in size and distensibility. These decreases diminished the aortic Windkessel function and raised concern for diastolic perfusion of critical organs. Reference Kuo, Li, Li, Huber, Nathanielsz and Clarke98 In particular, coronary perfusion is likely to be compromised given its predominantly diastolic filling pattern. Additionally, the decreased size and distensibility of the descending aorta, combined with similar changes in the lower extremity arteries uncovered by ultrasound, indicated systemic afterload was likely elevated, contributing to LV dysfunction. Various animal studies have implicated decreased elastin content Reference Thompson, Gros, Richardson, Piorkowska and Regnault109 as well as changes in extracellular structure Reference Khorram, Momeni, Desai and Ross110,Reference Dodson, Rozance, Petrash, Hunter and Ferguson111 in contributing to the observed changes. In the cranially directed vessels, however, neither difference in size nor distensibility is seen. Instead, the overall carotid blood flow appears preserved, or even increased, due to a mild increase in end-systolic and diastolic flowrates. This constellation of findings is reminiscent of the blood flow redistribution effort known to occur during fetal hypoxia as part of the “brain sparing” effect. Reference Cohn, Sacks, Heymann and Rudolph92 Following this analogy, the modification in blood flow in perinatal life would have triggered differential growth of the vasculature via hemodynamic effects, which persist into adulthood. There also may be involvement of additional abdominal and pelvic vessels, which would have implications in other organ systems.
In the baboon model of IUGR, female offspring had increased total cholesterol, low-density lipoprotein, and subcutaneous fat. These changes were absent in male offspring, although MRI in the males did reveal increased pericardial fat depositions. Reference Kuo, Li, Mattern and Huber54 Metabolic derangements present in IUGR are detected in the form of a sexually dimorphic increase in pericardial lipid accumulation and serum cholesterol level. These increases were mild, especially when compared to the extent of cardiac changes observed. However, the increased pericardial lipids, if left untreated, may result in local lipotoxic effects later in the life course. The increase in serum cholesterol can contribute to the development of coronary atherosclerosis.
Future applications of CMR in the study of cardiac programming
The flexibility of cardiac MRI allows it to interpret the complex interactions of biomarkers related to IUGR pathophysiology, for example, the interplay between IUGR and accelerated aging. Prenatal programming is associated with the development of myocardial fibrosis, which is attributed, in large part, to epigenetic processes. Reference Muralimanoharan, Li and Nakayasu14,Reference Maloyan, Muralimanoharan, Huffman, Cox, Nathanielsz, Myatt and Nijland15 Physiological trajectories are altered as an adaptive response to maintain the fetus for a successful birth. However, there is strong evidence that these early life adaptations reduce the individual’s flexibility to respond to age-associated changes in cardiovascular structure and function in later life. Adverse remodeling is rooted in dysfunctional repair mechanisms that protect the heart from further injury and enhance homeostasis. Reference Strait and Lakatta112
In the baboon IUGR model, we have defined an extensive cardiac functional phenotype at baseline under sedation. Unfortunately, we have yet to study cardiac function under various other challenges. In humans, the resting cardiac functional measurements do not always correlate with those obtained under stress. For instance, aging weakens LV ejection under stress but not at rest, whereas exercise training lowers resting ejection function without affecting stress values. Cardiac MRI evaluations could be performed during pharmacological stress using, for example, dopamine which should help better define the physiologic impact of the observed findings. Biomarkers, such as peak circumferential strain, average diastolic strain rate, contractile reserve, and myocardial blood flow were reported to be robust with good interobserver and intra-observer reproducibility and test-retest reliability during pharmacologically induced stress in healthy male (7–10 years old) macaques. Reference Sampath, Parimal and Feng113
Currently, it is unclear what tissue changes contribute to the ventricular dysfunction. Whether the LV extracellular space expansion, previously seen in the fetal heart, persists into adulthood or occurs in the RV has not yet been determined. In addition to measuring the myocardial T1 relaxation time by MRI, cardiac diffusion tensor imaging (DTI) can be used to examine the myocyte architecture and fiber orientation to identify the presence of pathology and/or extracellular space expansion more precisely. Cardiac DTI can also improve our understanding of the mechanisms and structural contributions related to atrial rhythm and pump disorders. Reference Pashakhanloo, Herzka and Ashikaga114 Although technically challenging due to heart and respiratory motion, new accelerated DTI pulse sequences and advanced image reconstruction technologies improve the accuracy and efficiency of diffusion CMR. Reference Mekkaoui, Reese, Jackowski, Bhat and Sosnovik115
The finding of reduced RV ejection fractions and systemic vascular alteration in offspring of MNR mothers indicates pathophysiology in the pulmonary system that merits investigation particularly in relation to the rapid changes in pulmonary blood flow that take place at birth. In fetal sheep, an increase in myocardial fibrosis has been reported in the RV after maternal undernutrition. Reference Darby, McMillen and Morrison116 Dynamic perfusion MRI can quantitatively analyze regional pulmonary perfusion Reference Ohno, Hatabu and Murase117 and may be helpful in this endeavor. Likewise, the finding of impaired aortic Windkessel function suggests studies such as MRI evaluation of the coronary arterial perfusion Reference Clarke, Eckels and Chaney118 and oxygenation Reference Guensch and Friedrich119 also could be beneficial, given the extensive literature on ischemic heart disease risk with IUGR.
MRI also can be used to evaluate related noncardiac conditions that are closely associated with developmental programming. An early and persistent finding has been the increased prevalence of idiopathic hypertension in people with low birth weight. This observation has led to studies in human and animal models that were aimed at discerning the relationships between CVD and kidney disease. IUGR has been linked with a reduction in renal cell size and number that, in turn, has been implicated in renal dysfunction and the occurrence of systemic hypertension. In the baboon IUGR model, it was found that midgestational IUGR fetal kidneys showed down-regulation of genes in pathways related to RNA, DNA, and protein biosynthesis. In addition, upregulation in cell signal transduction, communication, and transport were reported. Reference Cox, Nijland and Gilbert120 Thus, even a challenge of moderate maternal global nutrient restriction causes significant changes in fetal renal gene pathways. Renal perfusion can be evaluated quantitatively using various MRI methods, including dynamic contrast-enhanced MRI, arterial spin labeling, and diffusion-weighted MRI. Reference Zhang and Lee121 Moreover, blood oxygen level-dependent (BOLD) MRI, which exploits deoxygenated hemoglobin’s paramagnetic influence on the MRI signal, can be used to gain insights on tissue oxygenation. Reference Khatir, Pedersen, Jespersen and Buus122,Reference Collinot, Marchiol and Lagoutte123
Epidemiological evidence also implicates low birth weight as a risk factor for the development of diabetes. The relationship between CVD and metabolic disease is well-established and has been labeled the metabolic syndrome. Three of the five hallmarks of the metabolic syndrome are related to lipid function: central obesity, high serum triglycerides, and low serum high-density lipoprotein. Maternal obesity during pregnancy has been linked to increase offspring insulin resistance in humans. Reference Catalano, Presley, Minium and Hauguel-de Mouzon124 In the IUGR baboon model, MNR in pregnancy and lactation were found to program offspring metabolic responses, including insulin resistance and β-cell responsiveness that lay the foundation of an overall phenotype that can predispose to later life type-2 diabetes. Reference Choi, Li, McDonald, Comuzzie, Mattern and Nathanielsz125 MRS methods for assessing cardiomyocyte lipids Reference Reingold, McGavock, Kaka, Tillery, Victor and Szczepaniak126 and phosphorus energetics Reference Holloway, Cochlin and Emmanuel127 have been developed and could be used to help understand the synergistic effects of fetal programming on cardiovascular function and metabolism.
However, the full range of CMR capabilities, which could reveal new information on the IUGR cardiovasculature has not yet been applied at a large scale. Quantitative procedures to assess heart physiology, which are available and clinically validated, have not yet been exploited to better understand the processes underlying normal and divergent development. Current studies have been limited to technologies that have explored only the most basic physiology related to cardiovascular developmental programming.
In conclusion, cardiac MRI encompasses methods that are largely noninvasive and easily translatable from rodents to nonhuman primate models to human studies. Investigations into humans, which parallel those in animal models, are now possible and given the compelling evidence that prenatal challenges lead to later life CVD and have features of premature cardiac aging, the information obtained will accelerate our understanding of the mechanism of developmental programming and programming–aging interactions in the onset of later life CVD. The MRI biomarkers identified from animal models can be combined with tissue and cellular biomarker information to allow earlier identification of individuals at risk and enable assessment of treatment needs and therapeutic response. Ideally, the knowledge gained will lead to better clinical management of this vulnerable population. The strengths of investigating animal models include having homogeneity of subjects and greater control over environmental and genetic confounds. Animal studies also give us the ability to undertake a greater degree of invasiveness and more frequent repetition across the life course and greater flexibility for therapeutic trials.
However, to fully utilize the potential of MRI, the application of standardized protocols must be applied to larger human populations in order to characterize the true nature of CV health and disease. In some areas of biomedicine, particularly in neuroscience, the widespread use of MRI to define normal and abnormal human phenotypes have been undertaken. The Human Connectome Project (https://www.humanconnectome.org), established by the National Institutes of Health in the US, is a multinational and multi-institutional program that utilizes advanced MRI technologies to study over 1200 subjects, focusing on various processes and pathologies involving the human brain, especially those associated a with aging. Other national and international projects of similar scope include the German 1000BRAINS study and the UK Biobank. Recently, the Lifespan Human Connectome Project in Development, a large-scale study of brain connectivity in over 1300 subjects of ages 5–21 years, has been established Reference Somerville, Bookheimer and Buckner128 and the Lifespan Developing Human Connectome Project at Kings College, UK will perform MRI of human brain connectivity in 1500 subjects with post-conceptional ages ranging from 20 to 44 weeks. (https://www.humanconnectome.org/study/lifespan-developing-human-connectome-project).
The prospect of using MRI to improve understanding of brain changes with early development is important since changes in brain macrostructure, microstructure, and hemodynamics have all been documented in human fetuses and infants with late-onset IUGR. Reference Zhu, Milligan and Keating89,Reference Arthurs, Rega and Guimiot129,Reference Polat, Barlow, Ber, Achiron and Katorza130
However, there is not yet any organized effort to evaluate fetal heart development with CMR. Although CMR has become an important component of the Framingham Heart Study in the US Reference Andersson, Johnson, Benjamin, Levy and Vasan131 and the Dutch Heart-Brain Study, Reference Hooghiemstra, Bertens and Leeuwis132 these megaprojects have focused mostly on adults with various pathologies, without consideration of their early developmental histories. In order to fully appreciate the settings and consequences of developmental programming on CVD in the real world, a larger multinational human study that uses cardiac MRI to investigate CV development, including prenatally, should be undertaken. The results of such an effort, in combination with advanced omics testing, would advance the quest for a clear, clinical definition of IUGR. In addition, the data obtained would produce a wealth of information that would not only inform allopathic medicine, but also preventative medicine and public health worldwide.
Acknowledgments
We thank the research team at the Texas Center for Reproductive Health, which includes Dr. Cun Li, Dr. Hillary Huber as well as the administrative support of Karen Moore. The authors also thank Dr. Deepak Kaushal and the Southwest National Primate Center Staff for their ongoing support of the baboon research program described in this article. The authors also acknowledge the animal technical and veterinary support of the Texas Biomedical Research Institute staff.
Financial support
This research program described in this work was supported by the Julio C. Palmaz Endowment for Excellence in Radiology Research Pilot Grant-AHK. Furthermore, this work was supported by the National Institutes of Health 5P01HD021350 – PWN, 1U19AG057758–01A1, 5R24OD011183 – PWN, OD P51 OD011133 – GDC, 1R25EB016631 – AHK, and EU FP 7/HEALTH/GA No. 279,281: BrainAge – Impact of Prenatal Stress on BRAINAGEing.
Conflicts of interest
The authors have no potential conflict of interest, financial or otherwise, to disclose.