1. Introduction
Active faults capable of generating earthquakes may be blind, not reaching the ground surface, and/or be masked by continuous burial/erosion processes at the surface (e.g. Lettis et al. Reference Lettis, Wells and Baldwin1997).
Nevertheless, depending on their dimensions and depths, such structures may provide relevant surface or co-seismic effects, when activated. In some cases, faults can be capable of producing damaging earthquakes also generating surface primary ruptures. In some other cases, fault segments are too small to produce large-magnitude events and co-seismic surface effects, but are large enough to cause significant ground shaking and be clearly felt by the population. In both cases, these elusive faults represent structures that may prove very dangerous in populated areas, especially those with high vulnerability due to the presence of historic buildings. Several damaging earthquakes that have occurred in the recent past are interpreted as having been generated by blind faults (Whittier Narrows 1987 Los Angeles California (USA) M = 5.9 – Hauksson et al. Reference Hauksson, Jones, Davis, Hutton, Williams, Bent, Brady, Reasenberg, Michael, Yerkes and Etheredge1988; Haiti 2010 M = 7.0 – Hayes et al. Reference Hayes, Briggs, Sladen, Fielding, Prentice, Hudnut, Mann, Taylor, Crone, Gold and Ito2010; Christchurch 2010 New Zealand M = 7.1 – Li et al. Reference Li, De Pascale, Quigley and Gravley2014; Van 2011 Turkey M = 7.1 – Doğan & Karaka, Reference Doğan and Karaka2013; Po Plain 2012 Italy M = 5.8 – Burrato et al. Reference Burrato, Vannoli, Fracassi, Basili and Valensise2012). In some cases, such faults never ruptured the surface but show signs of surface activity such as evidence of folding (e.g. Ventura anticline in California – Shaw & Suppe, Reference Shaw and Suppe1994; Montello anticline in Italy – Benedetti et al. Reference Benedetti, Tapponier, King, Meyer and Manighetti2000). In many cases, no detailed information on the potential danger posed by such structures was given prior to the seismic events.
Other faults, though potentially active and seismogenic, are called ‘hidden’, their recent geological and morphological evidences being limited and hence difficult to identify or infer. For example, the M = 4.9 earthquake in 2019 in France occurred on a reactivated Oligocene thrust fault with no geomorphic evidence of cumulative compressional deformation along the fault for several thousand or tens of thousands of years (Ritz et al. Reference Ritz, Baize, Ferry, Larroque, Audin, Delouis and Mathot2020). Such hidden structures can have important impacts on society because they are hard to find, for want of geological or morphological evidence. This implies the existence of active faults that have not yet been identified but that, at least in historical times, gave rise to considerable seismic events. These faults, not showing clear surface evidence of activity, remain mostly unidentified, most studies being focused on indirect surface evidence of their existence and activity.
In order to characterize the earthquake potential of these faults, different approaches are available which range from morphotectonic evidence to palaeoseismological investigations (e.g. Hancock et al. Reference Hancock, Chalmers, Altunel and Çakir1999; Piccardi et al. Reference Piccardi, Gaudemer, Tapponnier and Boccaletti1999, Reference Piccardi, Vittori, Blumetti, Comerci, Di Manna, Guerrieri, Baglione and D’Intinosante2017; Burrato et al. Reference Burrato, Vannoli, Fracassi, Basili and Valensise2012; Brogi et al. Reference Brogi, Capezzuoli, Kele, Baykara and Shen2017; Nirta et al. Reference Nirta, Vittori, Blumetti, Di Manna, Benvenuti, Montanari, Perini, Fiera, Moratti, Baglione and Piccardi2021).
Other approaches were also developed aiming at the integration of both surface and subsurface datasets including seismic interpretation, and borehole data, compared with seismological data to infer fault geometry and slip rates. In fact, the increasing availability of subsurface geological and geophysical information has afforded the opportunity to identify and map faults in the subsurface in great detail (e.g. Armijo et al. Reference Armijo, Meyer, King, Rigo and Papanastassiou1996; Pratt et al. Reference Pratt, Dolanz, Odum, Stephenson, Williams and Templeton1998; Di Bucci et al. Reference Di Bucci, Ravaglia, Seno, Toscani, Fracassi and Valensise2006; Mirabella et al. Reference Mirabella, Barchi, Lupattelli, Stucchi and Ciaccio2008; Bell et al. Reference Bell, McNeill, Bull, Henstock, Collier and Leeder2009; Toscani et al. Reference Toscani, Burrato, Bucci, Seno and Valensise2009; Brogi et al. Reference Brogi, Capezzuoli, Martini, Picozzi and Sandrelli2014). In some cases, comparison of geomorphic anomalies mapping with subsurface reconstructions results in effective identification of potentially active faults (e.g. Toscani et al. Reference Toscani, Burrato, Bucci, Seno and Valensise2009 and references therein).
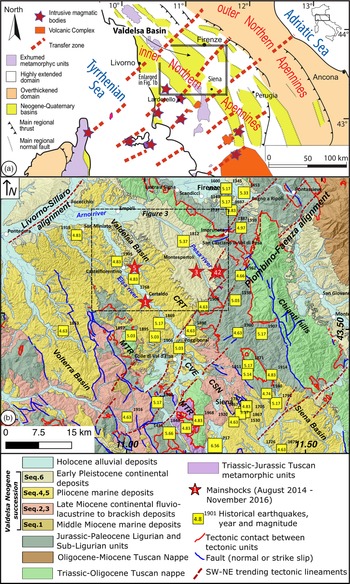
In this paper we focus on a fault system, active since the Neogene, affecting a sector of southern Tuscany (Valdelsa Basin, Fig. 1a). It generated low-magnitude earthquakes in 2014 and 2016 (Castelfiorentino and Certaldo earthquakes, M = 3.9 (25 October 2016) and M = 3.4 (9 August 2014) (Fig. 1b) in an area where the occurrence of active faults has never been documented before.
(a) Tectonic sketch of the Inner Northern Apennines (Central Italy) showing the relationships between the SW–NE lineaments, the Neogene–Quaternary basins and the intrusive magmatic bodies. (b) Geological map of the Valdelsa Basin with the main SW–NE-trending lineaments, the historical seismicity (equivalent magnitude Me > 4.5), and the 2014–16 mainshocks relocated and discussed in this work. Within the map, the Valdelsa Neogene deposits are numbered from Sequence 1 to Sequence 6 for further reference in the text. MTR: Middle Tuscan Ridge; CRT: Certaldo Sub-Basin; CVE: Colle Val d’Elsa Sub-Basin; CSN: Casino Basin.

Notwithstanding the low magnitude of the events and the absence of important damage, these earthquakes occurred in an area where historically stronger events are documented (equivalent magnitude Me = 5.5) and which has high vulnerability due to the presence of both high population density and historic and art-heritage buildings.
After an introduction to the geological and tectonic setting, we present a new interpretation of seismic reflection profiles, acquired for hydrocarbons exploration by the Agip oil company during the 1980s, and calibrated with borehole logs and surface fault kinematic data, and integrate them with an accurate relocation of the seismological data. We conclude that the Castelfiorentino and Certaldo earthquakes and their minor sequences are associated with a NE-trending fault system which belongs to a much wider crustal-scale structure, orthogonal to the main trend of the Valdelsa Basin. We discuss the role of these faults in controlling earthquakes, their detection by means of subsurface data and the possible correlation with geomorphological observations, and we frame their evolution in the Neogene–Quaternary tectonic setting of the inner Northern Apennines.
2. Geological and seismotectonic setting
The Northern Apennines originated from the convergence and collision (late Cretaceous – early Miocene) between the Adria promontory and the European plate, represented by the Sardinia–Corsica massif (Molli, Reference Molli, Siegesmund, Fügenschuh and Froitzheim2008 and references therein). In the inner zone of the Northern Apennines this process gave rise to the stacking of several tectonic units derived from different palaeogeographic domains (Vai & Martini, Reference Vai and Martini2001), namely, from top to bottom (Carmignani et al. Reference Carmignani, Decandia, Disperati, Lazzarotto, Liotta and Meccheri1994): (a) Ligurian units, derived from the Ligurian–Piedmont Domain, and consisting of remnants of Jurassic oceanic crust and its late Jurassic – Cretaceous, mainly clayey, sedimentary cover; (b) Sub-Ligurian units (Sub-Ligurian Domain), made up of Cretaceous–Oligocene turbidites; and (c) Tuscan units forming a duplex system and composed of high-pressure metamorphic and sedimentary units ranging from the Palaeozoic to the early Miocene (Pandeli et al. Reference Pandeli, Bertini and Castellucci1991; Carmignani et al. Reference Carmignani, Decandia, Disperati, Lazzarotto, Liotta and Meccheri1994; Rossetti et al. Reference Rossetti, Faccenna, Jolivet, Goff and Funiciello2002; Brogi & Giorgetti, Reference Brogi and Giorgetti2012; Bianco et al. Reference Bianco, Brogi, Caggianelli, Giorgetti, Liotta and Meccheri2015) (Fig. 2a). The Ligurian and Sub-Ligurian units were thrust eastward over the Tuscan Nappe during the late Oligocene – early Miocene. After nappe stacking, eastward-migrating extension affected the inner Northern Apennines, i.e. northern Tyrrhenian Basin and Tuscany (e.g. Lavecchia, Reference Lavecchia1988; Patacca et al. Reference Patacca, Sartori and Scandone1990; Doglioni, Reference Doglioni1991; Carmignani et al. Reference Carmignani, Decandia, Disperati, Lazzarotto, Liotta and Meccheri1994; Molli, Reference Molli, Siegesmund, Fügenschuh and Froitzheim2008; Barchi, Reference Barchi, Beltrando, Peccerillo, Mattei, Conticelli and Doglioni)2010; Rossetti et al. Reference Rossetti, Glodny, Theye and Maggi2015) since the Miocene (Carmignani et al. Reference Carmignani, Decandia, Disperati, Lazzarotto, Liotta and Meccheri1994; Dallmeyer & Liotta, Reference Dallmeyer and Liotta1998; Liotta et al. Reference Liotta, Cernobori and Nicolic1998; Brogi & Liotta, Reference Brogi and Liotta2008; Brogi, Reference Brogi2011) and determined the development of mainly eastward-dipping normal faults, which produced: (a) the lateral segmentation of the more competent levels within the previously stacked tectonic units (Decandia et al. Reference Decandia, Lazzarotto and Liotta1993); (b) the consequent westward rotation of their hangingwalls (Brogi, Reference Brogi2004); (c) the direct superimposition of the Ligurian units on the late Triassic evaporite and/or on the Palaeozoic phyllites, both representing regional detachment levels (Brogi & Liotta, Reference Brogi and Liotta2008); and (d) an extension of at least 120 % (Carmignani et al. Reference Carmignani, Decandia, Disperati, Lazzarotto, Liotta and Meccheri1994; Brogi, Reference Brogi2006). The youngest extensional event (Dallmeyer & Liotta, Reference Dallmeyer and Liotta1998; Barchi, Reference Barchi, Beltrando, Peccerillo, Mattei, Conticelli and Doglioni)2010), active since the early Zanclean (Martini et al. Reference Martini, Ambrosetti, Brogi, Aldinucci, Zwaan and Sandrelli2021), is characterized by NW-trending normal faults cross-cutting the previously developed structures (Mazzanti, Reference Mazzanti1966; Calamai et al. Reference Calamai, Cataldi, Squarci and Taffi1970; Lazzarotto & Mazzanti, Reference Lazzarotto and Mazzanti1978) and defining tectonic depressions where Pliocene to Quaternary marine to continental sediments were deposited (Bossio et al. Reference Bossio, Mazzei, Salvatorini and Sandrelli1993 a; Martini & Sagri, Reference Martini and Sagri1993). The amount of extension associated with this event is estimated in the order of 6–7 % (Carmignani et al. Reference Carmignani, Decandia, Disperati, Lazzarotto, Liotta and Meccheri1994). These depressions are coeval with NE-trending fault zones (Liotta, Reference Liotta1991) that controlled the volcanism and the emplacement of magmatic bodies at shallow crustal levels (Fig. 1a) (Acocella & Funiciello, Reference Acocella and Funiciello2006; Dini et al. Reference Dini, Mazzarini, Musumeci and Rocchi2008; Brogi et al. Reference Brogi, Capezzuoli, Aqué, Branca and Voltaggio2010; Farina et al. Reference Farina, Dini, Innocenti and Rocchi2010; Liotta et al. Reference Liotta, Brogi, Meccheri, Dini, Bianco and Ruggieri2015). These SW–NE-trending fault zones (e.g. the Livorno–Sillaro line (Fig. 1b)), recognized by many authors since the 1960s through satellite image analyses (Ambrosetti et al. Reference Ambrosetti, Carboni, Conti, Costantini, Esu, Gandin, Girotti, Lazzarotto, Mazzanti, Nicosia, Parisi and Sandrelli1978; Boccaletti et al. Reference Boccaletti, Coli, Eva, Ferrari, Giglia, Lazzarotto, Merlanti, Nicolich, Papani and Postpischl1985), are characterized by strike- to oblique-slip kinematics and associated horizontal displacements (see Basili & Valensise, Reference Basili, Valensise, Valensise and Pantosti2001; Brogi et al. Reference Brogi, Fidolini and Liotta2013; Liotta & Brogi, Reference Liotta and Brogi2020). The origin and role of these structures is not well established, and they are variously interpreted as transfer zones, lateral ramps of thrusts and segmenting features of the NW–SE-trending extensional systems (Ghelardoni Reference Ghelardoni1965; Boccaletti & Dainelli Reference Boccaletti and Dainelli1982; Fazzini & Gelmini Reference Fazzini and Gelmini1982; Rosenbaum & Piana Agostinetti Reference Rosenbaum and Piana Agostinetti2015). One of these main fault zones (referred to as the ‘Piombino–Faenza line’) crosses the study area (Fig. 1b) and interrupts the continuity of the Valdelsa Basin and of other basins (the Firenze (Florence), Casino -CSN and Volterra basins in Fig. 1b) (Canuti et al. Reference Canuti, Pranzini and Sestini1966; Bossio et al. Reference Bossio, Mazzei, Salvatorini and Sandrelli2002).
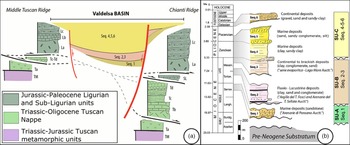
(a) Sketch of the tectonic units of the inner Northern Apennines and of their relationship with the Valdelsa Basin infill. TM: Triassic Verrucano siliciclastics Group and Jurassic–Eocene metasedimentary cover; Ta: Late Triassic evaporite; Tc-Td: Cretaceous – early Miocene clayey and arenaceous succession; La: Jurassic oceanic crust (peridotites, gabbros and basalts); Lb: sedimentary cover made of Jurassic radiolarite and Cretaceous shale, clayey marl and limestone; Lc: S. Fiora unit composed of Cretaceous–Eocene clayey–marly and arenaceous succession. (b) Sequence-stratigraphic subdivision of the Neogene succession present in Valdelsa Basin and based on the distinctions proposed by Pascucci et al. (Reference Pascucci, Martini, Sagri, Sandrelli, Nichols, Williams and Paola2007). Results composed by the superposition of marine (Seq. 1, 4, 5) and continental (Seq. 2, 3, 6) sequences characterized by variable thickness and lithological composition. To the right the sequences are grouped in relation to the seismic units (SU) shown later in the paper. Sequences are locally divided by unconformities (thicker undulated lines).

The Neogene extensional setting and evolution, confirmed by many field and laboratory studies (among others, Lavecchia, Reference Lavecchia1988; Jolivet et al. Reference Jolivet, Dubois, Fournier, Goffe, Michard and Jourdan1990; Carmignani et al. Reference Carmignani, Decandia, Disperati, Lazzarotto, Liotta and Meccheri1994; Bartole, Reference Bartole1995; Barchi et al. Reference Barchi, Feyter, Magnani, Minelli, Pialli and Sotera1998; Gualtieri et al. Reference Gualtieri, de Franco and Mazzotti1998; Liotta et al. Reference Liotta, Cernobori and Nicolic1998; Negredo et al. Reference Negredo, Barba, Carminati, Sabadini and Giunchi1999; Rossetti et al. Reference Rossetti, Faccenna, Jolivet, Funiciello, Tecce and Brunet1999; Di Bucci & Mazzoli, Reference Di Bucci and Mazzoli2002; Pera et al. Reference Pera, Mainprice and Burlini2003; Collettini et al. Reference Collettini, Paola, Holdsworth and Barchi2006; Brogi, Reference Brogi2008) has been challenged by alternative interpretations (e.g. Bonini & Moratti, Reference Bonini and Moratti1995; Finetti et al. Reference Finetti, Boccaletti, Bonini, Ben, Geletti, Pipan and Sani2001; Bonini & Sani, Reference Bonini and Sani2002; Finetti, Reference Finetti2006; Bonini et al. Reference Bonini, Sani, Stucchi, Moratti, Benvenuti, Menanno and Tanini2014). A discussion of the reasons why an extensional setting better explains the regional geological features of Tuscany is provided in Brogi et al. (Reference Brogi, Lazzarotto, Liotta and Ranalli2005), Brogi & Liotta (Reference Brogi and Liotta2008) and Brogi (Reference Brogi2011, Reference Brogi2020), to which we address the reader for further information.
The inner zone of the Northern Apennines is characterized by low-magnitude seismic events (M < 4.5) mainly confined to the shallow crust, at depths ranging between 3 and 10 km (Selvaggi & Amato, Reference Selvaggi and Amato1992; Cameli et al. Reference Cameli, Dini and Liotta1993; Batini et al. Reference Batini, Console and Luongo1985; Di Bucci & Mazzoli, Reference Di Bucci and Mazzoli2002; Braun et al. Reference Braun, Caciagli, Carapezza, Famiani, Gattuso, Lisi, Marchetti, Mele, Pagliuca, Ranaldi and Sortino2018 a). The majority of earthquakes are concentrated in the geothermal areas of Tuscany, south of the study area (Larderello–Travale and Mount Amiata) and Northern Latium (Batini et al. Reference Batini, Console and Luongo1985; Buonasorte et al. Reference Buonasorte, Fiordelisi and Rossi1987; Cameli et al. Reference Cameli, Dini and Liotta1993; Console & Rosini, Reference Console and Rosini1998; Albarello et al. Reference Albarello, Batini, Bianciardi, Ciulli, Spinelli and Viti2005; Braun et al. Reference Braun, Caciagli, Carapezza, Famiani, Gattuso, Lisi, Marchetti, Mele, Pagliuca, Ranaldi and Sortino2018 a, b; Lisi et al. Reference Lisi, Marchetti, Frepoli, Pagliuca, Mele, Carapezza, Caciagli, Famiani, Gattuso and Braun2019), where some of them could probably be ascribed to the extraction and reinjection of geothermal fluids. Relatively low seismicity characterizes the other areas of Tuscany.
In terms of seismic hazard, southern Tuscany, as well as the inner Northern Apennines, was considered of modest interest and seismogenically less energetic, in contrast to outer zones (e.g. the Umbria–Marche and Abruzzo Regions and the Adriatic Sea), where earthquakes recorded in the last century reached magnitudes up to 6.8 (Avezzano earthquake, 1915; 32 000 victims (Console et al. Reference Console, Murru and Alessandrini1993; De Luca et al. Reference De Luca, Scarpa, Filippi, Gorini, Marcucci, Marsan, Milana and Zambonelli1999; Galadini & Galli, Reference Galadini and Galli2000; Alessandrini et al. Reference Alessandrini, Filippi and Borgia2001; Chiarabba et al. Reference Chiarabba, Jovane and Stefano2005; Pace et al. Reference Pace, Peruzza, Lavecchia and Boncio2006; Faenza & Pierdominici, Reference Faenza and Pierdominici2007)).
Nevertheless, the available information on the historical seismicity of both the Valdelsa and Chianti areas in southern Tuscany (i.e. DBMI15, Locati et al. Reference Locati, Camassi, Rovida, Ercolani, Bernardini, Castelli, Caracciolo, Tertulliani, Rossi, Azzaro and D’Amico2021) highlights a different scenario where damaging seismic events were documented (Boschi et al. Reference Boschi, Guidoboni, Ferrari, Valensise and Gasperini1997; Camassi et al. Reference Camassi, Castelli, Molin, Bernardini, Caracciolo, Ercolani and Postpischl2011) (Fig. 1b).
3. The Valdelsa Basin
The Valdelsa Basin (Fig. 3, location in Fig. 1b) is part of a broad Neogene NNW–SSE-oriented tectonic depression, crossing southern Tuscany from the Arno river (to the north) to the Bolsena lake (to the south) and comprehending the Siena and the Casino basins (Fig. 1b). The 70 km long Valdelsa Basin shows an articulated width, ranging from 30 km in its northern portion (Certaldo sub-basin) to less than 15 km in its southern sector (Colle Val d’Elsa sub-basin), with the threshold located in correspondence to a NE–SW-oriented tectonic lineament known as the Piombino–Faenza line (Fig. 1b) (Ambrosetti et al. Reference Ambrosetti, Carboni, Conti, Costantini, Esu, Gandin, Girotti, Lazzarotto, Mazzanti, Nicosia, Parisi and Sandrelli1978; Boccaletti et al. Reference Boccaletti, Coli, Eva, Ferrari, Giglia, Lazzarotto, Merlanti, Nicolich, Papani and Postpischl1985; Liotta, Reference Liotta1991).
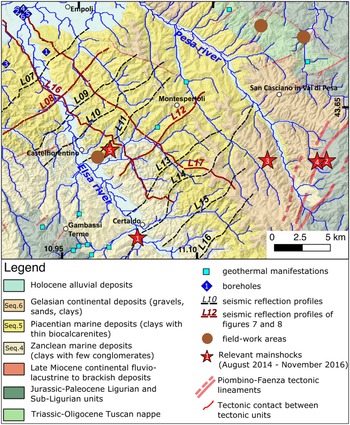
Geological map of the study area (location in Fig. 1b) showing the distribution of the Neogene deposits, the position of the 2014–16 mainshocks, and the position of the subsurface data used for the subsurface reconstruction (boreholes and seismic reflection profiles). Key to borehole numbers: 1 = Monterappoli1; 2 = Certaldo2; 3 = Certaldo3; 4 = Certaldo4; 5 = Certaldo1; 6 = CertaldoSud1.

The basin is delimited by the Middle-Tuscan Range and Chianti Hills to the SW and NE, respectively (Fig. 1b), where metamorphic and non-metamorphic units, forming the remnants of the Northern Apennines tectonic pile, are exposed. These units are, from the top (Fig. 2a): (a) the Ophiolitic Unit (the uppermost tectonic unit belonging to the Ligurian Complex) consisting of remnants of the Jurassic oceanic crust (serpentinized harzburgite, gabbro and basalt; La in Fig. 2a), and the sedimentary cover, mainly composed of Jurassic radiolarite and Cretaceous shale, clayey marl and limestone (Lb in Fig. 2a); (b) the S. Fiora Unit composed of Cretaceous–Eocene clayey–marly and arenaceous succession deposited on the oceanic crust of the Neo-Tethys (Lc in Fig. 2a); (c) the Canetolo Unit (Argille e calcari Auct.) composed of Eocene clayey–carbonate succession deposited in a transitional crustal sector passing from the oceanic crust to the Adria continental margin (SL in Fig. 2a); (d) the Tuscan Nappe representing the deepest non-metamorphic tectonic units of the Northern Apennines, composed of Late Triassic evaporite (Ta in Fig. 2a), Jurassic–Cretaceous carbonate–siliceous (Tb in Fig. 2a) and Cretaceous – early Miocene clayey (Tc in Fig. 2a) and arenaceous (Td in Fig. 2a) succession; (e) the Tuscan Metamorphic Unit consisting of a metamorphic succession composed of the Palaeozoic phyllite–quarzitic Group, the Triassic Verrucano metasiliciclastics Group and Jurassic–Eocene metasedimentary cover (marble, calcschist and phyllite; TM in Fig. 2a).
Boreholes and indirect subsurface data analyses in the basin highlight buried structural highs, both longitudinal and transversal to the basin (Mariani & Prato, Reference Mariani and Prato1988; Pascucci et al. Reference Pascucci, Martini, Sagri, Sandrelli, Nichols, Williams and Paola2007; Benvenuti et al. Reference Benvenuti, del Conte, Scarselli and Dominici2014), separating the depocentre, infilled with more than 1 km of sediments and located in a narrow sector comprised between the western basin shoulder and the valley of the Elsa river (Pascucci et al. Reference Pascucci, Martini, Sagri, Sandrelli, Nichols, Williams and Paola2007).
The whole study area is affected by both NW- and NE-striking faults of regional relevance (Fig. 1b). A mostly continuous SW-dipping normal fault system occurs in the eastern border of the basin. The fault segments separating the Neogene deposits from the pre-Neogene units are mostly buried, but parallel segments can be recognized within the substratum units (Fig. 1b). Nevertheless, the prolongation of this fault system, as well as of the basin itself toward the SE, is interrupted in correspondence to the NE-striking Piombino–Faenza tectonic lineament.
The Valdelsa Basin is characterized by heat flow values locally reaching 100 mW m−2 (Mongelli and Zito, Reference Mongelli and Zito1991), in the range of the average value of the southern Tuscany geothermal anomaly (Della Vedova et al. Reference Della Vedova, Bellani, Pellis, Squarci, Vai and Martini2001). The whole Valdelsa Basin is therefore characterized by geothermal manifestations, consisting of tectonically controlled thermal springs and gas vents (Bencini et al. Reference Bencini, Duchi and Rainero1979; Fazzuoli et al. Reference Fazzuoli, Garzonio and Vannocci1983; Minissale, Reference Minissale2004) mainly concentrated in the Gambassi Terme – Certaldo area and the Montespertoli–Firenze area (Fig. 3) and located along a dominant SW–NE trend. The physico-chemical characteristics of the thermal waters allow some different compositional groups to be recognized. According to several authors (Bencini et al. Reference Bencini, Duchi and Rainero1979; Celati et al. Reference Celati, Grassi and Calore1990; Fazzuoli et al. Reference Fazzuoli, Garzonio and Vannocci1983; Minissale, Reference Minissale2004), the most homogeneous group consists of alkaline-chloride type waters that seem to be mainly controlled by evaporitic processes possibly related to Triassic Burano Fm. Other types of waters, such as the alkaline-bicarbonate type, may reflect interaction with different rocks, from carbonate successions (Ligurian and/or Tuscan units) to Neogene clays.
3.a. Stratigraphy of the Neogene deposits
The sediments cropping out in the Valdelsa Basin consist of Plio-Pleistocene marine and continental deposits. The marine Pliocene sediments, mostly consisting of clay, marl, sand, gravel and conglomerate, are unconformably overlaid by fluvio-lacustrine Pleistocene gravel, sand, clay and locally by Middle–Late Pleistocene continental carbonate (Capezzuoli et al. Reference Capezzuoli, Foresi, Salvatorini and Sandrelli2005; Capezzuoli et al. Reference Capezzuoli, Priori, Costantini and Sandrelli2009). The stratigraphic setting of the Valdelsa Basin was classically described through informal lithostratigraphy of an overall regressive trend (Lotti, Reference Lotti1900; Lotti et al. Reference Lotti, Fossen and Canavari1908; Canuti et al. Reference Canuti, Pranzini and Sestini1966; Merla & Bortolotti, Reference Merla and Bortolotti1967; Merla et al. Reference Merla, Bortolotti and Passerini1967) and biostratigraphically constrained by markers such as planktonic foraminifera, nannofossils (Bossio et al. Reference Bossio, Costantini, Lazzarotto, Liotta and Mazzanti1993 b; Capezzuoli et al. Reference Capezzuoli, Foresi, Salvatorini and Sandrelli2005) and continental micromammals (Benvenuti et al. Reference Benvenuti, Dominici and Rook1995; Abbazzi et al. Reference Abbazzi, Benvenuti, Ceci, Esu, Faranda, Rook and Tangocci2008).
A detailed revision of the tectono-stratigraphic setting was performed by Benvenuti & Degl’Innocenti (Reference Benvenuti and Degli’Innocenti2001) and Benvenuti et al. (Reference Benvenuti, del Conte, Scarselli and Dominici2014), who divided the upper Messinian – Pliocene infilling succession into seven unconformities-bounded stratigraphic units (S1–S7).
We refer to the subdivision of units proposed by Pascucci et al. (Reference Pascucci, Martini, Sagri, Sandrelli, Nichols, Williams and Paola2007) schematized in Figure 2b as more directly connected to the seismic units described later in the text. According to Pascucci et al. (Reference Pascucci, Martini, Sagri, Sandrelli, Nichols, Williams and Paola2007), the basin results infilled with up to 1000 m of Late Miocene and 1000 m of Pliocene deposits (Seq.2 to Seq.5). A deeper Late Serravallian succession (Seq.1) formed by continental to shallow marine sandstone and conglomerate (Ponsano Sandstone Fm; Foresi et al. Reference Foresi, Bambini, Mazzei, Piccinelli and Sandrelli2003 and references therein), unconformably resting on the basin substratum represented by Ligurian units, was described in discontinuous exposures in the SE portion of the basin (Lazzarotto & Sandrelli, Reference Lazzarotto and Sandrelli1977; Pasini & Sandrelli, Reference Pasini and Sandrelli1977).
The Late Miocene continental succession unconformably overlies Seq.1 and encompasses Late Tortonian – Messinian fluvial–lacustrine sediments (Seq.2), mainly consisting of clayey–sandy levels and conglomerate with interbedded lignite-level beds (‘Serie Lignitifera’), and late Messinian lacustrine clays (Seq.3; S1 of Benvenuti et al. Reference Benvenuti, del Conte, Scarselli and Dominici2014) with layers of sandstone and conglomerates occurring mainly in the SE area (Casino Basin; Lazzarotto & Sandrelli, Reference Lazzarotto and Sandrelli1977).
Seq.3 is overlain by the Zanclean Seq.4 (S2, S3 of Benvenuti et al. Reference Benvenuti, del Conte, Scarselli and Dominici2014) mostly composed of marine clays with a few interstratified conglomeratic layers. Clay dominates the centre of the basin, with the coarser clastic deposits occurring on the margins. The Piacenzian Seq.5 (S4, S5, S6 of Benvenuti et al. Reference Benvenuti, del Conte, Scarselli and Dominici2014) is composed of marine clays; thin sandstone units occur at its base and top, where there are also local, thin biocalcarenites.
The above units are overlain by an Early Pleistocene (Gelasian) deposition (S7 of Benvenuti et al. Reference Benvenuti, del Conte, Scarselli and Dominici2014) of fluvial drainages deriving from the Chianti Hills.
3.b. Historical and instrumental seismicity
Widespread low-magnitude seismicity characterizes the whole inner zone of the Northern Apennines. The seismic events are mainly confined to the upper crust, at depths ranging from 3 to 10 km (Selvaggi & Amato, Reference Selvaggi and Amato1992; Cameli et al. Reference Cameli, Dini and Liotta1993; Di Bucci & Mazzoli, Reference Di Bucci and Mazzoli2002). The Istituto Nazionale di Geofisica e Vulcanologia (INGV) earthquake catalogues CPTI-15 (Rovida et al. Reference Rovida, Locati, Camassi, Lolli and Gasperini2016) and DBMI15 (Locati et al. Reference Locati, Camassi, Rovida, Ercolani, Bernardini, Castelli, Caracciolo, Tertulliani, Rossi, Azzaro and D’Amico2021) indicate that the historical seismicity in the area was characterized by several moderate earthquakes, with magnitudes in the Valdelsa Basin up to Me = 5.1 (Fig. 1b).
The strongest seismic event ever reported in the area between Chianti and Valdelsa occurred on 18 May 1895 and had a magnitude of Me 5.5. The intensity reached VIII (MCS) and caused four casualties. In the aftermath, the small locality Sant’Andrea changed its name to Sant’Andrea in Percussina (name derived from ‘percussion’ to testify to ground shaking). However, recent seismic events with epicentres inside the study area (Castelfiorentino–Certaldo) have not exceeded M = 4.7. Recently, four relevant seismic sequences (3.4 < M < 4.1) occurred in the area between Valdelsa and Chianti (Table 1).
Mainshocks within the study area

ML, local magnitude; Mw, moment magnitude. Relevant mainshocks occurring in the period August 2014 to November 2016 in the study area (after http:/terremoti.ingv.it). The ‘Certaldo’ (1) and ‘Castelfiorentino’ (5) events are discussed in more detail in the text and their focal solution is shown in Figure 9.
4. Methods
We integrate available surface structural and kinematic data in the substrate, the interpretation of a set of seismic reflection profiles calibrated with boreholes and the relocation of seismicity to identify possible surface and subsurface evidence of the faults responsible for the most recent seismic sequences. We performed fieldwork along bedrock-hosted fault segments in order to gain information on the fault geometry and kinematics. Fieldwork data were gathered at three main structural sites located in Figure 3.
Based on a detailed revision of the Neogene deposits stratigraphy, we interpreted a set of seismic reflection profiles which cross the Valdelsa basin and which were calibrated with both surface geology and the Monterappoli1 borehole, the closest and most relevant in the area (Fig. 3). The seismic profiles interpretation allowed us to draw a subsurface image of the relevant tectonic structures and to identify and map the Neogene basin depocentre throughout the area.
We relocated the 2014 Certaldo and 2016 Castelfiorentino main shocks of the seismic sequences and plotted the events onto two cross-sections obtained from the depth-converted seismic reflection profiles.
We compared the above-mentioned datasets and interpreted the results into a comprehensive picture of the elusive active faults of the area.
5. Data
5.a. Structural and kinematic data
As the epicentral distribution of the earthquakes is mostly concentrated along a SW–NE-trending tectonic lineament, detailed structural analyses were carried out on a wide area comprehending the central-eastern part of the Valdelsa Basin and its eastern shoulder. Here, structural and kinematic data were collected in a few (due to the scarcity of significant outcrops), though noteworthy, exposures (see locations in Fig. 3). The clay and silt filling the basin, in fact, are not suitable for the development and preservation of fault scarps, as well as the related kinematic indicators. Despite this limitation, mesoscopic faults were analysed in a few exposures made up of unconsolidated clayey deposits, belonging to the Piacenzian marine succession, and on the pre-Neogene units (i.e. Tuscan Nappe and Ligurian units) of the basin substratum, in order to obtain more exhaustive geometric and kinematic information. The collection of these data took place mostly in the substratum, with a few also being collected in the basin infill, and was aimed at avoiding kinematic data derived from pre-Neogene deformational events. Using this approach, independently of the deformed lithotype, rock age and kinematic indicators, the orientation of the analysed mesoscopic faults follows the main trend of the regional-scale structures (Fig. 1b), thus displaying both NW- and NE-striking fault systems.
Kinematics was analysed overall for the NE-trending structures, which are the most recurring structures in the study area. Exposures suitable for kinematic analyses are rare, due to the lithological composition of the Ligurian units mainly formed by shale with interbedded limestone beds. Nevertheless, continuous exposures of sandstone and marl levels were found on fresh cuts along the main roads or within river incisions. More than 50 kinematic data points were collected from three structural stations in three fieldwork areas (see locations in Fig. 3).
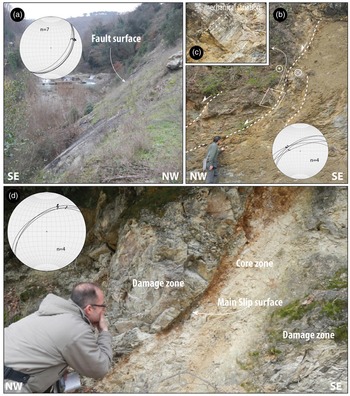
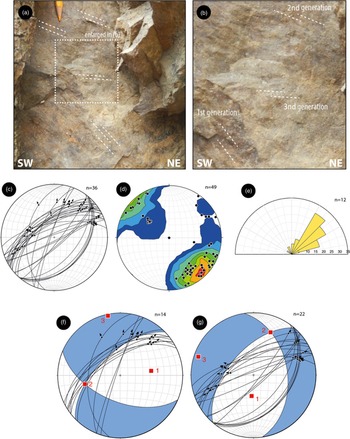
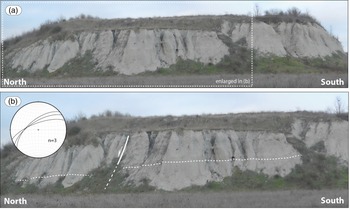
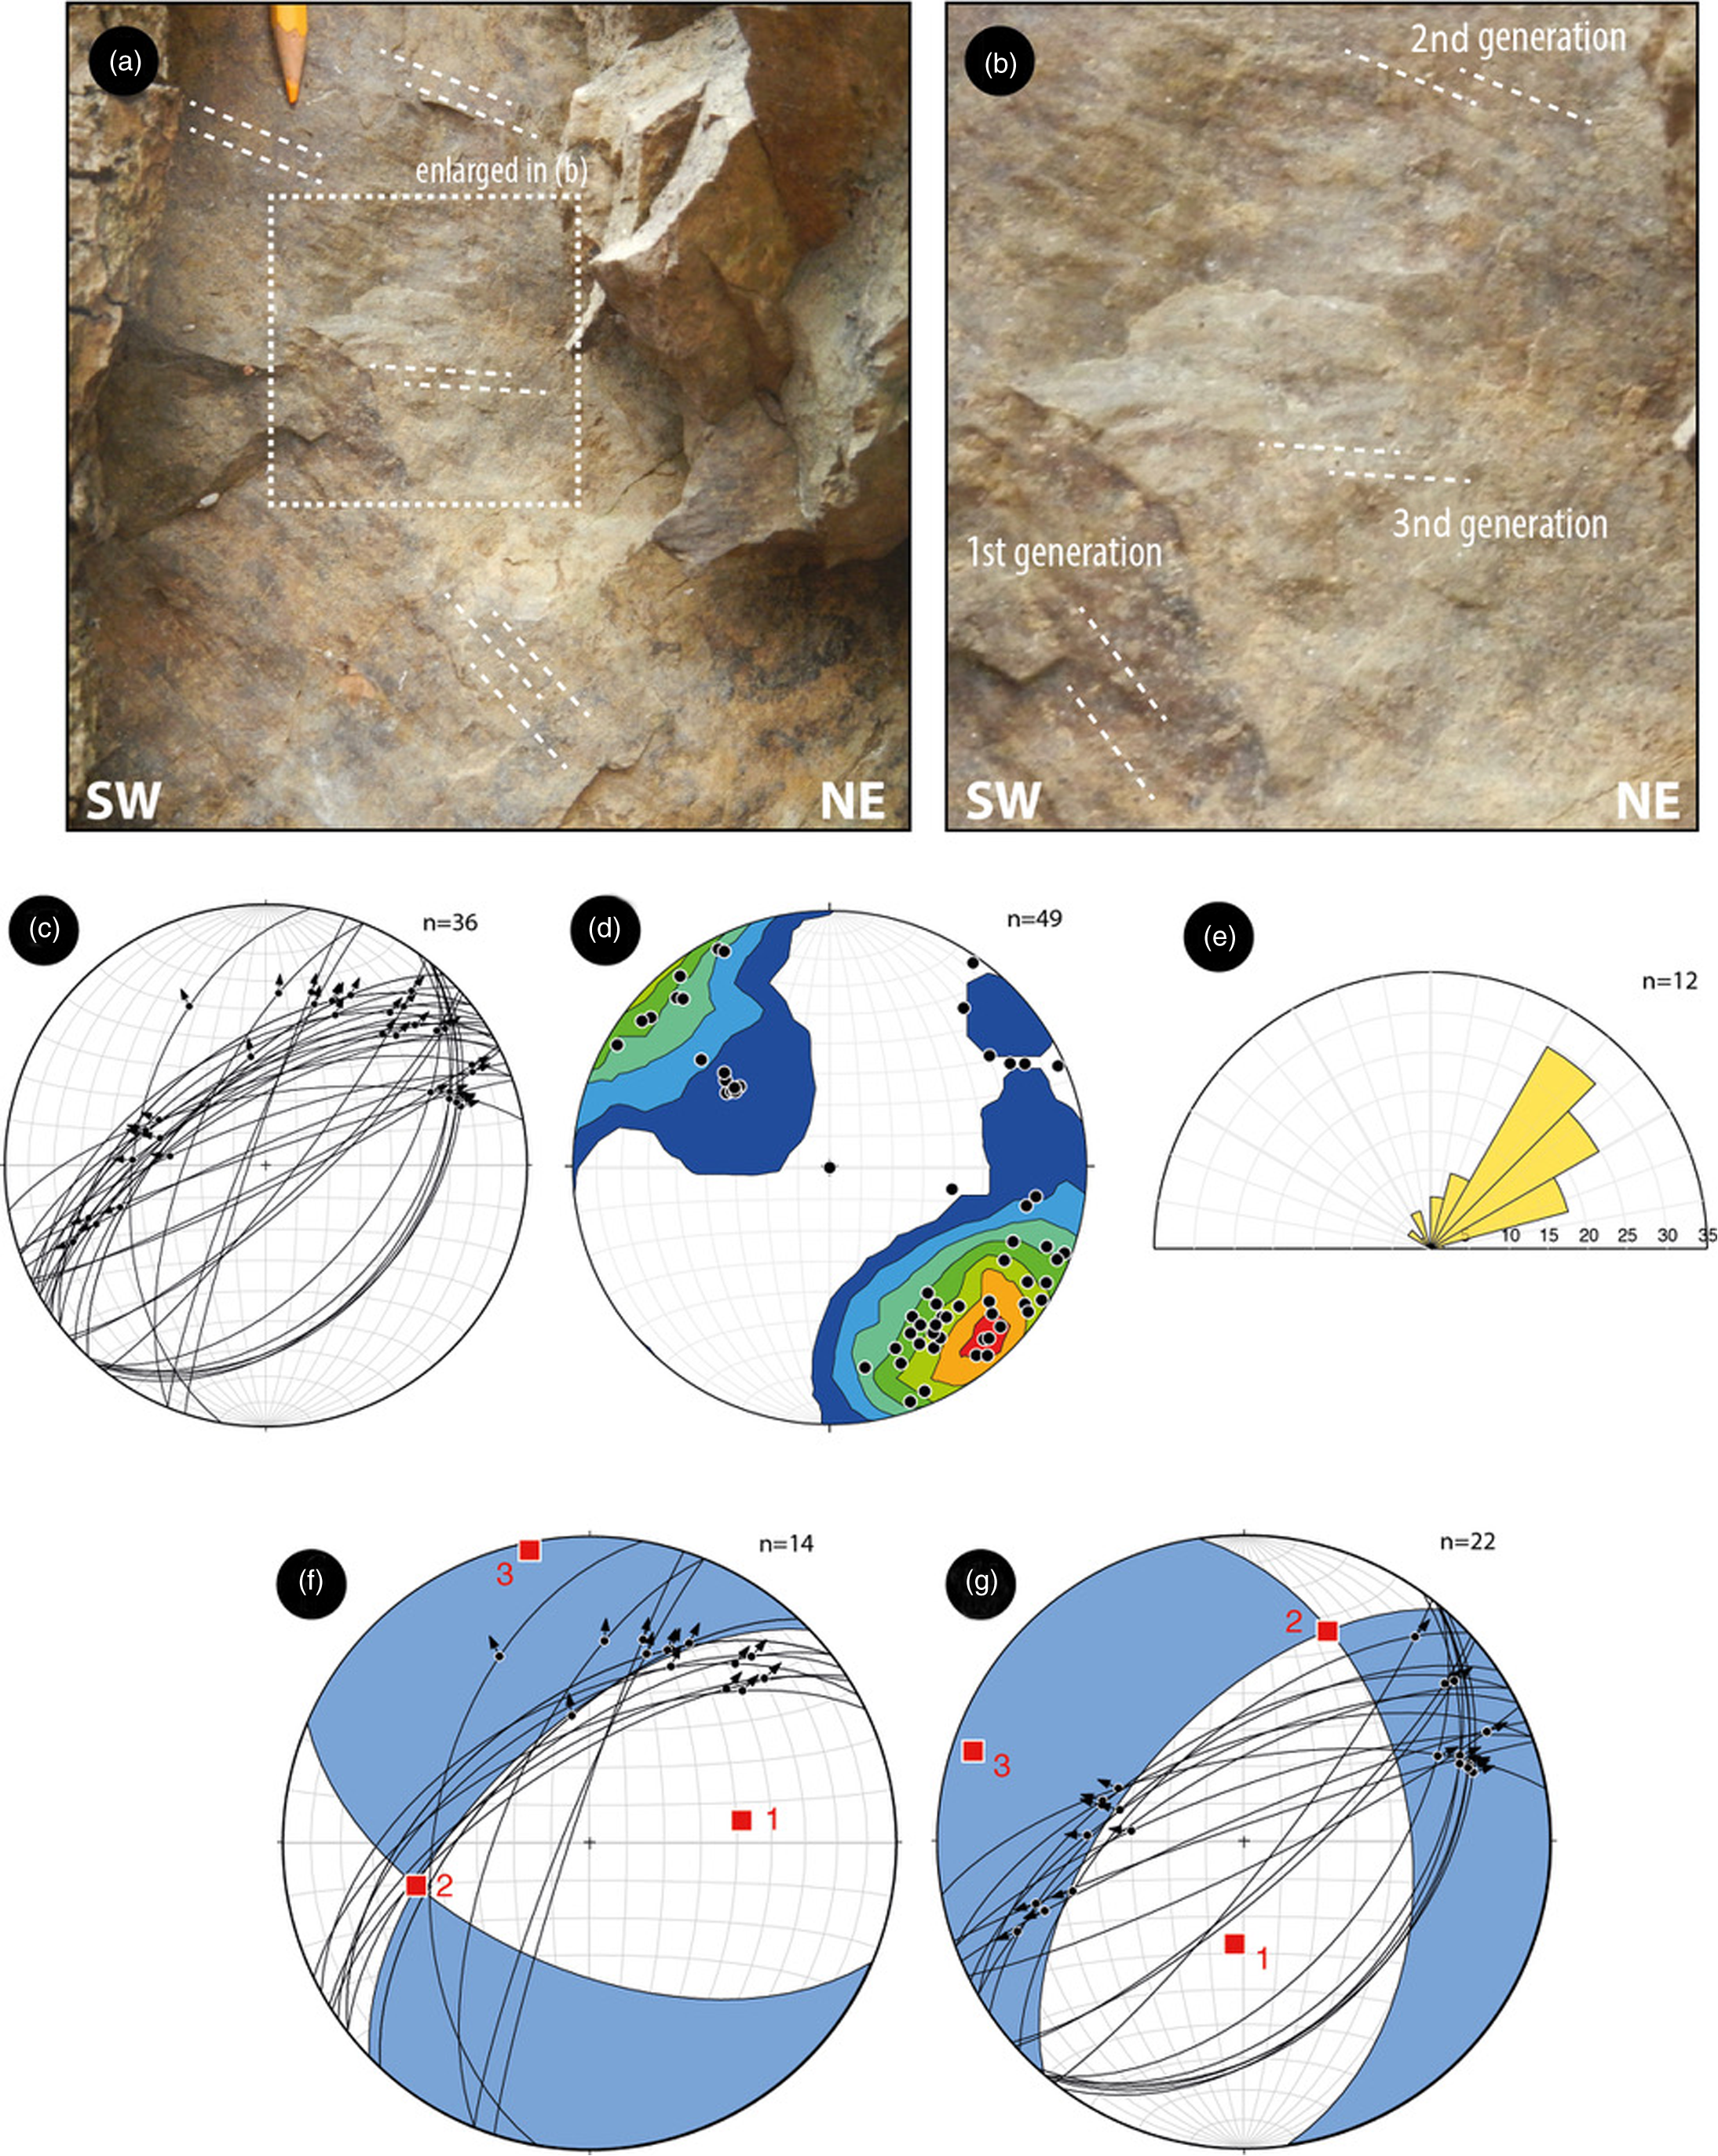
In the sandstone and marly rocks of the Tuscan Nappe and Ligurian units, respectively, the bulk of the mesoscale faults are characterized by a core zone up to 40 cm in size, derived from the comminution of the damaged lithotypes (Fig. 4). The fault damage zone is characterized by well-organized fracture networks defining metre-sized domains, with different amounts of deformation that decrease with distance from the core zone. Kinematic indicators are given by slicken-lines, calcite fibre steps and chatter marks (Fig. 4), arrays of extensional jogs and T-fractures. Kinematic indicators on the NE-striking fault system show at least three superposed movements, at a few structural stations (Fig. 5). Movements range from strike-slip to oblique-slip even if dominant oblique to normal components were recognized. In the basin fill, fault slip surfaces are less widespread due to the dominant clayey and sandy composition of the Neogene sediments. Fault surfaces with clear kinematic indicators were not recognized, but clear NE-striking fault segments were analysed in an abandoned quarry near Castelfiorentino (Fig. 6). Here, the bulk of the meso-faults affecting the unconsolidated sediments are characterized by apparent offsets of a few decimetres and by a thin core (c. 1 cm). Data on fault geometry and kinematics are reported in Figure 5.
Examples of mesoscopic-scale fault analysed north of San Casciano Val di Pesa (see Fig. 3 for location): (a) SE-dipping transtensional left-lateral fault affecting late Oligocene sandstone of the Tuscan Succession; (b) outcrop-scale transtensional left-lateral NW-dipping fault affecting alternated limestone beds and shale of the Ligurian units; (c) detail of the kinematic indicators in (b) showing transtensional left-lateral kinematics; (d) NW-dipping right-lateral oblique-slip fault zone showing a core c. 50 cm thick surrounded by metres-thick damage zone affecting marly limestone of the Ligurian units. Stereographic diagrams (lower hemisphere, equal area) indicate fault and striae measured in the fault surfaces shown in the photographs.

(a) Superposed kinematics indicators on a fault surface in late Oligocene sandstone north of San Casciano Val di Pesa (see Fig. 3 for location); (b) detail of three generations of movements; (c) stereographic diagrams (lower hemisphere, equal area) indicating the representative fault and striae measured in the measured fault; (d) density contours of fault poles; (e) fault strikes rose diagrams; (f, g) palaeo-strain analysis using the right-diedra method (Angelier, Reference Angelier1979) obtained with Faultkin application (Marrett and Allmendinger, Reference Marrett and Allmendinger1990; Allmendinger et al. Reference Allmendinger, Cardozo and Fisher2012) showing fault-plane solutions and main kinematic axes.
NE-striking fault segments in an abandoned quarry near Castelfiorentino (see Fig. 3 for location). The apparent offsets in the unconsolidated sediments are of a few decimetres and from a c. 1 cm thin core.

Kinematic data from the measured fault surfaces can be used for palaeo-stress analysis, graphically represented by double-couple fault-plane solution diagrams (Angelier, Reference Angelier1979).
In Figure 5, NE-striking oblique-slip faults with right- and left-lateral movements were analysed separately. Right-lateral faults display a maximum compressional axis trending about E–W. The minimum compressional axis is always almost sub-horizontal and trending about N–S. Left-lateral faults display a maximum compressional axis trending about N–S and a minimum compressional axis almost sub-horizontal and trending about W–E.
5.b. Interpretation of seismic lines and basin architecture
We considered a dataset of c. 150 km of seismic data composed of 12 seismic reflection profiles acquired in the 1980s by the Agip oil company (presently ENI), and six boreholes (see locations in Fig. 3). Some of these seismic profiles have been interpreted in the past and some are already published (Pascucci et al. Reference Pascucci, Martini, Sagri, Sandrelli, Nichols, Williams and Paola2007; Benvenuti et al. Reference Benvenuti, del Conte, Scarselli and Dominici2014). The seismic lines are both longitudinal (NW–SE) and transversal (SW–NE) with respect to the trend of the basin and main geological structures and reach c. 4 s two-way travel time (TWT), corresponding to c. 6 km on the basis of the average subsurface velocities.
The quality of the seismic lines is very good in the upper 2 s TWT due to good penetration of the seismic signal and to the lithological characteristics of the basins infill being mostly made up of both marine and continental sandy and clayey successions.
We interpreted the complete dataset and present the four most representative seismic profiles, which image the subsurface geological setting of the area (Figs 7 and 8). The interpretation of the seismic data was calibrated with the Monterappoli1 well, which is the closest to the study area (location in Fig. 3). The most representative wells in the area (Certaldo1, Certaldo2, Certaldo3, CertaldoSud1 and Certaldo4) were also considered, in order to have a better control on the later continuity of the drilled successions. The Monterappoli1 borehole (publicly available in the VIDEPI PROJECT database – https://www.videpi.com/videpi/pozzi/consultabili.asp) was projected onto the closest seismic profile (L17 in Fig. 3), and the main lithological boundaries were associated with the corresponding reflectors. The association between the contacts encountered in the borehole and the seismic profile was made by using the stacking interval velocities, which were compared with the available data for these units (Bally et al. Reference Bally, Burbi, Cooper and Ghelardoni1986; Buonasorte et al. Reference Buonasorte, Cataldi, Ceccarelli, Costantini, D’offizi, Lazzarotto, Ridolfi, Baldi, Barelli, Bertini and Bertrami1988; Barchi et al. Reference Barchi, Feyter, Magnani, Minelli, Pialli and Sotera1998). On this basis we consider two main velocity bodies, the Pliocene (Vp ∼ 2.6 km s−1) and the Miocene (Vp ∼ 3.5 km s−1). Thus, we use these interval velocities to estimate the depth and thickness of the sedimentary infill of the basin.
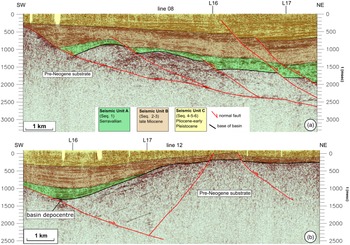
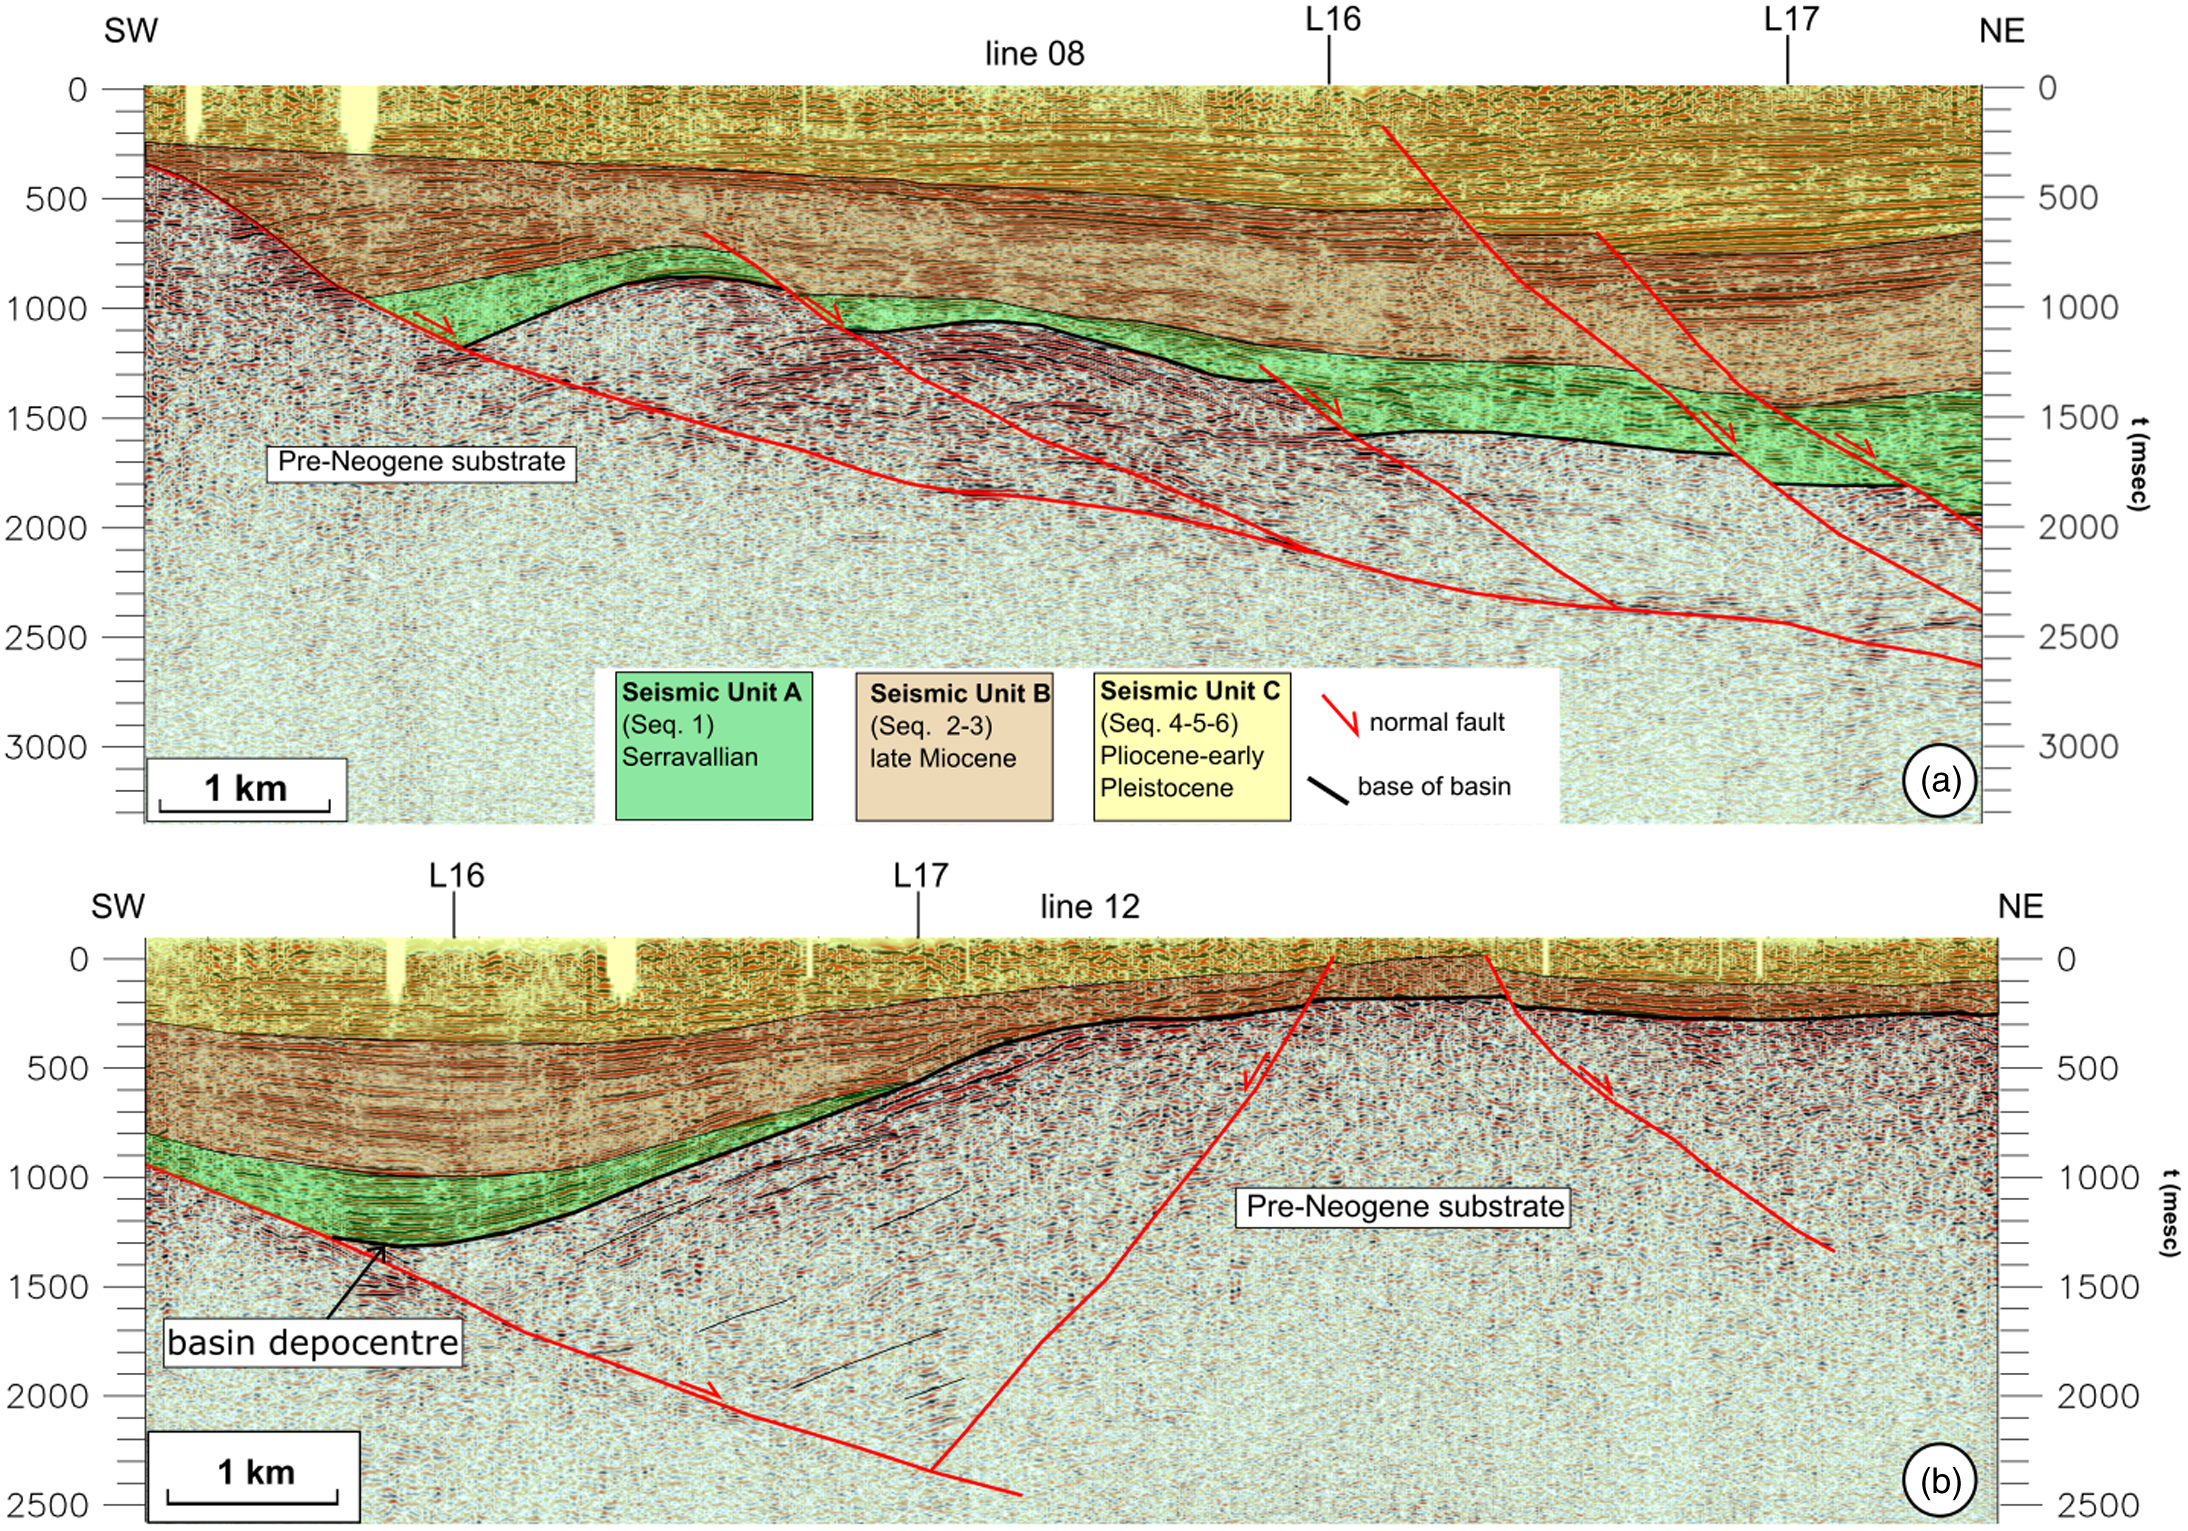
Geological interpretation of seismic lines L8 (a) and L12 (b) (see Fig. 3 for location) showing the deep geometry of the Valdelsa Neogene deposits and their relationships with the main extensional structures of the area.
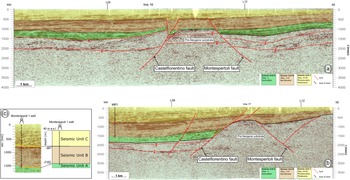
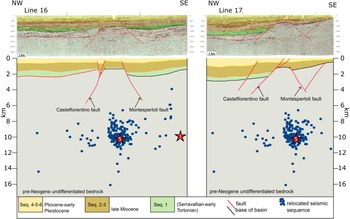
Geological interpretation of seismic lines L16 (a) and L17 (b) (see Fig. 3 for location) showing the longitudinal deep geometry of the Valdelsa Neogene deposits and their relationships with two main faults (Castelfiorentino and Montespertoli), which controlled the most recent thickness of the Valdelsa infill. The position of the intersections with seismic lines L8 and L12 (Fig. 6) is also reported. The Castelfiorentino and Montespertoli faults interrupt the depth trace of the main normal faults of seismic lines L8 and L12 post-dating them. (c) Seismic stratigraphy of the Monterappoli-1 well and association with the seismic units (SU).

We identify three main seismic units of the Valdelsa Basin (Fig. 2b), which are easy to identify in the seismic profiles and which we relate to the stratigraphic sequences described above and represented in Figure 2b. From top to bottom, these are: (i) Seismic Unit A (SU-A, Fig. 2b), corresponding to the late Serravallian, continental-to-shallow marine Seq.1 sequence (Ponsano Fm); (ii) Seismic Unit B (SU-B, Fig. 2b), including the Seq.2 and Seq.3 Tortonian–Messinian continental succession; and (iii) Seismic Unit C (SU-C, Fig. 2b), includeing Seq.4, 5, 6 and corresponding to the Pliocene marine deposits and the Gelasian continental deposits.
Based on the extrapolation of the boundaries between the seismic units along the seismic profiles and the corresponding seismic profile intersections, we were able to derive a consistent interpretation of the subsurface geological setting of the area, synthesized in two transversal SW–NE-trending seismic reflection profiles (line 8 and line 12; Fig. 7a and b) and two longitudinal NW–SE-trending profiles (line 16 and line 17; Fig. 8a and b).
The oldest seismic unit is Seismic Unit A (SU-A), which in the seismic profiles is represented by light seismic facies with a series of easily recognizable and continuous reflectors and a few higher-amplitude horizons (Fig. 8c).
The intermediate seismic unit (Seismic Unit B, SU-B) is represented by a less light and transparent seismic facies and an upper part characterized by a set of well-bedded and higher-amplitude reflectors (Fig. 8c) possibly representative of the more clayey upper Miocene lacustrine unit (Seq.3 in Fig. 2b). The uppermost seismic unit (Seismic Unit C, SU-C) is represented by an alternation of continuous high-amplitude layers and layers that are still continuous but are lighter than the underlying deposits (Fig. 8c).
The transversal profiles provide an image of the architecture of the extensional basins showing the presence of an ENE-dipping extensional detachment with associated synthetic splays and subordinate antithetic faults. The oldest unit at the normal faults hangingwall is represented by the Serravallian Seq.1, which unconformably overlies the pre-Neogene substrate (Fig. 7a). This sequence is not always present in the subsurface, as shown by line 12 (Fig. 7b) where in the central part of the section the substrate is overlaid directly by SU-B (probably only the upper Miocene lacustrine Seq.3).
The Neogene sediments reach a thickness in the order of 2 km, progressively diminishing to a few hundred metres.
The longitudinal seismic sections (Fig. 8) provide an excellent image of the lateral continuity of the Neogene deposits from NW to SE. Seismic line 16 (Fig. 8a), running SW of line 17 (Fig. 8b) and hence closer to the present-day Elsa river valley, is the longest and shows the thinning of the sequences, especially of SU-A corresponding to a pre-Neogene structural high bounded by two sub-vertical faults. The substrate structural high in the central part of the section is responsible for the thinning of the sequences, especially of SU-A, and is bounded by a NW-dipping and a SE-dipping fault, here named Castelfiorentino and Montespertoli faults, respectively. The Neogene deposits are much thicker SE of the substrate high and reach a maximum thickness in the order of 2 km.
Seismic line 17 (Fig. 8b) shows that the same pre-Neogene structural high here is higher and causes all the seismic units, especially SU-A, to thin abruptly towards the SE. The maximum thickness of all the Neogene sediments is c. 1.8 s TWT, corresponding to c. 2 km on the basis of the available information on the seismic velocities. The thickness reduces to a few hundred metres in the southeastern part of the sections.
5.c. Seismological data
We relocated the two most recent moderate earthquakes, which struck the area in 2014 and 2016, the Certaldo and Castelfiorentino earthquakes, respectively.
5.c.1. The Certaldo seismic sequence (M = 3.4; 9 August 2014)
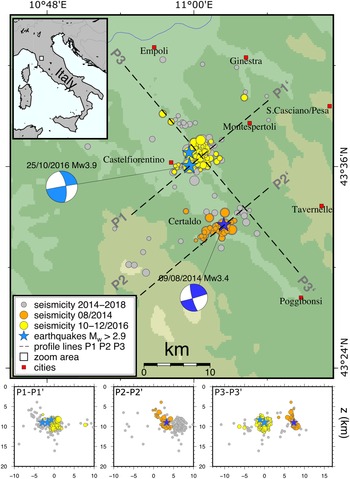
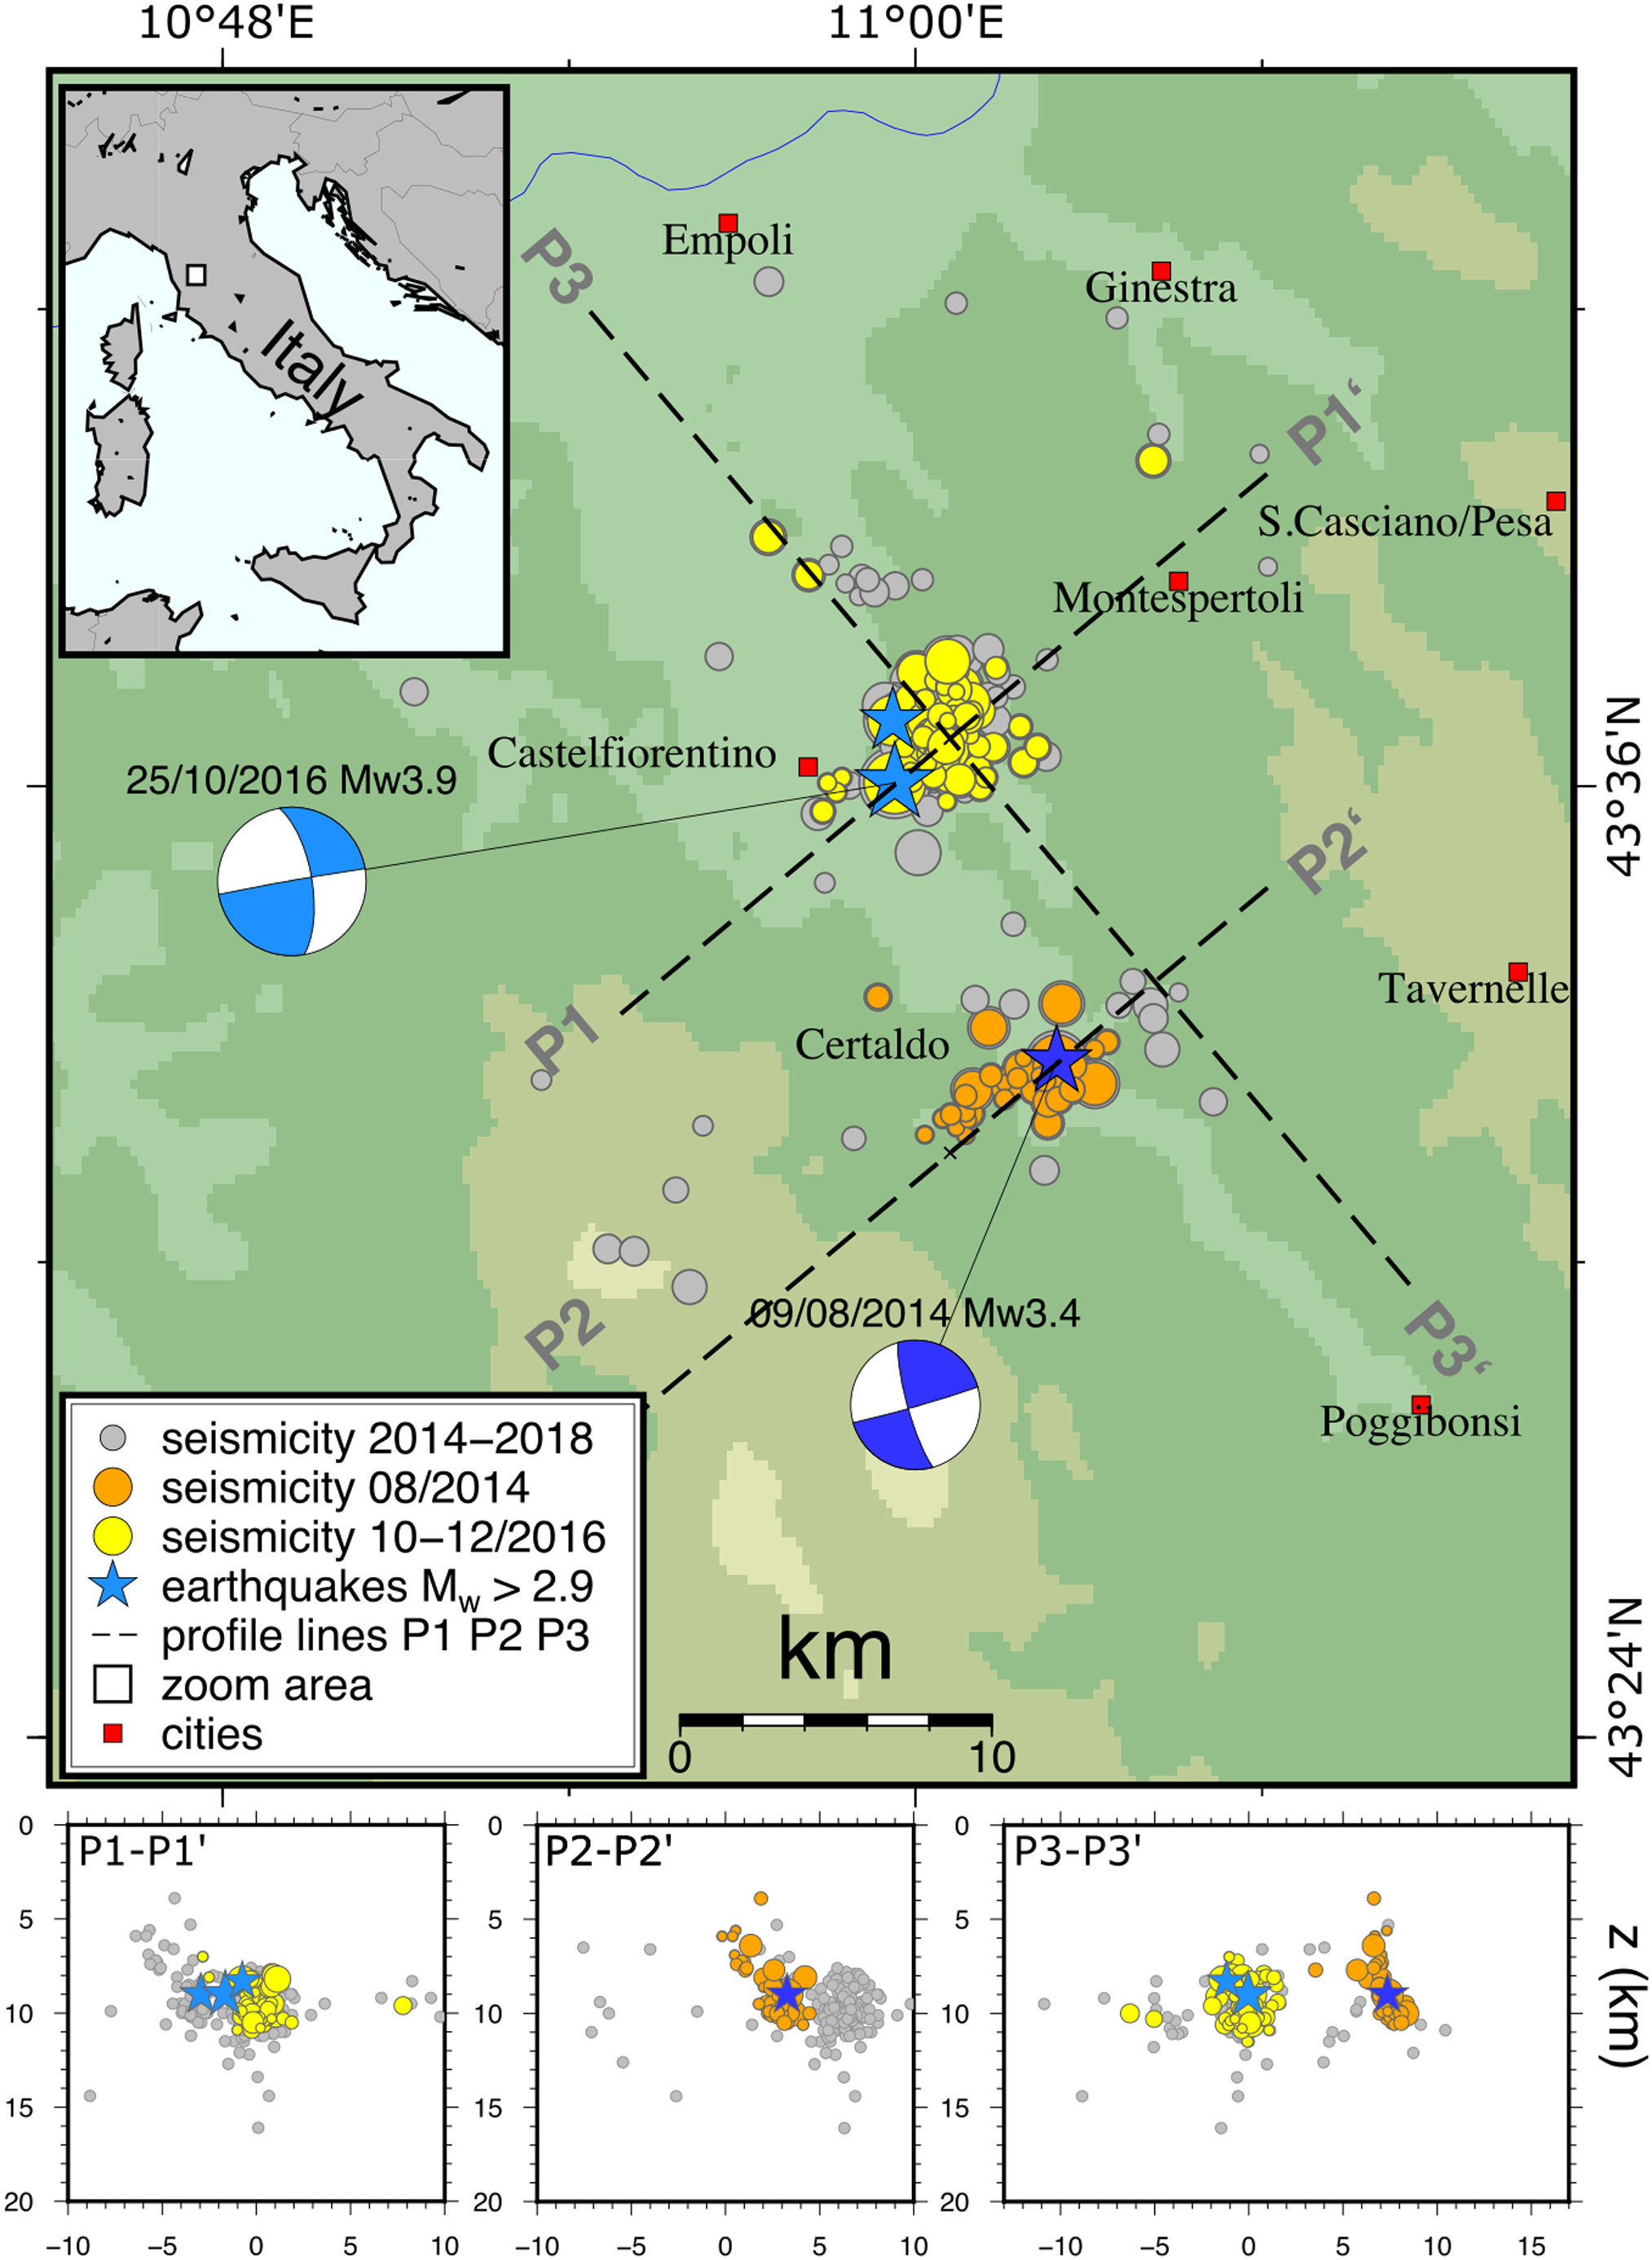
After a short foreshock sequence of 8 hours, a seismic event of M = 3.4 occurred in the central part of the Valdelsa Basin (near Certaldo; Fig. 3; Table 1) on 9 August 2014 at 13:47 UTC. The main shock was located at a depth of 9 km and was followed by a short-lived aftershock sequence of c. 40 events, which ceased after less than a week. Due to the shallow hypocentral depths of 5–10 km, about a dozen earthquakes were felt by the population. The seismic source mechanism was calculated by first-motion polarities, as well as Moment Tensor Inversion (MTI), and resulted as a pure double couple with the following parameters: strike 74°, slip 88°, rake 170° (Fig. 9).
Distribution of the 2014 Certaldo and 2016 Castelfiorentino seismic sequences relocated in this work, and the mainshock focal mechanisms showing either a dextral SW–NE-trending or a sinistral NW–SE-trending kinematics. The seismicity distribution at depth is imaged by the P1, P2 and P3 cross-sections.
5.c.2. The Castelfiorentino earthquake (M = 3.9; 25 October 2016)
Two years later, a further seismic sequence of c. 160 events shattered the NW shoulder of the Valdelsa Basin (Fig. 3). After isolated and sporadic events since January, during October 2016 the seismic activity increased significantly, culminating in the M = 3.9 main shock on 25 October 2016 at 16:53 UTC. The epicentre of the main shock was localized at Castelfiorentino, 10 km NNW with respect to the Certaldo sequence, at a hypocentral depth of 9 km. The calculation of the source mechanism, both by the inversion of first-motion polarities and by MTI, produced a result similar to that for the Certaldo main shock: strike 260°, dip 89°, slip 158°.
The two seismic sequences show striking similarities: the hypocentres of the main shock are located at c. 9 km and the fore- and aftershocks are confined to the upper crust. The source mechanisms of the main shocks are pure double couples, with a predominant strike-slip mechanism: nearly N—S- (left lateral, P3) or rather E—W-striking (right lateral P1, P2 in Fig. 3), whose active fault plane cannot be irrefutably determined (Fig. 9).
6. Results
Using the seismic velocities of the deposits, we converted to depth the two longitudinal sections and we drew two integrated geological cross-sections extrapolated down to c. 5 km depth in order to compare the subsurface geometries with the earthquake locations (Fig. 10).
Depth conversion of seismic lines L16 and L17 and projection of the relocated seismicity and mainshocks onto the depth-converted cross-sections. See text for details and data discussion.

The earthquakes are distributed at c. 10 km depth and do not show a clear planar geometry, mostly as a consequence of their low intensity and of the fact that they are not associated with a moderate or strong event during which a set of hundreds or thousands of aftershocks develop and are often aligned along planes, which can be associated with the main fault rupture (see e.g. Latorre et al. Reference Latorre, Mirabella, Chiaraluce, Trippetta and Lomax2016; Valoroso et al. Reference Valoroso, Chiaraluce, Di Stefano and Monachesi2017; Michele et al. Reference Michele, Chiaraluce, di Stefano and Waldhauser2020). Nevertheless, the relocated earthquakes plotted onto the geological section show that seismicity is located below the Castelfiorentino and Montespertoli faults at similar depth for both sequences (Certaldo 2014, M = 3.4 and Castelfiorentino 2016, M = 3.9), even if slightly shifted below the Montespertoli fault (Fig. 10).
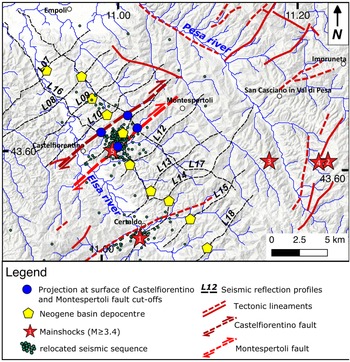
The resolution of the seismic reflection profiles does not allow offsets younger than the early Pliocene to be seen, so in order to verify the possible role of the SW–NE-striking Castelfiorentino and Montespertoli faults in controlling the Neogene basin dimension or in displacing its position, we mapped both the Neogene depocentre throughout the whole seismic lines dataset and the surface projection of the SW–NE-striking Castelfiorentino and Montespertoli faults footwall cut-offs (see Fig. 8a and b) with the substrate (the base of basin deposits).
The results are illustrated in Figure 11. The map shows the seismic lines dataset and the position of the surface projection of these two key elements. It can be observed that the faults cut-offs projection at surface depicts the Castelfiorentino and Montespertoli faults strike, which is SW–NE, about N40°.
Surface projection of the pre-Neogene substrate fault footwall cut-offs (blue circles), of the Neogene basin depocentre and the relocated seismicity. The figure shows the relationship between the distribution of seismicity, the Castelfiorentino earthquake position and dextral shift of the Neogene basin depocentre suggesting that the Montespertoli fault (thick red dotted dextral fault) was responsible for the 2016 seismic sequence. Both the Castelfiorentino and the Montespertoli fault trends agree with the other SW–NE trending of the region.

The Castelfiorentino and Montespertoli faults border a structural high (Castelfiorentino High of Benvenuti et al. Reference Benvenuti, del Conte, Scarselli and Dominici2014) constituted by the pre-Neogene substrate with a steep to sub-vertical geometry in cross-section (Fig. 10). At surface, the Certaldo and Montespertoli faults show a trend of c. N40°, similar to the strikes of the focal mechanisms of both the Certaldo and Castelfiorentino earthquakes (Fig. 9).
The position of the Neogene depocentre provides interesting points of discussion. The first thing to observe is that the present-day Elsa river is systematically shifted to the west with respect to the Neogene depocentre (Fig. 11). A similar situation was previously observed for the northeastern Quaternary basins of the Tiber river (Pucci et al. Reference Pucci, Mirabella, Pazzaglia, Barchi, Melelli and Tuccimei2014) and interpreted as due to the continuous activity of the basin-bounding normal faults, and in particular to the NE-dipping normal faults. The second observation is that the alignment of points corresponding to the position on the Neogene depocentre in the seismic profiles is not continuous along a NW–SE direction but is divided into two parts and shifted right-laterally, corresponding to the valley connecting the Elsa river and the village of Montespertoli, between seismic lines L11 and L12 (Fig. 11). This shift also corresponds to the footwall cut-offs alignment of the Montespertoli fault.
These observations indicate that: (i) the Valdelsa Basin Neogene deposition is controlled by the NW–SE-trending normal faults clearly visible in the seismic reflection profiles (Fig. 7); (ii) extension was accommodated mostly by the NE-dipping faults, which were able to progressively drag the depocentre to the NE and at the same time to maintain the Elsa river at its position, at the normal-fault hangingwall; (iii) there occurred a later deformation ascribable to a SW–NE-trending fault, which displaced the Neogene depocentre original trend. Given the above-mentioned points, we suggest that the SW–NE-striking Montespertoli fault is capable of shifting the depocentre of the basin horizontally by c. 1.2 km with right-lateral kinematics (Fig. 11). Given the fault geometry, which dips to the SE, the resulting movement would be right-lateral or slightly transtensional.
The observation of the drainage pattern distribution of the study area seems to be in agreement with a fault control on the river network. The drainage pattern is mostly oriented SE–NW and associated with the Elsa and Pesa rivers (Fig. 11). A few areas, where the rivers show a significant deviation from the dominant SE–NW trend, differ in terms of drainage orientation and display tight curves along a SW–NE direction of flow. The three most evident SW–NE alignments in the study area are along the previously mentioned Piombino–Faenza line to the south, along the Certaldo – S. Casciano Val di Pesa area and along the Castelfiorentino area (Fig. 11).
Given the seismic sequence relocation and the 2016 Castelfiorentino focal mechanism solution, we suggest that the fault, which ruptured in 2016, strikeing SW–NE with a right-lateral kinematics, corresponds to the Montespertoli fault. Similarly, we propose that the 2014 Mw = 3.4 earthquake could have activated another SW–NE-trending fault belonging to the same fault segments pertaining to the Piombino–Faenza lineament. The same fault and/or fault segments may be responsible for the other earthquakes in the area, especially for the 2015 Tavarnelle Val di Pesa, Mw = 3.7 event.
At surface, these faults are parallel to the fault segments analysed in the eastern shoulder of the basin, in the vicinity of Impruneta – San Casciano Val di Pesa (Fig. 11). Similarly, the identified faults are parallel to the ‘Piombino–Faenza’ shear zone, implying a reasonable genetic relationship between them.
7. Discussion
The widespread seismicity recorded in the SE sector of the Valdelsa Basin, with hypocentral distribution in the focal depth range from 8 to 12 km (Fig. 10), supports the existence of active NE-striking fault segments in the central-southern sector of the basin. Faults related to the seismic events were identified in the presented seismic profiles (Figs 7 and 8) and delimit a NE-trending structural high buried underneath the Pliocene sediments. These faults did not directly rupture the topographic surface, indicating that the fault segments are characterized by small offsets, as also supported by the low-magnitude seismicity. The analysed fault segments in the basin shoulder, in fact, highlight metres or decametres offsets and show mineralization on the fault planes (e.g. calcite slicken-fibres, Figs 4–6). This evidence supports a fault activity occurring at deeper structural levels, implying that the studied fault zones were progressively uplifted and exhumed after their development, hence testifying to their long-lasting activity. Nevertheless, these structures although indicating a variable kinematics through time, show dominant NE-striking strike- to oblique-slip movements, comparable to the focal mechanisms of the seismic events (Fig. 9). This supports the fact that the Certaldo and Castelfiorentino faults, along which the 2014–16 hypocentres are localized, are part of a long-lived fault system inherent to the ‘Piombino-Faenza’ shear zone. In this view, a Neogene–Quaternary activity under the same regional stress field can be envisaged to promote exhumation of the basin shoulders and the segmentation of the basin. In fact, both the NE- and NW-striking faults controlled the development of the Valdelsa Basin (Pascucci et al. Reference Pascucci, Merlini and Martini1999) as well as the whole Neogene structural depressions of the inner Northern Apennines (Martini & Sagri, Reference Martini and Sagri1993). NW-striking faults controlled the development of the structural depression while the NE-striking ones accommodated the different amount of extension (i.e. transfer zones).
The age and role of transversal lineaments in the Northern Apennines have long been discussed (e.g. Fazzini & Gelmini, Reference Fazzini and Gelmini1982; Bemporad et al. Reference Bemporad, Conedera, Dainelli, Ercoli and Facibeni1986; Liotta, Reference Liotta1991; Pascucci et al. Reference Pascucci, Martini, Sagri, Sandrelli, Nichols, Williams and Paola2007) and their impact in controlling low-magnitude earthquakes has also been highlighted for northern Tuscany (e.g. Molli et al. Reference Molli, Manighetti, Bennett, Malavieille, Serpelloni, Storti, Giampietro, Bigot, Pinelli, Giacomelli, Lucca, Angeli and Porta2021). Many of these ‘lineaments’ are ascribed to the presence of lithotypes, which react differently to erosion, as could be the case of the ‘Piombino–Faenza line’. Nevertheless, the Certaldo – S. Casciano Val di Pesa and Castelfiorentino lineaments documented here do not show any direct connection with lithology or bedding attitude and could just be related to the presence of SW–NE-trending tectonic structures, as also supported by the seismicity concentrated along their traces.
On the other hand, both NE- and NW-striking faults seem to have controlled the orientation of the main river/stream valleys in the whole basin (Fig. 3). In our case, the two NE-trending lineaments correspond to relevant NE–SW river alignments, along which geothermal manifestations are present (see Fig. 3), supporting their connection with both a tectonic origin and a crustal relevance also in controlling geothermal fluids circulation. Interestingly, a tectonic control on the river network of the same area was early recognized by Canuti et al. (Reference Canuti, Morini and Tacconi1975), though not framed into an active tectonic significance of the river anomalies.
The collected kinematics coupled with information from the focal mechanisms related to the local seismicity indicate that the two orthogonal faults acted mainly as normal faults (NW-striking) and strike-slip/oblique-slip faults (NE-striking) and this interplay accounts for an extensional evolution of the basin (Martini & Sagri, Reference Martini and Sagri1993; Pascucci et al. Reference Pascucci, Merlini and Martini1999). A different scenario was proposed by Benvenuti et al. (Reference Benvenuti, del Conte, Scarselli and Dominici2014) that, although similarly depicting the occurrence of ‘basin-transverse lineaments’ separating the Valdelsa Basin into two sub-basins, suggests that the whole basin was strictly controlled by NW-trending regional thrusts that controlled the depocentres location as well as the sedimentation. The interplay between compressional tectonics and eustatic sea-level fluctuations are invoked as dominant factors forcing the deposition of sedimentary cycles at the basin scale. In this scenario, the Valdelsa Basin is not considered an extensional basin but a thrust-top basin developed during compressional tectonics since the Late Miocene. This hypothesis is in line with those advanced by some authors (e.g. Boccaletti & Dainelli, Reference Boccaletti and Dainelli1982; Bonini & Sani, Reference Bonini and Sani2002; Finetti, Reference Finetti2006), who refer to the Neogene–Quaternary tectonic evolution of Tuscany as being strictly controlled by unceasing compressional tectonics active since the late Cretaceous and giving rise to different generations of thrusts and back-thrusts and associated thrust-top basins (e.g. Bonini et al. Reference Bonini, Boccaletti, Moratti and Sani2001; Finetti et al. Reference Finetti, Boccaletti, Bonini, Ben, Geletti, Pipan and Sani2001).
Our data contrast with the hypothesis of Benvenuti et al. (Reference Benvenuti, del Conte, Scarselli and Dominici2014) and support a different structural and kinematic scenario. The fault kinematics in the exhumed basin shoulder accounts for Neogene–Quaternary normal and strike-/oblique-slip faults. Thrusts occurrence is only suggested by the stacked units forming the orogenic pile, but these tectonic contacts, interpreted as low-angle normal faults by other authors (Carmignani et al. Reference Carmignani, Decandia, Disperati, Lazzarotto, Liotta and Meccheri1994; Liotta et al. Reference Liotta, Cernobori and Nicolic1998), are dissected by both NE- and NW-trending faults occurring at the basin scale and documented in this paper. So, in our opinion, a Neogene–Quaternary extensional evolution can better explain the setting of the Valdelsa Basin and therefore its seismotectonic framework and the overall thinned crust well documented by geophysical datasets (e.g. Pauselli et al. Reference Pauselli, Barchi, Federico, Magnani and Minelli2006). Along the same line, the reasons why the geological evolution of the Valdelsa Basin and the whole inner Northern Apennines is better framed in an extensional setting rather than a compressional one is reported in some papers (Brogi et al. Reference Brogi, Lazzarotto, Liotta and Ranalli2005; Brogi & Liotta, Reference Brogi and Liotta2008; Barchi, Reference Barchi, Beltrando, Peccerillo, Mattei, Conticelli and Doglioni)2010; Liotta & Brogi, Reference Liotta and Brogi2020; Brogi, Reference Brogi2011, Reference Brogi2020) to which the reader is addressed for a more exhaustive discussion.
The NE-striking faults, both exposed and inferred by seismological analyses (Fig. 9), are parallel to the Piombino–Faenza line regional structure (Fig. 1b), a first-order structure crossing the whole of the Northern Apennines (Ambrosetti et al. Reference Ambrosetti, Carboni, Conti, Costantini, Esu, Gandin, Girotti, Lazzarotto, Mazzanti, Nicosia, Parisi and Sandrelli1978; Boccaletti et al. Reference Boccaletti, Coli, Eva, Ferrari, Giglia, Lazzarotto, Merlanti, Nicolich, Papani and Postpischl1985) and interpreted, in the inner zone, as a kilometre-wide, crustal-scale transfer zone accommodating extension since the Late Miocene (Liotta, Reference Liotta1991; Dini et al. Reference Dini, Mazzarini, Musumeci and Rocchi2008; Liotta et al. Reference Liotta, Brogi, Meccheri, Dini, Bianco and Ruggieri2015). The geometry and kinematics of the fault segments forming this transfer zone were constrained in the Larderello geothermal area, to the southwest of the study area (Fig. 1a), where such a structure plays a fundamental role in controlling fluid flow, heat flux and magma emplacement at depth (Gola et al. Reference Gola, Bertini, Bonini, Botteghi, Brogi, De Franco, Dini, Donato, Gianelli, Liotta and Manzella2017; Liotta & Brogi, Reference Liotta and Brogi2020). Similarly to the study area, in the Larderello geothermal area the fault segments were active during the Neogene and are still active (Liotta & Brogi, Reference Liotta and Brogi2020 for a review), as indicated by the localized low-magnitude seismicity (Batini et al. Reference Batini, Console and Luongo1985; Albarello et al. Reference Albarello, Batini, Bianciardi, Ciulli, Spinelli and Viti2005; Bagagli et al. Reference Bagagli, Kissling, Piccinini and Saccorotti2020).
The kinematics of this transfer zone is the result of superimposed movements through the Neogene–Quaternary, as a consequence of the role of this structure in separating crustal sectors with different amounts of extension and differentiated uplift (Liotta & Brogi, Reference Liotta and Brogi2020). It follows that the fault segments forming the transfer zone are characterized by multiple kinematics, ranging from strike-slip to normal, also with intermediate kinematics. Similar evidences have been documented for several transfer zones in the whole of the inner Northern Apennines (e.g. Brogi et al. Reference Brogi, Fidolini and Liotta2013; Liotta et al. Reference Liotta, Brogi, Meccheri, Dini, Bianco and Ruggieri2015), producing seismicity (Buonasorte et al. Reference Buonasorte, Pandeli and Fiordelisi1991; Brogi & Fabbrini, Reference Brogi and Fabbrini2009; Brogi et al. Reference Brogi, Capezzuoli, Martini, Picozzi and Sandrelli2014; Piccardi et al. Reference Piccardi, Vittori, Blumetti, Comerci, Di Manna, Guerrieri, Baglione and D’Intinosante2017). We observe the same evidence for the NE-striking faults exposed in the study area.
This work, even though it deals with relatively small-magnitude events, evidences the importance of integrating different datasets and approaches to identify active or potentially active faults. Their recognition is fundamental in particular for those areas with a history of earthquakes but without recent events. In these areas, characterized by high vulnerability, with great exposure of human lives, infrastructure and historical heritage, the definition of such potentially active faults plays a fundamental role in the definition of seismic hazard and in the protection and conservation of historical and artistic heritage. Examples in Italy are the important cultural centres of Assisi and Norcia in the Northern Apennines, which are located close to recognized seismogenic faults and have historically suffered repeated damages due to strong earthquakes (see for instance the seismic sequences of Colfiorito in 1997–8, L’Aquila in 2009, Ferrara in 2012 and Norcia in 2016).
In the study area the city of Florence and its surroundings, a world-famous UNESCO site, was characterized by a M = 5.4 event (18 May 1895) which, despite its moderate magnitude, caused significant damage (Cioppi, Reference Cioppi1995; Guidoboni & Ferrari, Reference Guidoboni and Ferrari1995) and for which no causative fault has yet been mapped.
Our study suggests that the recognized faults could be related to NE–SW alignments potentially connected to the 1895 event, for which damage maps indicate a possible SW–NE alignment (Cioppi, Reference Cioppi1995). However, detailed and modern studies would be needed in order to understand the active tectonics indicators, which must be hidden in both surface and subsurface geological evidence for the area.
8. Conclusions
We identify a long-lived Miocene–Holocene SW–NE-trending fault system in southern Tuscany, which affects the Neogene Valdelsa Basin developed at the hangingwall of NW–SE-trending normal faults. The SW–NE-trending fault system has played the role of transfer zone since the Miocene and consists of both exhumed and blind, still active, fault segments. Through a multidisciplinary approach, integrating surface kinematic data, subsurface geophysical and geological data and the relocation of seismological data we identify a previously unknown active fault (Montespertoli faults) not reaching the topographic surface, which we interpret as responsible for the 2016 Castelfiorentino (M = 3.9) earthquake (western Northern Apennines of Italy). Despite the relatively small magnitude of the event, the Montespertoli fault is part of the much wider SW–NE-striking crustal shear zones developed across the western part of the Italian peninsula (the Livorno–Sillaro and Piombino–Faenza tectonic lineaments; Fig. 1b) that have also controlled the tectono-sedimentary evolution of the Neogene–Quaternary basins since the Middle–Upper Miocene (Bossio et al. Reference Bossio, Mazzei, Salvatorini and Sandrelli1993 a). This crustal shear zone has also controlled the emplacement of felsic magmatic intrusion since the Pliocene (Farina et al. Reference Farina, Dini, Innocenti and Rocchi2010) and still controls the seismicity and geothermal circulation in the Larderello area (Liotta & Brogi, Reference Liotta and Brogi2020), thus testifying to its seismotectonic relevance.
We suggest that the earthquake that struck the historic city of Florence in 1895 (M = 5.4) and which caused severe damage to both buildings and works of art may have been linked to the same NE-striking crustal shear zone.
Acknowledgements
We thank ENI for providing the seismic reflection profiles. We thank Giovanni Toscani and an anonymous reviewer for thoughtful and constructive reviews, and the editor Olivier Lacombe for editorial assistance.