Introduction
In their landmark account of political equality among American racial groups, Griffin and Newman (Reference Griffin and Newman2008) describe three standards of political equality: proportionality, race-conscious egalitarianism, and pluralism. The first standard, best encapsulated by the “one person, one vote” adage, states that the extent of a racial group’s political representation ought to correspond to that group’s relative size. The race-conscious egalitarian standard stipulates that racial minorities—due to their historical marginalization—merit political representation above and beyond that which corresponds to their relative sizes alone. The third, pluralist standard states that there ought to be multiple spheres of political representation in which the extent of a racial group’s representation in a particular sphere depends on its relative importance to that group.
A valuable body of research has linked racial subconstituency opinion to congressional roll call voting in order to assess how well legislators represent racial subconstituencies (Griffin and Newman, Reference Griffin and Newman2008, Reference Griffin and Newman2007; Avery and Fine, Reference Avery and Fine2012; Griffin and Flavin, Reference Griffin and Flavin2007). This paper makes the same linkage to offer descriptive evidence on how well American government meets these three standards of representation. While this approach is far from novel, the paper contributes to the existing literature by refining both the data and the analytical strategy.
On the data side, I match survey items from the Cooperative Congressional Election Study (CCES), fielded between 2006 and 2016, to subsequent roll call votes on 25 corresponding House bills voted on between 2007 and 2018. Each survey item asks respondents whether they support or oppose a specific policy proposal, which is later voted on in Congress, allowing for direct comparison between public opinion and legislative behavior. On the analysis side, I apply multilevel regression and poststratification (MRP) to estimate the opinions of racial subgroups and evaluate how closely House members’ votes align with the opinions of racial subconstituencies.
The data construction extends existing work because the CCES items capture support or opposition to specific bills using the same (“Yea” or “Nay”) scale as roll call votes, thereby avoiding longstanding scaling issues (Miller, Reference Miller, Allardt and Littunen1964; Achen, Reference Achen1978; Burden, Reference Burden2004; Powell, Reference Powell1982; Powell, Reference Powell1989; Wright, Reference Wright1978) that complicate efforts to link racial subgroup opinion to legislative behavior (Griffin and Newman, Reference Griffin and Newman2008, Reference Griffin and Newman2007; Griffin and Flavin, Reference Griffin and Flavin2007). By matching opinion and votes on the same bills, this dataset also avoids the “False Substitutes Problem” (Lax et al., Reference Lax, Phillips and Zelizer2019, p. 921) in which aggregate ideology indices can obscure variation across issue areas. For example, if Latinos grow more liberal on immigration but not abortion, and legislators shift left on abortion but not immigration, an aggregate ideological index may give the false impression of legislators’ increased alignment with Latino constituents. This paper’s policy-specific measures avoid this problem and allow for a clearer test of the pluralist standard of racial equality, wherein certain bills may hold greater importance for specific racial groups.
The analysis strategy contributes to existing research by addressing concerns about public opinion at subnational levels for which, as Hajnal (Reference Hajnal2009, p. 40) writes, “we rarely have good measures of minority views.” When samples of constituents are broken down by racial group, minority constituents are often too scarce to yield informative public opinion estimates (Bhatti and Erikson, Reference Bhatti and Erikson2011). MRP helps overcome this limitation by (1) pooling information across subconstituencies, where the extent of pooling is inversely related to the information each subconstituency contains (i.e., its sample size and variability in survey responses) and (2) propagating uncertainty in public opinion estimates through subsequent stages of analysis (Treier and Jackman, Reference Treier and Jackman2008; Tanner, Reference Tanner1996) so that measures of representation incorporate the fact that opinion estimates of some racial subconstituencies are less informative than others.
With these refinements in data and analysis, I estimate not the alignment between racial groups’ opinions and policy or election outcomes (e.g., Griffin et al., Reference Griffin, Hajnal, Newman and Searle2019; Hajnal, Reference Hajnal2009), but rather the alignment between racial groups’ opinions in congressional districts and elected officials’ roll call voting. This focus on what might be called “dyadic” as opposed to “collective” representation (Weissberg, Reference Weissberg1978) grounds the question of representation within a principal-agent conception of democracy wherein the “agents” are elected officials and the “principals” are the citizenry (Fearon, Reference Fearon, Adam Przeworski and Manin1999). I focus in particular on the House of Representatives because, as James Madison argued in Federalist No. 52, the House ought to have the most “immediate dependence” on “the people” (a dependence the Founders sought to engineer by House districts’ biennial elections). In other words, the House is the institutional setting most directly tied to whether legislators (“principals”) represent the preferences of citizens (“agents”) of different racial groups.
To be sure, alignment between public opinion and policy or election outcomes is arguably the most straightforward measure of whether racial groups “get what they want from government” (Gilens, Reference Gilens2012, p. 66). This paper’s principal-agent framework complements that approach by helping to explain why policy outcomes may or may not reflect group preferences. For example, if Black constituents’ opinions align with their representatives’ roll call votes but not with final policy outcomes, then institutional factors—such as racial gerrymandering—may be to blame, rather than a lack of legislative representation. Conversely, if Black constituents’ opinions diverge from both roll call voting and policy outcomes, the problem may lie in the quality of representation itself. Therefore, my focus on the relationship between House members and their constituents’ opinions is a key piece to the broader puzzle of whether racial minorities get what they want from government.
My findings provide descriptive evidence for the proportionality standard of political equality, as opposed to that of race-conscious egalitarianism. Across nearly all bills, when the median White and Black opinions within districts differ, an (often vast) majority of legislators vote in alignment with their White constituents. The same is true for White versus Latino constituents, although the disparity is less stark. For both Black and Latino constituents, I find far greater representation (each relative to White constituents) across nearly all bills in majority–minority districts compared to Black and Latino representation in White-majority districts. Existing research finds limited support for the proportionality standard when racial minorities are large but not a majority (Griffin and Newman, Reference Griffin and Newman2008, Reference Griffin and Newman2007; Avery and Fine, Reference Avery and Fine2012); my findings complement this work by showing evidence for the proportionality standard when racial minorities reach majority status.
Despite the aforementioned evidence in favor of the proportionality relative to the race-conscious egalitarian standard, I do find evidence in favor of the latter relative to the former among only Democratic legislators. I also find evidence consistent with the pluralist standard of political equality: A majority of districts vote in alignment with Black and Latino (relative to White) opinions on bills concerning the explicitly race-targeted issues of affirmative action and border patrols. Nevertheless, this level of representation does not extend to bills that, while not explicitly race-targeted, may have become racialized (e.g., the Affordable Care Act, also known as “Obamacare”).
The remainder of this paper proceeds as follows. I begin by reviewing existing theories of unequal representation, drawing on the commonly invoked distinction between “congruence” and “responsiveness” to justify this paper’s conceptualization of representation. I then introduce the data and methods for estimating racial subgroups’ opinions at the subnational level before presenting public opinion estimates by racial subgroups across all of the aforementioned bills that were preceded by corresponding CCES survey items. In the following section, I estimate the alignment between legislative voting and racial subgroups’ median opinions and then also do so among districts in which median White and minority opinions differ. I also conduct these analyses within subgroups stratified by majority–minority district status and legislators’ partisanship. I then interpret my findings in light of the three standards of political equality: proportionality, race-conscious egalitarianism, and pluralism. The final section concludes and points to open questions for further research.
Theories of Unequal Representation
At least since Miller and Stokes (Reference Miller and Stokes1963), political scientists have studied the link between public opinion and both the behavior of elected officials and the content of public policy. These studies have been conducted at the national (Page and Shapiro, Reference Page and Shapiro1983) and state (Erikson et al., Reference Erikson, Wright and McIver1993; Lax and Phillips, Reference Lax and Phillips2012) levels, and have also looked at specific policy issues (Backstrom, Reference Backstrom1977; Bartels, Reference Bartels1991; Arceneaux, Reference Arceneaux2002; Agnone, Reference Agnone2007). Most of these studies find an association between what constituents want from government and what their representatives do while in office, especially when it comes to salient issues.
In subsequent years, some argue that the level of representation has declined (Shapiro, Reference Shapiro2011). There is growing concern that representation has become more unequal as economic inequality in the United States has risen. Gilens (Reference Gilens2012), for example, finds that the relationship between preferences and policy outcomes is stronger for higher-income Americans. When there is an association between the views of lower-income citizens (over a range of issues) and policy, it is usually in cases in which the views of the poor happen to coincide with those of the affluent (Enns, Reference Enns2015). Similarly, Bartels (Reference Bartels2008, 5) finds that “the opinions of millions of ordinary citizens in the bottom third of the income distribution have no discernible impact on the behavior of their elected representatives.” By the same token, Ellis (Reference Ellis2017) finds that the more affluent members of the public receive better policy representation because they are closer in ideology to their representatives in Congress.
Recent research has shown that unequal responsiveness is not simply an issue of the haves versus the have-nots. Warshaw (Reference Warshaw2012) finds that lawmakers are more responsive to their copartisans when they cast their roll call votes in Congress. In their study of confirmation voting on Supreme Court nominations, Kastellec et al. (Reference Kastellec, Lax, Malecki and Phillips2015) find that the opinion of legislators’ copartisans matters more than the opinion of the median voter. This line of research also suggests that Democrats and Republicans respond to opinion differently, with Republicans being more likely to privilege the preferences of their copartisans (Warshaw, Reference Warshaw2012). Lax et al. (Reference Lax, Phillips and Zelizer2019) draw similar conclusions when they simultaneously assess class and partisan biases in representation. They find that affluent influence is contingent on partisanship and conclude that “Republican partisanship is the key to understanding modern affluent influence” (Lax et al., Reference Lax, Phillips and Zelizer2019, p. 936).
Building on the research about class and partisan biases in representation, there is evidence that race is also an important factor. Griffin and Newman (Reference Griffin and Newman2008) show that White Americans’ preferences carry more weight in legislators’ voting decisions in Congress, as well as in the ultimate content of public policy. Likewise, Hajnal (Reference Hajnal2009) shows that Black Americans are more likely than other racial groups to wind up voting for a losing political candidate. In a similar fashion to the work of Lax et al. (Reference Lax, Phillips and Zelizer2019), Griffin et al. (Reference Griffin, Hajnal, Newman and Searle2019) examine the relative contributions of race and class to government responsiveness. They examine the relationship between spending preferences and actual federal spending across a dozen issue areas, finding that race more consistently shapes government responsiveness than class, with Black constituents being the most consistently disadvantaged. The authors note that “race has the largest single impact on who government responds to. The effect of race on government responsiveness is more than twice the effect of income” (Griffin et al., Reference Griffin, Hajnal, Newman and Searle2019, p. 375).
This literature, which assesses representation along class, partisan, and racial lines, distinguishes between responsiveness and congruence. The former is usually defined in causal terms (Beyer and Hänni, Reference Beyer and Hänni2018) at the level of individual legislators. That is, an individual legislator is responsive when that legislator’s voting would change depending on the racial subconstituency’s opinion (holding the opinions of other racial groups constant). On the other hand, congruence is typically defined as “whether the sub-group median actually gets the vote that it desires from its [representative]” (Lax et al., Reference Lax, Phillips and Zelizer2019, p. 928). Beyer and Hänni (Reference Beyer and Hänni2018) among others argue that only responsiveness is a causal concept, while congruence is a necessary but insufficient condition for responsiveness.
The conception of representation I adopt in this paper does not fit neatly within either the congruence or responsiveness frameworks. My interest lies not only in “whether the sub-group median actually gets the vote that it desires from its [representative]” (Lax et al., Reference Lax, Phillips and Zelizer2019, p. 928), but also in whether the representative’s vote would change to align with a shift in the sub-group median. Hence, alignment between a sub-group’s median opinion and a legislator’s vote is a necessary but insufficient condition for the causal conception of representation I examine in this paper.
Providing evidence consistent with this causal conception of representation does not require statistically adjusting for public opinion along income or partisanship lines (Gilens, Reference Gilens2012; Lax et al., Reference Lax, Phillips and Zelizer2019; Kastellec et al., Reference Kastellec, Lax, Malecki and Phillips2015; Griffin et al., Reference Griffin, Hajnal, Newman and Searle2019) given the substantial overlap between race, class, and partisanship among constituents. Differences in the likelihood of being poor rather than rich or Democratic rather than Republican are integral to what it means to be racialized in the United States. Black Americans and Democrats or Black Americans and the working class are not disjoint sets. As a result, a meaningful shift in Black or Latino public opinion (holding White opinion constant) would also imply a corresponding shift in the opinions of working-class or Democratic constituents. Therefore, even if a legislator is responsive only to, say, copartisan preferences, a change in minority opinion (independent of White opinion) could still exert a causal effect on the legislator’s vote.
Studying the Opinion-Vote Link at the Subnational Level
In order to explore the relationship between subconstituency opinion (the independent variable) and roll call voting in the U.S. House of Representatives (the dependent variable), I match survey questions during a ten-year period (2006–2016) in the CCES to House bills. This results in 75 unique opinion-vote dyads of which I select 25 in which opinion measures occur before voting. All 25 of these bills and corresponding CCES survey items are in the Appendix. These bill-survey dyads span more than ten issue areas covered by the CCES: immigration, LGBTQ+ rights, foreign policy, affirmative action, financial/fiscal policy, stem cell research, health care, education, environmental protection, reproductive rights (including abortion), gun control, and transportation.
As noted in the introduction, I use roll call votes as the dependent variable rather than policy outcomes because alignment between group opinion and outcomes can occur even without legislators voting in line with their own constituents. There are three additional reasons for this choice. First, legislative decisions—including agenda-setting—are a core aspect of representation. Second, floor votes are highly visible to voters and thus where legislators are most likely to respond to constituent preferences. Third, pairing survey items about real-world bills with votes on those same bills ensures the independent and dependent variables are measured on the same scale, thereby avoiding the issue in existing studies of comparing public opinion and legislative voting across mismatched scales (Miller, Reference Miller, Allardt and Littunen1964; Achen, Reference Achen1978; Burden, Reference Burden2004; Powell, Reference Powell1982; Powell, Reference Powell1989; Wright, Reference Wright1978; Griffin and Newman, Reference Griffin and Newman2008; Griffin and Newman, Reference Griffin and Newman2007; Griffin and Flavin, Reference Griffin and Flavin2007).
Within my focus on roll call voting, the decision to analyze only 25 of the 75 total bills is intentional. Insofar as the results in this paper are to be consistent with a causal relationship between racial subconstituency opinion and roll call voting, then opinion must be measured before voting (Shapiro, Reference Shapiro2011), especially since prior research indicates that legislative voting can also shape public opinion (Hill and Hurley, Reference Hill and Hurley1999; Hurley and Hill, Reference Hurley and Hill2003). This concern is similarly acknowledged in studies using aggregate ideological indices: “[W]e try to limit the possibility of reciprocal effects by utilizing W-NOMINATE scores from the 107th Congress, which immediately followed the NAES” (Griffin and Newman, Reference Griffin and Newman2007, p. 1036), where the former is a measure of legislative voting and the latter a measure of public opinion.
Limiting the analysis to bills that satisfy the required temporal ordering raises concerns about generalizability. The included bills span a wide range of issues, namely, immigration, foreign policy, affirmative action, financial/fiscal policy, stem cell research, health care, environmental protection, reproductive rights (including abortion), and gun control. Notable absences are LGBTQ+ rights and education. Moreover, even within the included issue areas, coverage is incomplete, with some relevant bills excluded.
One response to these limitations would be to rely on aggregate ideological indices that summarize voting and opinion across a broader set of issues. However, the use of policy-specific survey items, as opposed to an aggregate ideological index, is also intentional. As I explained in this paper’s introduction, aggregate ideological indices suffer from the “False Substitutes Problem” (Lax et al., Reference Lax, Phillips and Zelizer2019, p. 921), which can obscure the extent of representation. For example, if Latino constituents shift left on immigration but not abortion, while a legislator shifts left on abortion but not immigration, an ideological index would falsely indicate improved representation. Moreover, aggregate indices hinder evaluations of the pluralist standard of political equality, where representation on specific bills—particularly those that are or are not race-targeted—is what matters.
Estimating District-Level Opinion
Having selected the 25 relevant opinion-vote dyads, I then estimate public opinion of racial groups within districts via the MRP approach developed by Gelman and Little (Reference Gelman and Little1997) and Park et al. (Reference Park, Gelman and Bafumi2006). As explained by Warshaw and Rodden (Reference Warshaw and Rodden2012, 203), MRP incorporates demographic and geographic information to improve survey-based estimates of each geographic unit’s public opinion on individual issues. First, the model incorporates both demographic and geographic information to partially pool data across districts. Next, predictions are made for each demographic-geographic respondent type. Finally, these predictions are poststratified (weighted) using Census data.
One important advantage of MRP that Warshaw and Rodden (Reference Warshaw and Rodden2012) highlight is that it produces reliable estimates of congressional districts’ public opinion even from a single national sample of just 2,500 people. I use every available year of the CCES (2006 – 2016), which has a national sample of over 50,000 respondents.
The first stage of MRP involves modeling individual survey responses as a function of demographic and geographic predictors. For this step, I use the CCES (
 $$N \approx 50,000 + $$
) for each even year between 2006 and 2016. These surveys contain not only questions about general political attitudes and demographic factors but also about the congressional districts in which respondents live, as well as their opinions on specific and timely congressional bills. After gathering all the policy-specific survey items (see Section B in the online supplement), I then match these with corresponding House bills. The result is an original dataset of 75 opinion-bill pairs.
Using these data, I then estimate individuals’ preferences as a function of their demographic profiles (race, age, education, gender, income, and partisanship)Footnote 1 and congressional districts. This approach allows individual-level demographic factors and geography to contribute to our understanding of district ideology (Warshaw and Rodden, Reference Warshaw and Rodden2012). The district effects, in turn, are modeled as a function of the district’s median income, the percentage of people in each district that are military veterans, the percentage of households that speak a language other than English at home, and the percentage of same-sex households in each district.
The second stage is poststratification, which entails weighting the estimates for each demographic-geographic respondent type by the percentage of each type in the actual district populations. This adds up to the percentage of respondents within each district who have a particular position. There are 435 districts with 360 demographic types in each—ranging from White-male-less than high school-low income-age 18-29 to Latino-female-graduate degree-high income-age 65+—which yields 156,600 possible combinations of demographic and district values. For each cell I calculate the relevant population frequency, and then use this frequency to weigh the prediction in each cell. Since the Census Factfinder only includes data breakdowns by race, gender, and education, I use population frequencies from Public Use Micro Data Samples (PUMS) to also account for age. These PUMS-level frequencies are also supplied by the Census Bureau; I convert them to congressional districts using the Missouri Census Data Center’s Geographic Correspondence Engine (geocorr2k) (Krimmel et al., Reference Krimmel, Lax and Phillips2016). For more details, see the Appendix.
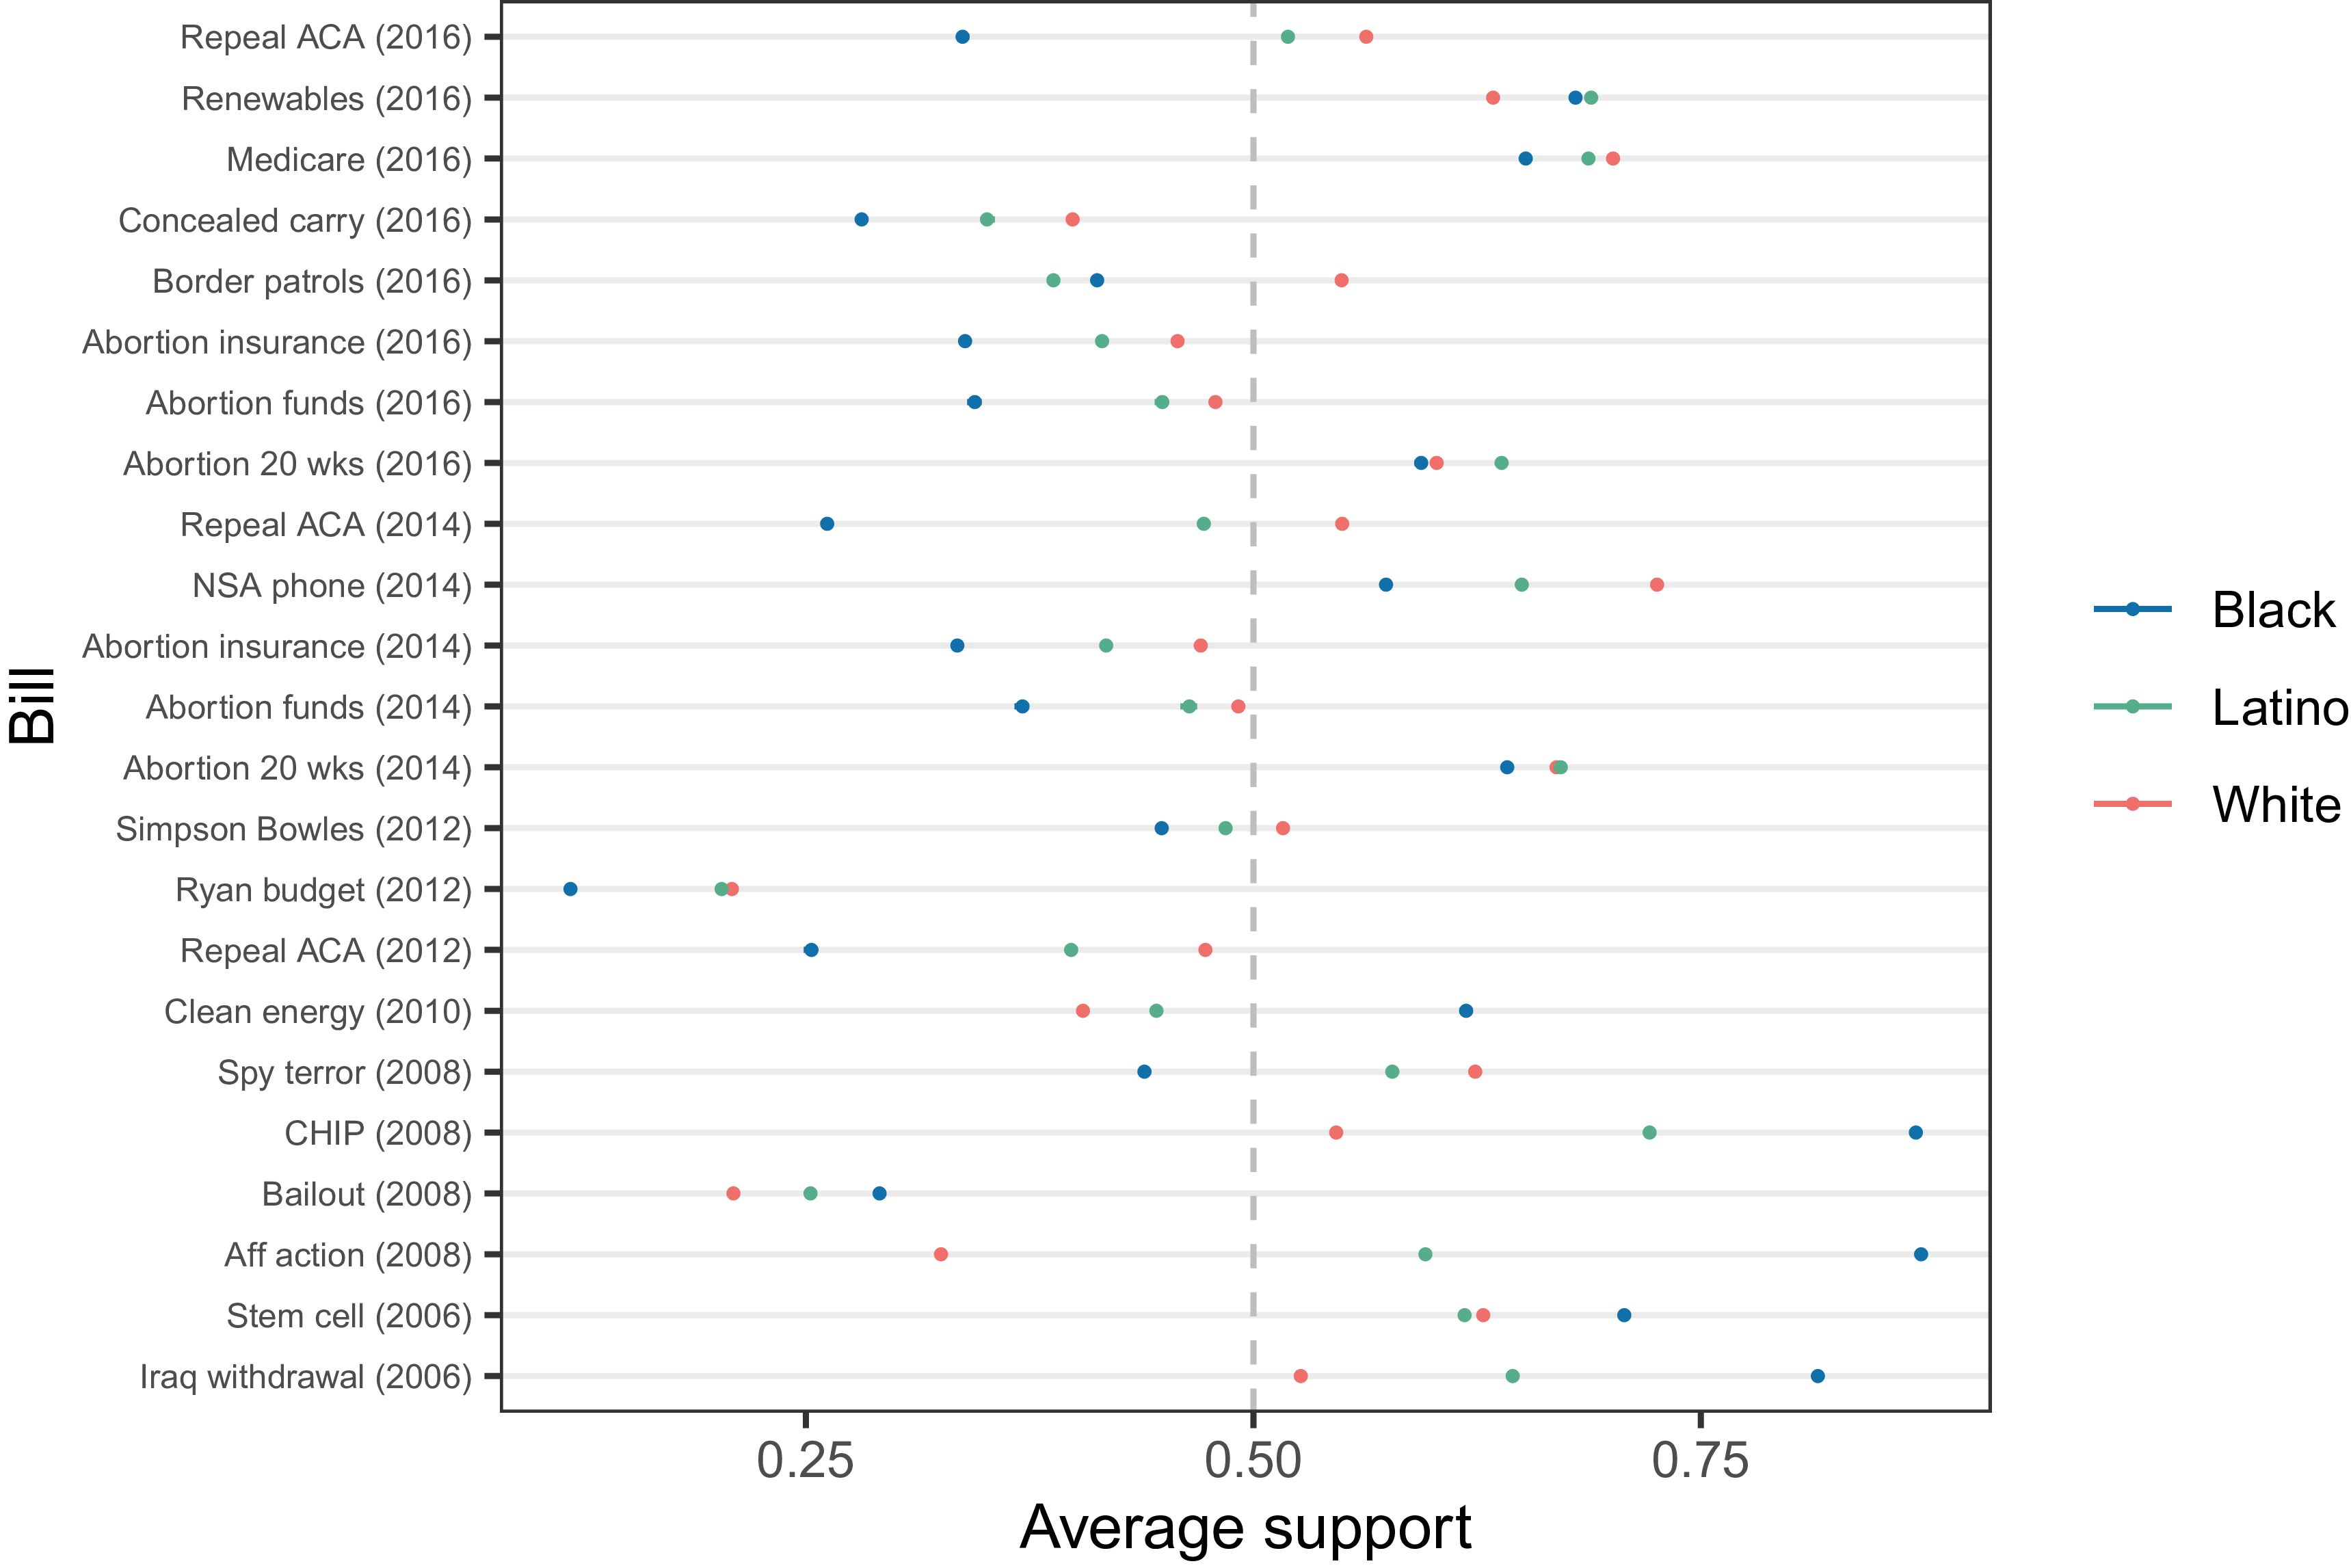
Ultimately, the MRP method yields an independent variable that describes the proportion of White, Black, and Latino constituents in each congressional district that favor each of the 44 unique policy changes. Figure 1 shows average support for the 25 bills that meet the temporal criterion of opinion measured before voting. The district-level mean support for a racial group is averaged across districts, weighting each district by that group’s population share. Note that uncertainty in this public opinion estimate aggregated over all districts is quite low, as one would expect. However, uncertainty of racial subgroup opinion within each district would be far greater.
Racial groups’ average support for selected bills in the U.S. House (2006–2016). Each point shows the estimated mean level of support among Black, Latino, and White respondents for a given bill, based on CCES survey data fielded prior to each vote. Bills are ordered chronologically by year.

The discrepancies in policy preferences between White and Black constituents and between Black and Latino constituents are larger across the board than the discrepancies between White and Latino constituents. The results in Figure 1 are consistent with previous studies on racial differences in opinion. Abrajano and Poole (Reference Abrajano and Poole2011), for instance, find that Latino and White respondents are closely aligned in their preferences regarding the role of government in society, whereas Black respondents’ preferences on the same topic are markedly different. African-Americans as a group are more internally homogeneous in terms of their policy preferences and consistently fall to the left of Whites and Latinos on the ideological spectrum (Dawson, Reference Dawson1995).
Whom Do Legislators Represent?
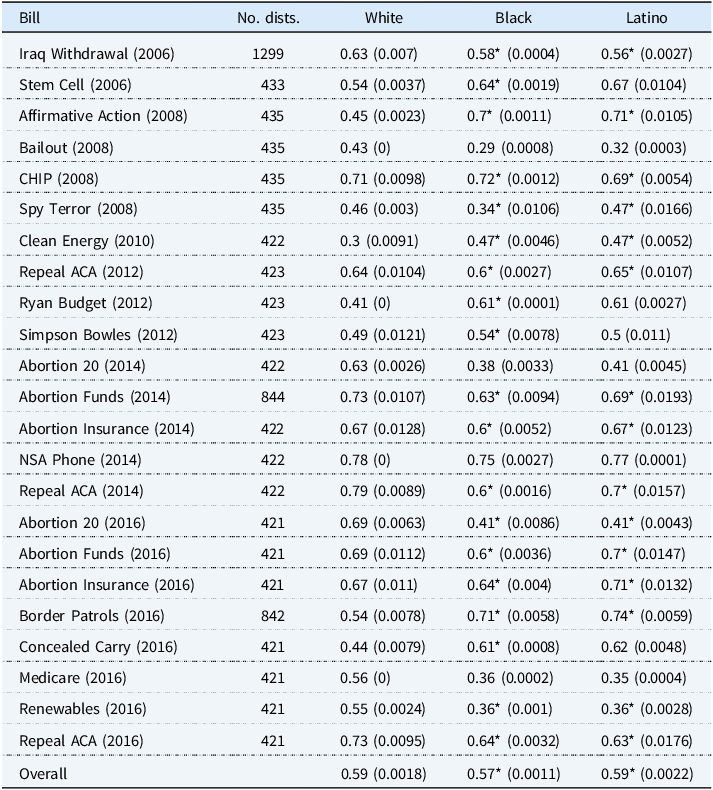
To assess the three standard of representation, I now present evidence showing the extent to which legislators’ votes align with the median opinions of different racial subconstituencies (White, Black, and Latino constituents). In particular, Table 1 displays the proportion of congressional districts in which the representative’s vote aligns with its subconstituency median. The standard errors of each estimate (for each racial subgroup and bill) reflect uncertainty in the estimation of public opinion. The actual voting of legislators is fixed, independent of uncertainty in the measurement of public opinion. More specifically, under each draw from the posterior distribution of average support for each racial group in each district, I calculate the proportion of districts in which the House member’s vote aligns with the median preference of each racial subconstituency. Repeating this procedure over many draws from the posterior distribution results in a distribution over the proportion of congressional districts in which the representative’s vote aligns with its subconstituency median.
Proportion of congressional districts in which the legislator’s vote aligns with the median opinion of each racial subgroup; standard errors are in parentheses. Estimates for White, Black, and Latino respondents are computed as weighted averages across districts, where each district is weighted by the proportion of the national subgroup population residing in that district. The “No. dists.” column gives the number of districts per bill. Most bills include no more than 435 districts, but values may exceed this when multiple post-survey roll call votes were matched to the same CCES survey and analyzed separately; examples include Iraq Withdrawal (2006), Abortion Funds (2014), and Border Patrols (2016). The final row reports overall estimates across all bills, where the average for each posterior draw is computed by weighting each bill-specific draw according to the proportion of districts analyzed for that bill. Superscript asterisks (*), shown only for the Black and Latino columns, indicate that the weighted difference from the corresponding White estimate is statistically significant at the 0.05 level, based on whether the 2.5% and 97.5% empirical quantiles of the posterior distribution for the difference exclude zero

Table 1 Long description
A table comparing the proportion of congressional districts where legislators' votes align with the median opinions of White, Black, and Latino constituents across various bills. The table has 20 rows and 5 columns. Column headers are Bill, No. dists., White, Black, and Latino. Row labels include bills from 2006 to 2016. Each row lists the proportion of districts aligning with each racial subgroup's median opinion, with standard errors in parentheses. Notable trends include variations in alignment proportions across different bills and racial subgroups, with some values marked with asterisks indicating statistically significant differences from the White estimate.
Uncertainty about whether voting aligns with the median subconstituency opinion is typically low, even when uncertainty in average support is high. This is because median support is fixed at 1 when average support is in
 $$\left[ {0.5,1} \right]$$
and at 0 when average support is in
 $$\left[ {0,0.5} \right)$$
. For example, even if average support among Black subconstituents in a district is highly uncertain—ranging from, say, 0.6 to 0.8—the median Black constituent is still certain to support the bill. Uncertainty about the median arises only when average support straddles the 0.5 threshold. In practice, average support among White, Black, and Latino constituents typically falls clearly above or below 0.5, minimizing such uncertainty about the median.
As Table 1 shows, on many bills, House members’ alignment with the median White constituent is only slightly higher than with the median Black or median Latino constituent. Averaged across all bills, alignment is 0.59 for White constituents and 0.57 for Black constituents. The White-Latino gap is even smaller: Average alignment with Latino constituents is also 0.59, marginally lower than for White constituents when not rounded. Although the White-Latino difference is smaller in substantive terms than the White-Black difference, both differences are statistically significant.
Taking Sides: When Racial Subconstituencies Disagree
As alluded to above, the relatively small average discrepancies along racial lines may be a result of “coincidental representation.” For example, suppose a House member of a district with a small Black population votes in alignment with the median Black constituent. If the median Black constituent has the same opinion as the median White constituent, then it is unclear if this alignment is consistent with the proportionality standard (voting in alignment with the majority White opinion) or the race-conscious egalitarian standard. Adjudicating between these two standards is possible when legislators are forced to “take sides” (Lax et al., Reference Lax, Phillips and Zelizer2019); i.e., they cannot simultaneously represent the median opinions of White and Black or White and Latino subconstituencies.
Conducting this “taking sides” analysis requires focusing on districts where the median opinions of White constituents differ from those of Black or Latino constituents. This raises concerns about generalizability, as such districts may be rare or unrepresentative of where most constituents live. Thus, before continuing with the analysis, the subsection below describes how these districts differ from those where median opinions align.
District Characteristics by Racial Subconstituency Agreement
Depending on the bill, districts in which Black and White median opinions differ make up as much as 96% of all districts (Affirmative Action, 2008) or as little as a quarter of a percent (Bailout, 2008). These percentages for each bill are unsurprising given that Affirmative Action is widely supported by Black, but not White Americans, while the 2008 bailout had exceedingly low support across all racial groups. Across all bills, the average number of districts in which Black and White median opinions disagree is roughly 171, relative to an average of 499 total. Hence, districts in which median opinions differ make up over a third of all districts. In terms of how many Black Americans reside in districts where median opinions between White and Black constituents differ, the percentage, averaged across all bills, is 33%. The percentage of Black Americans who live in districts in which the median opinions differ on at least one bill is nearly 70%.
There are fewer districts in which Latino and White median opinions disagree. Like in the Black vs. White comparison, only a quarter of a percent of districts are those in which White and Latino constituents disagree in support for the 2008 Bailout. The bill in which the greatest proportion of districts has differing opinions (nearly 70%) are border patrol bills, another unsurprising result given majority support for these bills among White Americans overall, but little support among Latino constituents. Averaged over all bills, 25% of the Latino population resides in districts in which White and Latino median opinions differ; roughly 63% of Latino constituents live in districts in which median opinions differ on at least one bill.
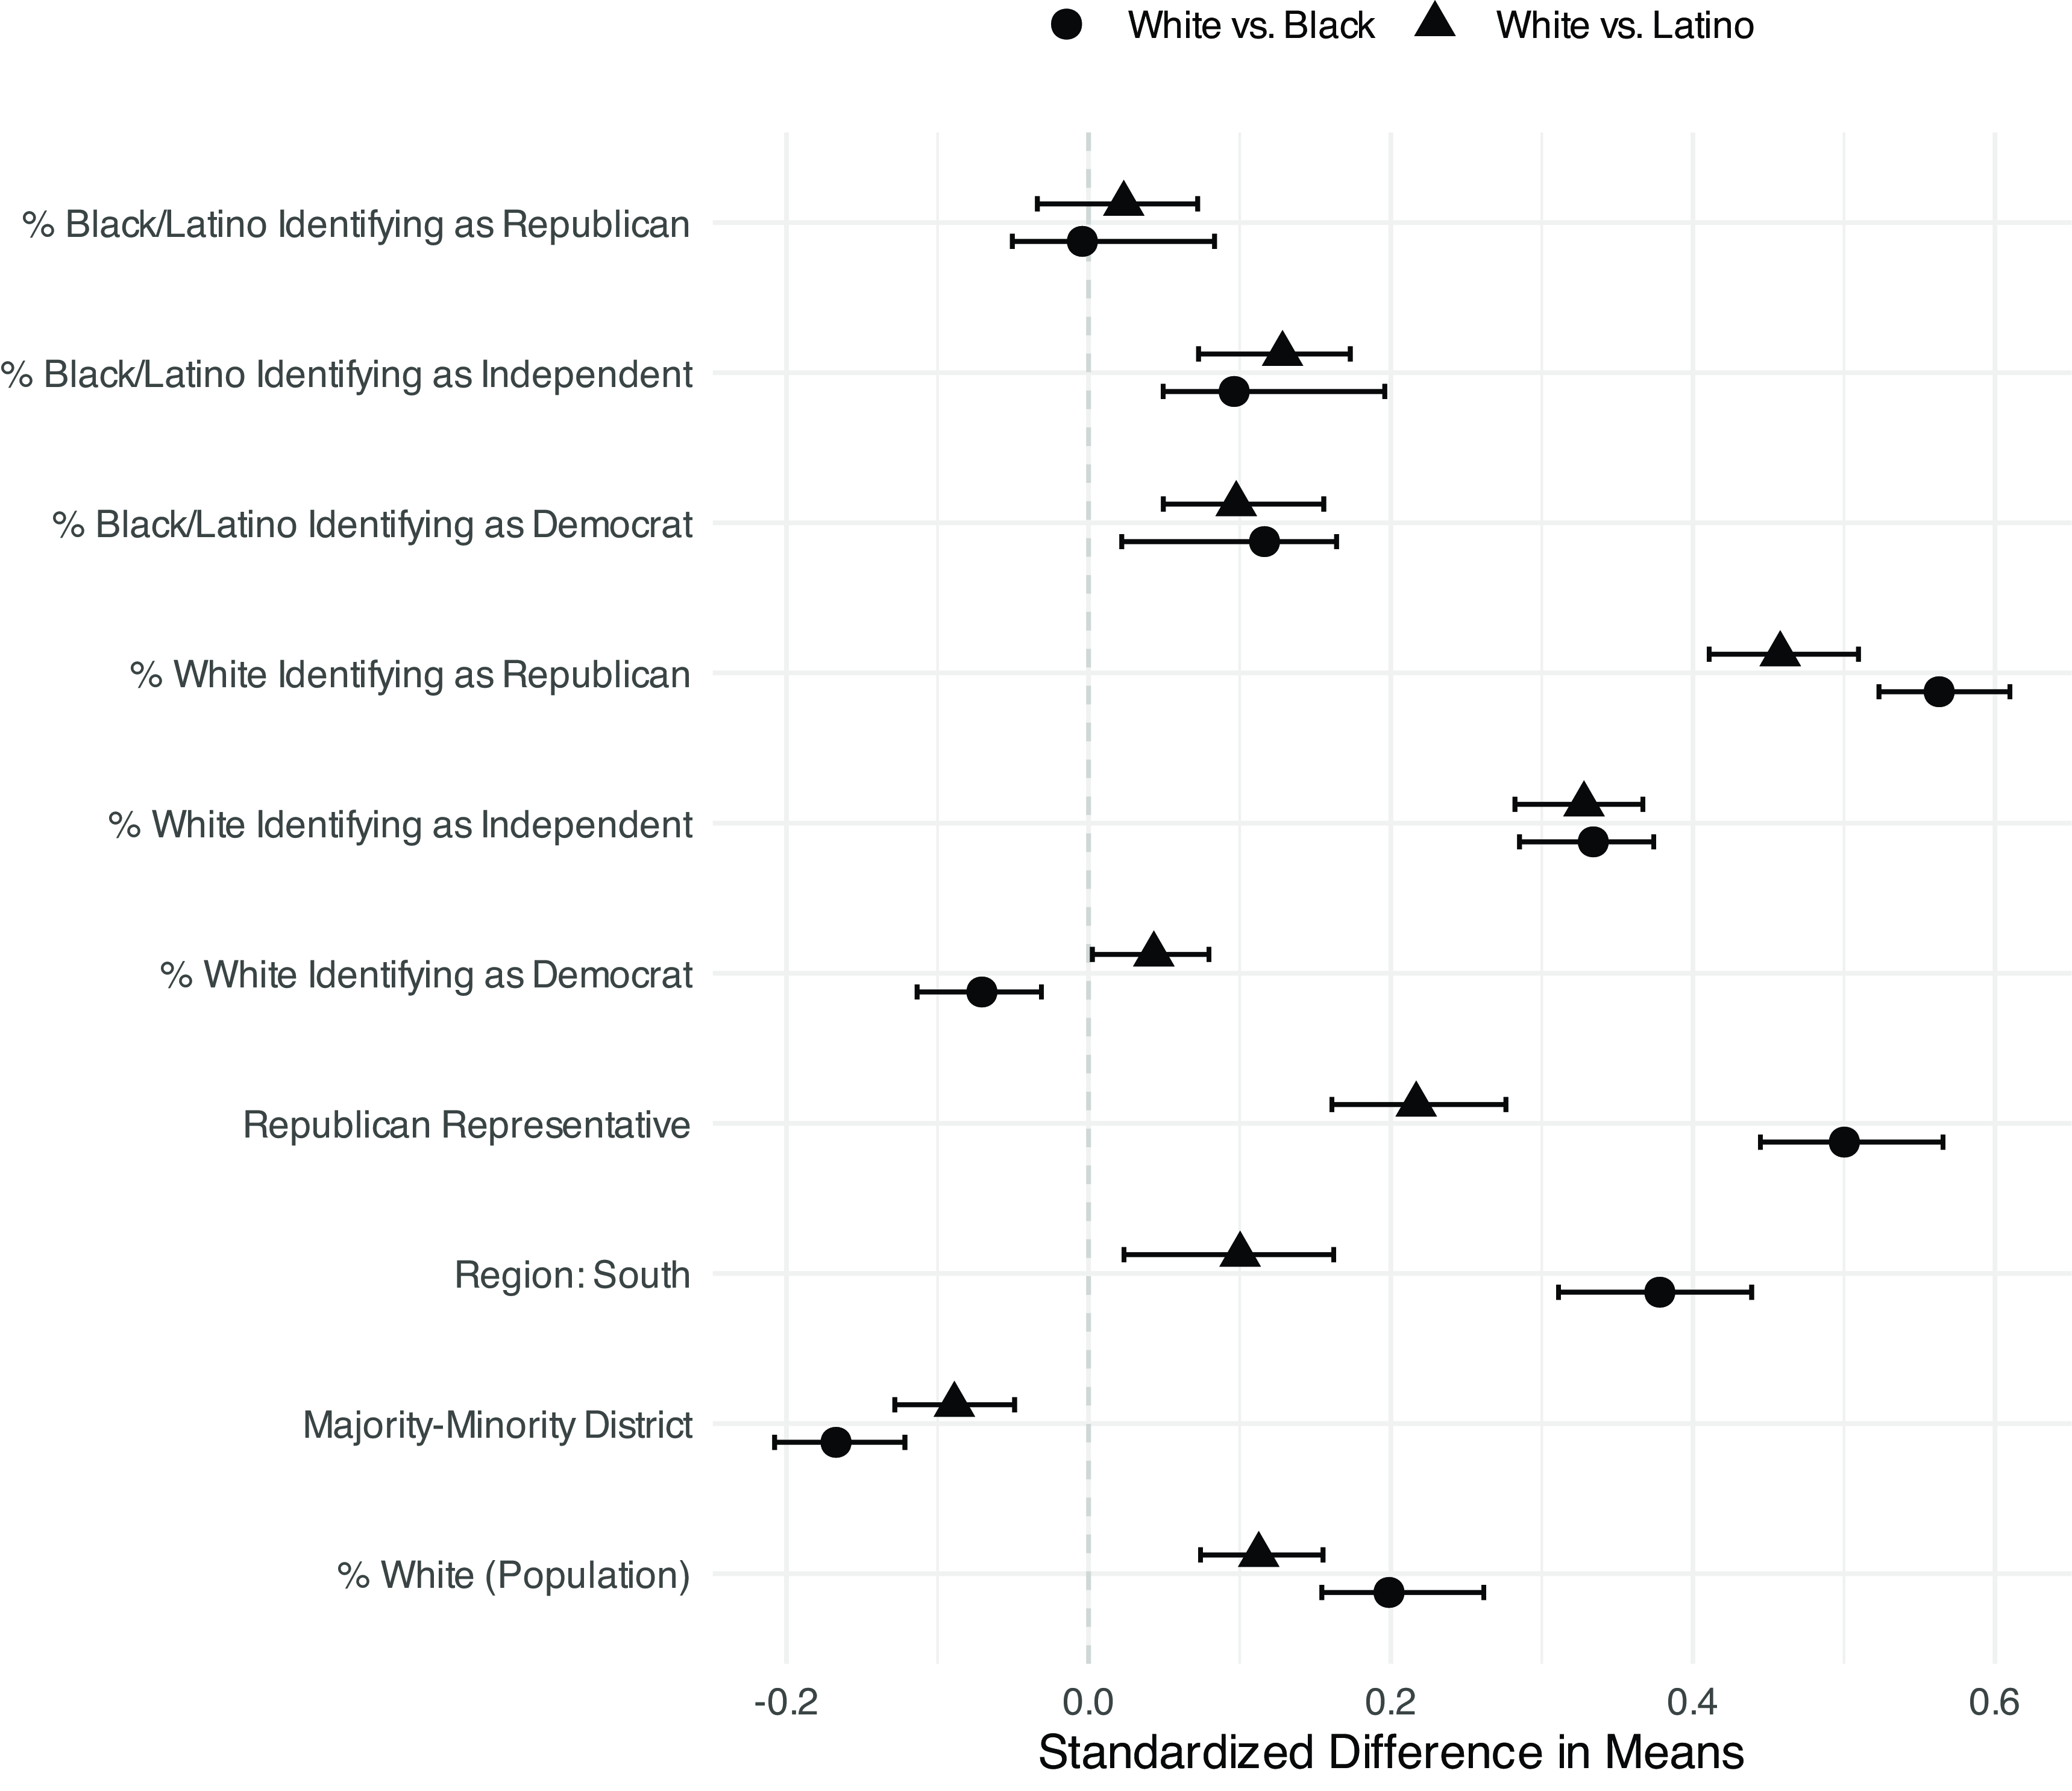
To further explicate the differences between districts in which White vs. Black or Latino median opinions disagree, Figure 2 plots standardized differences in means (i.e., difference in means divided by the pooled standard deviation) between districts with and without such disagreement.
Balance across districts with and without disagreement in median opinions. Each point represents the standardized difference in means (averaged across bills with weights proportional to the relative number of districts for each bill) between districts with and without disagreement in median policy opinions between White and either Black or Latino constituents, calculated for each covariate. Error bars show 95% intervals across posterior draws of the median opinions.

Figure 2 Long description
Panel A: A scatter plot showing the percentage of Black and Latino individuals identifying as Republican, Independent, and Democrat. The horizontal axis represents the standardized difference in means, ranging from -0.2 to 0.6. The vertical axis lists the categories of political identification. Error bars indicate 95% intervals across posterior draws of the median opinions. Panel B: A scatter plot showing the percentage of White individuals identifying as Republican, Independent, and Democrat. The horizontal axis represents the standardized difference in means, ranging from -0.2 to 0.6. The vertical axis lists the categories of political identification. Error bars indicate 95% intervals across posterior draws of the median opinions. Panel C: A scatter plot showing the presence of a Republican representative, region in the South, majority-minority district, and percentage of White population. The horizontal axis represents the standardized difference in means, ranging from -0.2 to 0.6. The vertical axis lists the categories of demographic and geographic factors. Error bars indicate 95% intervals across posterior draws of the median opinions.
In districts where median opinions disagree, White constituents are more likely to identify as Republican, while Black and Latino constituents tend (if anything) to lean more Democratic. Representatives in these districts also tend to be more Republican, and majority–minority constituencies are slightly less common. The imbalance in majority–minority districts likely reflects that White constituents in these districts are slightly more liberal than Whites in non-majority–minority districts, while Black and Latino opinions are similar across both types of districts.
In sum, the imbalances in Figure 2 suggest that districts where median opinions differ are arguably the most vulnerable to unequal representation (Warshaw, Reference Warshaw2012; Kastellec et al., Reference Kastellec, Lax, Malecki and Phillips2015; Lax et al., Reference Lax, Phillips and Zelizer2019). This possibility of greater susceptibility to unequal representation serves as an important scope condition for interpreting the results that follow. Nonetheless, findings from these districts remain meaningful. In districts where opinions agree, “coincidental representation” cannot be ruled out, even if greater equality in representation might be expected.
Evidence from the “Taking Sides” Analysis
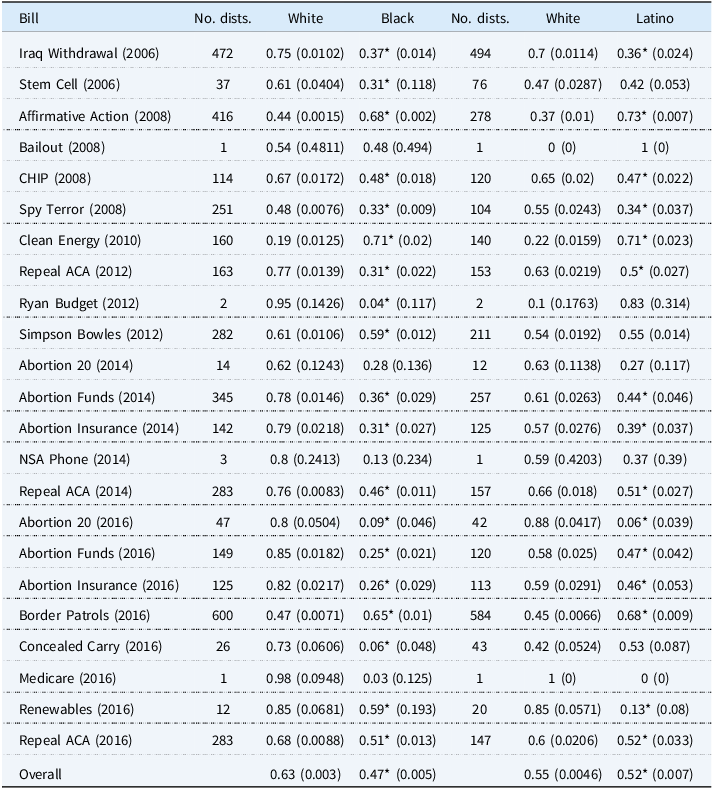
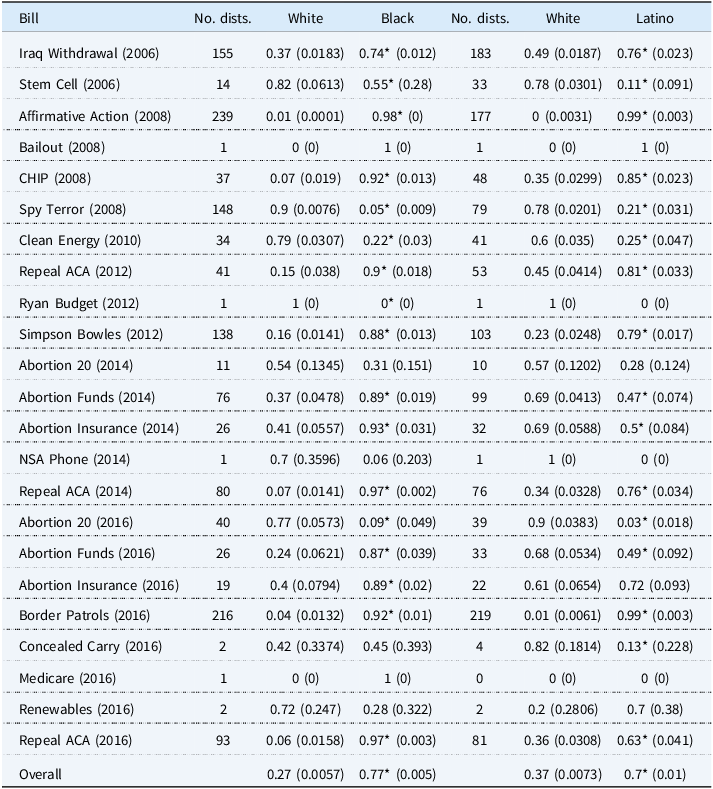
Table 2 presents results analogous to Table 1 except the former includes only districts in which the median opinion differs between White and either Black or Latino subconstituencies. However, a subtle difference in the analysis displayed in Table 2 is that the average over all districts is weighted by the proportion of the total population over all districts. This weighting is important because districts are far from uniform in their racial make-ups. A district with a small Black population whose legislator votes against the median Black opinion carries far less implications for representation than a district with a large Black population whose legislator votes against the median Black opinion. These two districts are not equally consequential in terms of representation of Black Americans.
Same as Table 1, except restricted to districts in which White and Black or White and Latino median opinions differ, as determined separately for each posterior draw. The “No. dists.” columns report the ceiling of the average number of differing districts across all draws

Table 2 Long description
A table comparing White, Black, and Latino opinions on various bills across different districts. The table has 31 rows and 8 columns. Column headers are Bill, No. dists., White, Black, No. dists., White, and Latino. Row labels include the names of bills and the year they were passed. Each row presents the number of districts and the median opinions for White, Black, and Latino subconstituencies. Notable bills include Iraq Withdrawal, Stem Cell, Affirmative Action, Bailout, CHIP, Spy Terror, Clean Energy, Repeal ACA, Ryan Budget, Simpson Bowles, Abortion-related bills, NSA Phone, Border Patrols, Concealed Carry, Medicare, Renewables, and overall summary. The table captures the average number of differing districts across all posterior draws where White and Black or White and Latino median opinions differ.
In addition, to appropriately propagate uncertainty (Treier and Jackman, Reference Treier and Jackman2008; Tanner, Reference Tanner1996), the standard errors reflect variation across all posterior draws in the number of districts where median opinions differ. The approach ensures that the analysis incorporates uncertainty that reflects not only estimates in racial groups’ opinions but also in the composition of districts whose median opinions differ between groups. When averaging across all bills, each bill is weighted by the number of districts in which the median opinions differ.
Table 2 presents a different picture than Table 1. Over all bills, the alignment between the median Black constituent and legislative voting (in districts where the median opinion of White and Black constituents differs) is 0.47, in contrast to 0.63 for White constituents. For Latino constituents in districts where the median White and Latino opinion differ, the same proportion is 0.52, in contrast to 0.55 for White constituents.
Proportionality vs. Race-Conscious Egalitarian Standard
White people make up the majority of constituents in over 90% of districts where White and Black median opinions differ. In districts where White and Latino median opinions differ, that figure is 89%. These patterns suggest that the findings in Table 2 are more consistent with the proportionality standard than with the race-conscious egalitarian standard.
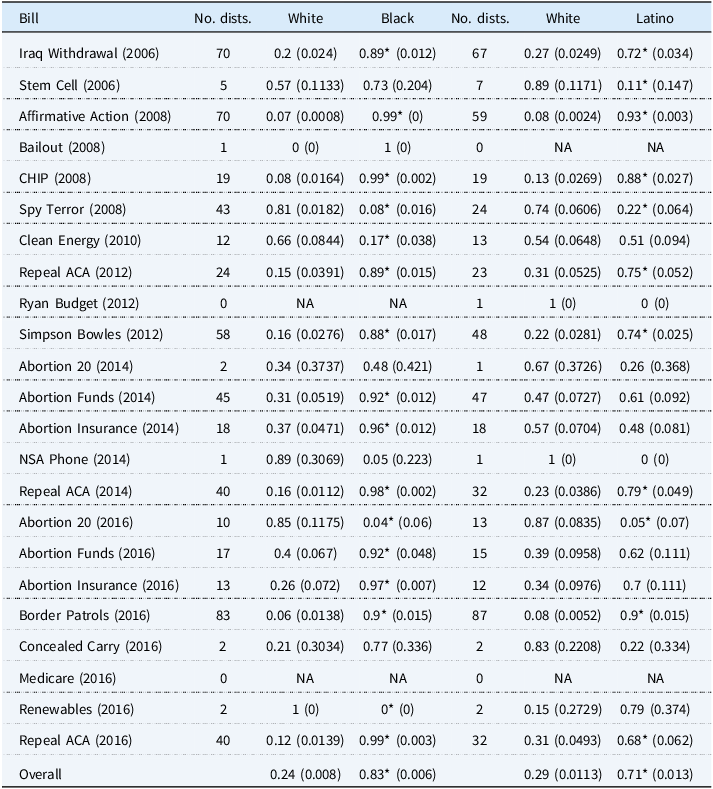
For further evidence in favor of the proportionality standard, I assess the interaction between districts’ majority–minority statuses and representation of Black vs. White subconstituencies. In the roughly 10% of majority–minority districts in which White and Black opinion differ, the estimated proportion of districts whose legislative vote aligns with the Black median’s opinion is 0.83 (relative to 0.24 for the White median). For Latinos, those proportions are 0.71 (Latinos) and 0.29 (Whites). By contrast, although not shown in Table 3, in majority-White districts, the alignment proportion for Black constituencies is 0.32 relative to 0.67 for Whites and 0.4 for Latino constituents relative to 0.58 for Whites.
Same as Table 2, except restricted to majority–minority districts in which the White and Black or White and Latino median opinions differ, as determined separately for each posterior draw. The “No. dists.” columns report the ceiling of the average number of differing districts across all draws. Entries are shown as NA when no districts met the inclusion criteria for that bill and subgroup

Table 3 Long description
A table comparing legislative votes on various bills by White, Black, and Latino subconstituencies in majority-minority districts. The table has 20 rows and 8 columns. Column headers are Bill, No. dists., White, Black, No. dists., White, and Latino. Row labels include bills from 2006 to 2016. Each row presents the number of districts and the proportion of districts whose legislative vote aligns with the median opinion of each subgroup. Notable bills include Iraq Withdrawal, Stem Cell, Affirmative Action, Bailout, CHIP, Spy Terror, Clean Energy, Repeal ACA, Ryan Budget, Simpson Bowles, Abortion-related bills, NSA Phone, Border Patrols, Concealed Carry, Medicare, Renewables, and Repeal ACA. The table highlights the differing alignment proportions between White, Black, and Latino subconstituencies across various bills.
These findings in Table 3 support the proportionality standard, as racial minority representation is far greater in majority–minority districts than in those where minorities are not the numerical majority. These findings therefore complement the existing literature, which has primarily explored the relationship between racial group size and representation conditional on racial minorities’ being numerical minorities (Griffin and Newman, Reference Griffin and Newman2007, Reference Griffin and Newman2008; Avery and Fine, Reference Avery and Fine2012).
Despite the general evidence against the race-conscious egalitarian standard of political equality, this evidence ought to be tempered once results are broken down by legislators’ parties. Subgroup estimates by party make clear that much of the overall evidence for the proportionality relative to the race-conscious egalitarian standard is driven by Republican legislators. Table 4 presents results among Democrats representing districts whose racial groups’ median opinions differ.
Same as Tables 2 and 3, except restricted to Democratic districts in which the White and Black or White and Latino median opinions differ, as determined separately for each posterior draw

Table 4 Long description
The table presents data on legislative votes by race and party affiliation, focusing on Democratic districts where the median opinions of White and Black or White and Latino groups differ. It includes columns for the bill name, number of districts, and voting percentages for White, Black, and Latino groups. Each row corresponds to a specific bill, with values indicating the proportion of votes for each racial group. Notable bills include Iraq Withdrawal (2006), Stem Cell (2006), Affirmative Action (2008), and others up to 2016. The table highlights variations in voting patterns across different bills and racial groups within Democratic districts.
In districts in which White and Black medians differ, 0.77 proportion of legislators vote with the Black median and 0.27 proportion of legislators vote with the White median (where the proportions use the same racial population size weights). Among Republicans, those proportions are 0.78 and 0.17, respectively. When White and Latino median opinions differ, the same two proportions among Democrats are 0.37 and 0.7, and among Republicans are 0.65 and 0.3. In roughly 73% of Democratic districts, White constituents are in the majority. Hence, at least among Democrats, but not overall, there is solid evidence for the race-conscious egalitarian standard of political equality.
Pluralist Standard
While there is greater evidential support for the proportionality relative to the race-conscious egalitarian standard, there is also evidence for the pluralist standard. This evidence is based on two issue areas that are explicitly race-targeted, affirmative action and border patrols. Affirmative action is explicitly race-targeted in that it aims to redress racial inequality through differential treatment of individuals belonging to different races. Border patrol policies are perhaps less explicitly race-targeted, but can still be interpreted as such. For example, many Latino citizens live in mixed-status households that include undocumented family members, thereby making at least these citizens’ families the direct targets of such policies. Likewise, the bills in this analysis, focused on increased border patrols, explicitly target the Mexican-American border and, by consequence, Latino individuals for whom Mexican-American-ness is exactly what makes them Latino.
Referring back to Table 2, for the race-targeted policy of affirmative action, the (population weighted) proportion of House members who voted in accordance with the median of Black and Latino constituents was 0.68 and 0.73, respectively. For White constituents, that same proportion was 0.43 (in districts in which White and Black medians disagreed) and 0.37 (in districts in which White and Latino medians disagreed). Likewise, for the border patrol bill (2016), the proportions of votes in alignment with the Black and Latino medians were 0.65 and 0.68, respectively. For the White medians, these proportions across districts in which opinion with the Black and Latino median differ are 0.47 and 0.45, respectively.
Evidence for the pluralist standard is weaker for bills that are not explicitly race-targeted but are often racialized, i.e., interpreted by constituents through racial frames. Tesler (Reference Tesler2012, Reference Tesler2016), for example, shows that the Affordable Care Act (ACA) was subject to the “spillover of racialization” because of the act’s close association with President Barack Obama. (See also Kinder and Dale-Riddle, Reference Kinder and Dale-Riddle2012.) Insofar as the ACA was a racialized issue, of particular importance to, e.g., Black relative to White Americans, then the evidence in favor of the pluralist standard is weaker. As Table 2 shows, for the repeal ACA bills in 2012, 2014, and 2016, respectively, the proportions of House members voting in alignment with the median Black constituent are 0.31, 0.46, and 0.51 compared to 0.77, 0.76, and 0.68 for the White median. It is more difficult to assess pluralist representation in the case of welfare policy, another often racialized domain (Kinder and Sanders, Reference Kinder and Sanders1996; Lublin, Reference Lublin1997; Canon, Reference Canon1999; Gilens, Reference Gilens2009), since public opinion across racial groups was largely aligned in opposition to such bills, e.g., the Ryan Budget bill (2012).
Conclusion
In this paper, I have matched 25 bills with corresponding CCES survey items measured before voting on these bills. My analysis provides strong evidence for the proportionality standard of political equality relative to that of race-conscious egalitarianism. That said, despite the lack of overall evidence for the race-conscious egalitarian standard, I do find strong evidence for it among Democratic legislators. I also provide moderate evidence for the pluralist standard in which a majority of legislators vote in alignment with minority subgroups’ preferences for explicitly race-targeted bills, but not those that are putatively race-neutral but have nevertheless become racialized.
As I stated at the outset, the focus of this paper is on representation in which a legislator's vote not only aligns with a racial subconstituency’s median but also would change in response to a change in that median opinion. To speak to this conception of representation, I rule out alternative explanations by focusing on bills voted on after opinions are measured and on districts where White and minority opinions differ. That said, the evidence in this paper is descriptive and cannot definitively speak to this causal conception of representation—not least because any observed alignment between legislative voting and racial subgroup opinions could be driven by, say, interest groups whose advocacy happens to align with the preferences of certain racial subgroups. Future research can aim to generate more definitive causal evidence.
Additional limitations of this paper include its focus (albeit for important methodological reasons) on 25 bills for which public opinion data precede the corresponding roll call votes. While these bills span a wide range of salient issue areas, concerns about generalizability to the broader universe of bills remain. Future work should assess how representative they are of the broader legislative agenda considered by the House. Similarly, the analysis focusing on districts where median opinions between racial groups differ helps rule out “coincidental representation,” but also limits the scope of the findings to districts in which one might expect representation to be less equal among racial groups. Both of these generalizability concerns should be kept in mind when drawing general conclusions about racial equality in representation.
Another limitation of this paper is that its findings are agnostic about causal mechanisms. As I explain, I do not “control for” opinions along other bases, such as income or partisanship. Racial subgroups and those based on income or partisanship are not disjoint so a change in opinion in one of these latter two subgroups would also imply a change in subgroup opinion. Hence, “controlling for” income and partisanship would be “controlling away” the role of race. Nevertheless, further research ought to unpack these different mechanisms by which representation of racial subgroups might or might not obtain. For example, an experiment, akin to that of Butler and Nickerson (Reference Butler and Nickerson2011), might randomly expose legislators to the same public opinion information, but present it differently in terms of race, income, or partisan divisions. Measures of subsequent legislative behavior might then be able to discern which subgroups legislators are responding to, not only which subgroups legislators’ behaviors represent.
Finally, this paper focuses on the alignment between legislative behavior and subconstituent opinion at the level of House districts—the level most closely associated with the principle of direct representation. I do not examine the Senate, where states—far less likely to be majority–minority—serve as the relevant political units. Caution is therefore warranted in generalizing these findings to the Senate. Given the filibuster’s role in amplifying the Senate’s influence over policy outcomes, the exclusion of the Senate is an important limitation and, more broadly, underscores why one should avoid drawing conclusions about the extent to which policy outcomes reflect constituents’ preferences.
Although this paper does not address which policy outcomes ultimately come to fruition, it takes an important step toward understanding the forces that determine which policies do. The analysis, grounded in a principal-agent conception of democracy, offers a crucial piece of the broader puzzle of why racial groups do—or do not—“get what they want from government.” Future research could extend this approach by linking legislative voting behavior to the policy outcomes it shapes, thereby clarifying how differences between racial groups’ policy preferences and legislators’ actions contribute to disparities in substantive representation. Future research could extend this approach by linking policy outcomes to the legislative votes that shape them. Comparing how well legislative voting and resulting policy outcomes each align with racial subgroups’ opinions can shed light on what drives—or undermines—racial equality in substantive representation.
Supplementary material
The supplementary material for this article can be found at https://doi.org/10.1017/rep.2025.10041