I. INTRODUCTION
The processing of metals through the application of severe plastic deformation (SPD) has now become a major tool for producing bulk solids with ultrafine grains (UFG), where these grains are within the submicrometer or even the nanometer range.Reference Valiev, Islamgaliev and Alexandrov1,Reference Langdon2 Several different SPD processing techniques are availableReference Valiev, Estrin, Horita, Langdon, Zehetbauer and Zhu3 but most attention to date has concentrated on the two procedures of equal-channel angular pressing (ECAP)Reference Valiev and Langdon4 and high-pressure torsion (HPT)Reference Zhilyaev and Langdon5 and in practice processing by HPT is especially advantageous because, by comparison with ECAP, it produces materials having smaller grain sizes and higher fractions of high-angle boundaries.Reference Zhilyaev, Lee, Nurislamova, Valiev and Langdon6–Reference Wongsa-Ngam, Kawasaki and Langdon8
The primary advantage of producing UFG materials is that, as a consequence of the Hall–Petch relationship in which the yield stress varies inversely with the square root of the grain size,Reference Hall9,Reference Petch10 the strength of the metal is increased when the grain size is reduced. But conversely the overall ductilities or elongations to failure are generally very small in UFG metals, thereby leading to the maxim that “materials may be strong or ductile, but rarely both at once”.Reference Valiev11,Reference Valiev12
The loss in ductility at small grain sizes is due to the low rate of strain hardening and the low strain rate sensitivity, m. If the rate of strain hardening is high, dislocations are able to accumulate within the grains so that, when combined also with a high value of m, the onset of necking or localized deformation is delayed. However, in UFG metals, the very small grains preclude a capability for storing dislocations and instead the dislocations move through the grains and are absorbed at the grain boundaries.Reference Jia, Wang, Ramesh, Ma, Zhu and Valiev13,Reference Wang and Ma14 This leads to a low rate of strain hardening so that the elongations to failure are very limited even for metals that are inherently ductile when tested with conventional coarse grain sizes.Reference Koch, Morris, Lu and Inoue15 Several strategies have been proposed for improving the ductilities of UFG metalsReference Wang and Ma16–Reference Zhao, Zhu and Lavernia19 and there are numerous reports documenting procedures that may be undertaken to improve the tensile ductilities of specific materials.Reference Jia, Wang, Ramesh, Ma, Zhu and Valiev13,Reference Horita, Ohashi, Fujita, Kaneko and Langdon20–Reference Zhao, Topping, Bingert, Thornton, Dangelewicz, Li, Liu, Zhu, Zhou and Lavernia23 It is also important to note that a significant improvement in ductility is a fundamental requirement for improving the fatigue strength and fracture toughness of these UFG metals.Reference Höppel, Zhou, Mughrabi and Valiev24–Reference Höppel, Kautz, Xu, Murashkin, Langdon, Valiev and Mughrabi26
A classic report was published in 2002 by Valiev et al.Reference Valiev, Alexandrov, Zhu and Lowe27 that documented these shortcomings in UFG metals under the broad title of “the paradox of strength and ductility”. Specifically, it was shown that most UFG metals fall within the regime of very low ductility but examples were presented for pure Cu prepared by ECAP and pure Ti prepared by HPT where combinations of high strength and high ductility were achieved after processing to very high strains. This led to the conclusion that materials must be severely deformed “beyond a certain level of strain” to achieve both high strength and good ductility.Reference Valiev, Alexandrov, Zhu and Lowe27 Similar increases in ductility with increasing strain were later reported for commercial purity CuReference Dalla Torre, Lapovok, Sandlin, Thomson, Davies and Pereloma28 and an Al–3%Mg alloy.Reference Kumar, Xu and Langdon29 The present investigation was initiated to provide a critical examination of the strength–ductility paradox using a commercial alloy in which it is known that the ductility and toughness are generally poor. Accordingly, this research was undertaken using a cast Al–7%Si alloy where the composition for this and all other alloys is given in weight percentage.
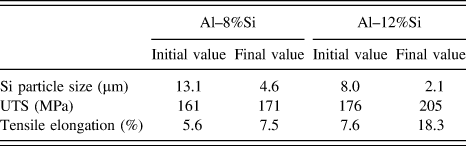
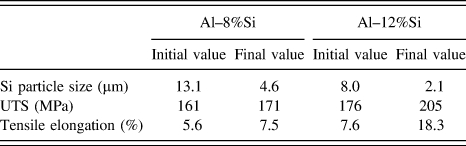
Cast Al–Si hypoeutectic alloys are widely used in the automotive industry. Due to their desirable properties of good castability together with moderate strength at room temperature and good wear resistance, these alloys have a widespread use in modern industrial applications including in the manufacturing of engine blocks, pistons, welding, and brazing sheets.Reference Kaufman and Roy30 However, it is well known that the alloys have poor ductility and toughness. Studies have been conducted to modify some of their microstructural features, such as the Si particle size, to improve the mechanical properties of these alloys in terms of ductility and strength.Reference Hafiz and Kobayashi31,Reference Hafiz and Kobayashi32 Table I summarizes the effect of conventional processing and the related microstructural modifications on the mechanical behavior of two different cast Al–Si alloys where data are presented for the average size of the Si particles, the ultimate tensile strength (UTS) in tensile testing at ambient temperature, and the resultant tensile elongation. Thus, these alloys are well documented and there is a good database that may be used for a comparison of results using different processing techniques. Some limited results are available on the effect of processing by ECAPReference García-Infanta, Swaminathan, Zhilyaev, Carreño, Ruano and McNelley33,Reference García-Infanta, Zhilyaev, Carreño, Ruano, Su, Menon and McNelley34 and HPTReference Zhilyaev, García-Infanta, Carreño, Langdon and Ruano35–Reference Mungole, Nadammal, Dawra, Kumar, Kawasaki and Langdon38 on cast Al–Si alloys but there are no systematic reports on the evolution in strength and ductility as a function of the imposed strain in HPT and the processing temperature. Thus, a conclusive processing route for achieving high ductility and high strength in Al–Si alloys has proven elusive. The present investigation addresses this problem by systematically conducting HPT at two different temperatures and through various numbers of turns.
Effect of change in Si morphologies on mechanical properties of Al–8%Si and Al–12%Si alloys.Reference Hafiz and Kobayashi31,Reference Hafiz and Kobayashi32
II. EXPERIMENTAL MATERIAL AND PROCEDURES
A plate of a cast Al–7%Si hypoeutectic alloy was machined into circular disks of 10 mm diameter and 1 mm thickness. These disks were polished to a final thickness of ∼0.82 mm. The polished samples were annealed at 445 K (∼0.5T m where T m is the absolute melting temperature) for 5 h in a vacuum furnace operating at 10−4 Torr to relieve any residual stress incurred during machining and to homogenize the microstructure. After annealing, the average Al grain size was ∼135 μm and the average Si particle size was ∼2.8 μm.
The HPT processing was conducted under quasi-constrained conditionsReference Figueiredo, Cetlin and Langdon39,Reference Figueiredo, Pereira, Aguilar, Cetlin and Langdon40 at two different temperatures, 298 K (room temperature) and 445 K (∼0.5T m), by placing the sample between two anvils, applying a uniaxial pressure of 6.0 GPa and then rotating the lower anvil. At each temperature, samples were processed to 1/4, 1, 5, and 10 turns of HPT. Full details of the HPT processing are given elsewhere.Reference Kawasaki and Langdon41
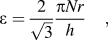
In HPT processing, the equivalent von Mises strain, ε, at any point within the disk is given byReference Valiev, Ivanisenko, Rauch and Baudelet42–Reference Wetscher, Pippan, Sturm, Kauffmann, Scheu and Dehm44
 $$\varepsilon = {2 \over {\sqrt 3 }}{{\pi Nr} \over h}\quad ,$$
where N is the number of HPT turns, h is the thickness of the disk, and r is the radial distance from the center. It follows from Eq. (1) that the strain varies across the disk and it is equal to zero in the center where r = 0. Earlier experiments showed that there is generally a gradual evolution toward structural homogeneity throughout the HPT disks with increasing number of turnsReference Zhilyaev, Lee, Nurislamova, Valiev and Langdon6–Reference Wongsa-Ngam, Kawasaki and Langdon8 and this is consistent with predictions using strain gradient plasticity modeling.Reference Estrin, Molotnikov, Davies and Lapovok45 Therefore, to avoid any problems associated with residual inhomogeneities near the centers of the disks, two tensile specimens were cut from each processed disk from symmetrical off-center positions using a numerically controlled electrodischarge machine. These specimens were similar to those described earlierReference Loucif, Figueiredo, Kawasaki, Baudin, Brisset, Chemam and Langdon46 except that the gage lengths and widths were 0.672 and 1 mm, respectively. The average strain in the tensile sample imposed by HPT processing was estimated using Eq. (1) to calculate the strains at approximately 225 points, placed in a regular square grid with separations of 50 µm, with the grid approximately covering the gage section of the specimen. Using this procedure, the average strains for the HPT disks processed through 0, 1/4, 1, 5, and 10 turns were estimated as 0, ∼2.3, ∼9.2, ∼46.2, and ∼92.5, respectively.
It should be noted that in practice the geometry of the dog-bone tensile sample, especially the thickness to gage length ratio, significantly affects the ductility or measured elongation to failure. Specifically, an increase in the thickness and a decrease in the gage length were reported to increase the total elongation to failure in Cu.Reference Zhao, Guo, Wei, Dangelewicz, Xu, Zhu, Langdon, Zhou and Lavernia47,Reference Zhao, Guo, Wei, Topping, Dangelewicz, Zhu, Langdon and Lavernia48 Accordingly, care was taken to ensure that all tensile samples tested in this study were of identical geometry. Since the above effect on ductility stems mainly from a geometrical effect, the trends in mechanical behavior derived from a comparison of the stress–strain data of identical sets of samples should be universal. However, caution must be exercised when comparing the absolute values of ductilities reported in this study with those obtained using larger conventional samples.
Prior to tensile testing, the tensile specimens were metallographically polished up to ∼0.25 μm diamond paste and then electropolished at 232 K using an aqueous solution of 10% 2-butoxyethanol, 70% ethanol, and 8% concentrated perchloric acid for times which depended on the HPT straining conditions but were within the range of 15–90 s. The prepared samples were then preserved at 10−3 Torr pressure for electron backscatter diffraction (EBSD) analysis. The grain size measurements were conducted using EBSD analysis where a region with a misorientation >5° was identified as a grain and its area was equated to a circle having a diameter equal to the grain size. It should be noted that, although a grain boundary with a misorientation of 5° is not as effective as boundaries of 10 or 15° in impeding dislocations from transgranular slip, the definition of a grain with a misorientation of >5° permits an unambiguous observation of the evolution of both the subgrain structure and the grain size as a function of the imposed strain in HPT. Furthermore, these quantities follow the trends observed conventionally in other metallic systems processed through various SPD techniques.Reference Mungole, Nadammal, Dawra, Kumar, Kawasaki and Langdon38 For EBSD, the step sizes were chosen to contain at least 20 pixels in each grain. Following the EBSD measurements, the tensile specimens were pulled to failure at room temperature (298 K) under constant rates of cross-head displacement with initial strain rates of 1.0 × 10⁻⁴, 1.0 × 10⁻³, 3.3 × 10⁻³, and 1.0 × 10⁻² s−1.
Following the tensile testing, the fractured surfaces of the samples were examined using a scanning electron microscope (SEM) to reveal the microstructural features of fracture. In addition, the polished flat surfaces of several samples were examined using atomic force microscope (AFM) to reveal the deformation-induced topographic evolution and the possible occurrence of grain boundary sliding (GBS). The AFM observations were conducted in the tapping mode to provide the topographic or height profile and an amplitude error map which is sensitive to the slope of the sample.Reference Eaton and West49 Thus, the associated local profile sensitivity of the amplitude error map may be used to provide direct information on whether adjacent grains slide relative to each other during the deformation. A three-dimensional representation of the surface using the topographic profile was often helpful in directly identifying the occurrence of GBS.
III. EXPERIMENTAL RESULTS
A. Characteristics of the microstructure after HPT
Figure 1 shows semi-logarithmic plots of (a) the average grain sizes and (b) the average sizes of the Si particles in a 2-D projection based on the measurements taken within the gage lengths of the tensile samples plotted against the numbers of HPT turns: for convenience, the estimated average equivalent strains are shown along the upper abscissa.
Variation of (a) average grain size and (b) average Si particle size as a function of the number of HPT turns and the average equivalent strain: since the Si particles usually protrude out of the electropolished samples, the measurements refer to the 2-D projection on the plane of the SEM micrograph.

As anticipated, the grain size decreases with increasing number of HPT turns in Fig. 1(a) and, in addition, the grain refinement is significantly faster at the lower processing temperature. At 298 and 445 K, the grain sizes in the gage lengths were refined to values of ∼0.5 and ∼1.9 μm, respectively, after 5 HPT turns and the minimum average grain sizes were recorded as ∼0.4 and ∼1.5 μm, respectively, after 10 HPT turns. These results are consistent with earlier reports showing that HPT processing at a pressure of 6.0 GPa produces reasonably homogeneous UFG microstructures in regions away from the center of the disks after 5 or more turns.Reference Zhilyaev, Nurislamova, Kim, Baró, Szpunar and Langdon7
It is apparent from Fig. 1(b) that the average size of the Si particles decreases rapidly in the early stages of the straining process and there is little dependence on the processing temperature. However, there is some minor particle growth after 5 turns, especially when processing at 445 K. After 5 turns, the average sizes of the Si particles were measured as ∼0.12 μm for both processing temperatures but after 10 turns these sizes increased to ∼0.19 and ∼0.30 μm at 298 and 445 K, respectively. These particle sizes are significantly smaller than those generally reported in Al–Si alloys after conventional processing as documented in Table I.
B. Characteristics of the tensile testing
Tensile tests were conducted at 298 K on a large number of samples covering four different strain rates but, for illustrative purposes, Fig. 2 shows only the engineering stress–strain curves obtained after testing at a strain rate of 1.0 × 10⁻³ s−1 for specimens processed at (a) 298 and (b) 445 K, respectively: these plots are generally representative of the results obtained at all strain rates. Inspection shows that all specimens exhibit noticeable strain hardening upon yielding and then strain softening beyond the UTS or occurrence of necking. The yield strength (YS) and UTS are consistently higher after HPT processing and the increase in flow stress is significantly higher when processing at the lower temperature. In addition, at both processing temperatures the elongations to failure increase when the samples are processed through higher numbers of HPT turns. Similar results were also obtained at the other strain rates.
Representative plots of engineering stress versus engineering strain for samples tested under tension in the unprocessed condition and after processing by HPT at (a) 298 and (b) 445 K: the tensile testing was conducted at 298 K under an initial strain rate of 1.0 × 10⁻³ s−1.
To provide an overall summary of the effects of the HPT processing conditions, Fig. 3 shows plots of (a) the measured UTS and (b) the elongation to failure as a function of the equivalent strain for samples processed at 298 K and then tested at strain rates from 1.0 × 10⁻⁴ to 1.0 × 10⁻² s−1. Figure 3(a) shows that there is an immediate increase in the UTS following HPT straining for all samples but generally the UTS initially increased and then decreased after attaining a maximum value at a critical strain. At the two fastest strain rates, the increase in UTS was typically observed up to an equivalent strain of ∼50 corresponding to 5 HPT turns. However, it is interesting to note that an opposite trend was observed for the elongation to failure in Fig. 3(b) and also for the uniform strain which was approximated as the strain at UTS: specifically, the measured elongations rapidly decreased to a minimum at a strain of ∼2.5 corresponding to 1/4 turn and thereafter there was an increase in ductility with increasing strain for all specimens during HPT processing.
The variation in (a) the UTS and (b) the elongation to failure with the equivalent strain imposed during HPT processing at 298 K.
Since the UTS of the HPT-processed material was always greater than the UTS of the as-cast material and the ductility of the HPT-processed material gradually increased after attaining a minimum at only 1/4 turn of HPT, it is reasonable to anticipate a simultaneous increase in both strength and ductility by comparison with the initial as-cast material. This is confirmed in Fig. 4 where plots are presented in three different forms. In Fig. 4(a), the normalized YS, as given by the measured value of YS divided by YS for the as-cast material, is plotted against the elongation to failure normalized to the value for the as-cast material, εfl/εfl-as-cast; in Fig. 4(b), the UTS normalized to the as-cast condition is plotted against the normalized elongation to failure; and in Fig. 4(c), the normalized UTS is plotted against the normalized uniform elongation. Datum points are shown for the four different testing strain rates and the horizontal and vertical broken lines correspond to the points where these normalized values are equal to 1.0. Therefore, conventional behavior showing an increase in strength at the expense of ductility, or conversely an increase in ductility at the expense of strength, will lie in the area to the left and below the broken lines. By contrast, datum points falling above and to the right of the two broken lines, so that the values of the normalized strength and the normalized elongation are both greater than 1, exhibit a simultaneous increase in both strength and ductility by comparison with the as-cast material and this is designated as the region of high strength–high ductility. Thus, it is readily apparent from the plots in Fig. 4 that there is a transition to high strength (measured either in terms of YS or UTS) and high ductility (measured either in terms of elongation to failure or maximum uniform elongation) if there is an appropriate combination of the HPT processing conditions such that the tensile test conditions can be optimized. An identical set of plots is shown in Fig. 5 for samples processed by HPT at the higher temperature of 445 K.
Variation of (a) the normalized YS and (b) the normalized UTS with the normalized elongation to failure and (c) the variation of the normalized UTS with the normalized uniform elongation corresponding to the strain at UTS for samples processed by HPT at 298 K: data falling above the broken horizontal line and to the right of the broken vertical line display a simultaneous increase in strength and ductility compared to the as-cast material and this is designated the high strength–high ductility region whereas conventional behavior denotes an increase in ductility at the expense of strength or an increase in strength at the expense of ductility.
Variation of (a) the normalized YS and (b) the normalized UTS with the normalized elongation to failure and (c) the variation of the normalized UTS with the normalized uniform elongation corresponding to the strain at UTS for samples processed by HPT at 445 K: data falling above the broken horizontal line and to the right of the broken vertical line display a simultaneous increase in strength and ductility compared to the as-cast material and this is designated the high strength–high ductility region whereas conventional behavior denotes an increase in ductility at the expense of strength or an increase in strength at the expense of ductility.
A careful inspection of the various plots shown in Figs. 4 and 5 for samples processed at 298 and 445 K leads to several important conclusions.
First, the relative increase in the normalized YS is higher than for the normalized UTS thereby demonstrating that there is a significantly slower rate of strain hardening in the HPT-processed material. This is attributed to the high dislocation densities introduced into the samples in the very early stages of HPT processing which permit only limited dislocation multiplication up to the points of exhaustion of the strain hardening.
Second, and with only a few exceptions, the samples displaying an increase both in the strength and in the ductility also show similar increases in the uniform elongation and in the total elongation. By contrast, for the samples showing conventional high strength–low ductility behavior, the decrease in the uniform elongation is larger by comparison with the total elongation.
Third, samples processed by HPT at 298 K in Fig. 4 show a clear potential for achieving a transition to the high strength–high ductility region. This same transition is also visible after processing at 445 K as shown in Fig. 5 but the relative improvement is better, and the transition to the high strength–high ductility region is achieved more easily, when processing at the lower temperature. Thus, there are fewer experimental points lying in this zone in Fig. 5 and the points consistently lie closer to the horizontal and vertical broken lines delineating conditions where the normalized stresses and strains are equal to 1.0. It follows, therefore, that these results demonstrate a clear requirement for achieving high strength and high ductility by conducting the HPT processing at the lowest possible temperature.
Fourth, samples tested at the slow and intermediate strain rates of 1.0 × 10⁻⁴, 1.0 × 10⁻³, and 3.3 × 10⁻³ s−1, regardless of whether they are processed by HPT at 298 or 445 K, show a higher tendency to fall in the high strength–high ductility region by comparison with the fastest strain rate of 1.0 × 10⁻² s−1. This result demonstrates the requirement for using relatively low strain rates to achieve high strength and high ductility in tensile testing at room temperature.
C. The calculated strain rate sensitivity in tensile testing
The strain rate sensitivity, m, for samples subjected to tensile testing may be calculated by plotting the true flow stress at a strain lower than the total strain at UTS as a function of the strain rate,  $\dot \varepsilon$, and then performing a best fit analysis by making use of the following relationship:
 $$\sigma = k{\dot \varepsilon ^m}\quad ,$$
where σ is the flow stress and k is a constant.
Using samples processed at 298 K, Fig. 6 shows the variation of the measured strain rate sensitivity as a function of the number of HPT turns and therefore of the representative equivalent strain imposed during the HPT processing. Initially, in the as-cast condition, the value of m is ∼0.03 but this is reduced to ∼0.02 after 1/4 and 1 turn and thereafter there is a drastic increase to values of ∼0.12 and ∼0.14 after 5 and 10 turns, respectively. Since the specimens showing a transition to the high strength–high ductility region in Fig. 4 were generally processed to 5 or more HPT turns, it follows that higher values for the strain rate sensitivity are an important requirement for achieving specimens that lie within the high strength–high ductility region.
Variation of the strain rate sensitivity with the number of HPT turns and the equivalent strain imposed during HPT processing.
D. Topological observations using AFM
To check on the possible occurrence of GBS, topological observations were undertaken using AFM. Figures 7(a) and 7(b) show a representative amplitude error map and the corresponding three-dimensional profile for a sample processed through HPT for 5 turns at room temperature and then tested to failure at a strain rate of 1.0 × 10⁻³ s−1. In Fig. 7(a), the amplitude error map shows clear protrusions and intrusions associated with the grains thereby demonstrating the occurrence of GBS under the present experimental conditions. The occurrence of GBS is further confirmed in Fig. 7(b) where there is evidence for regions of flat hills and flat valleys representing grains lying at different topographic levels.
Using AFM to display the topological characteristics of a sample processed by HPT through 5 turns at 298 K and then pulled in tension to failure at a strain rate of 1.0 × 10⁻³ s−1: (a) amplitude error map and (b) the corresponding three-dimensional profile.
E. Appearance of the fracture surfaces after tensile testing
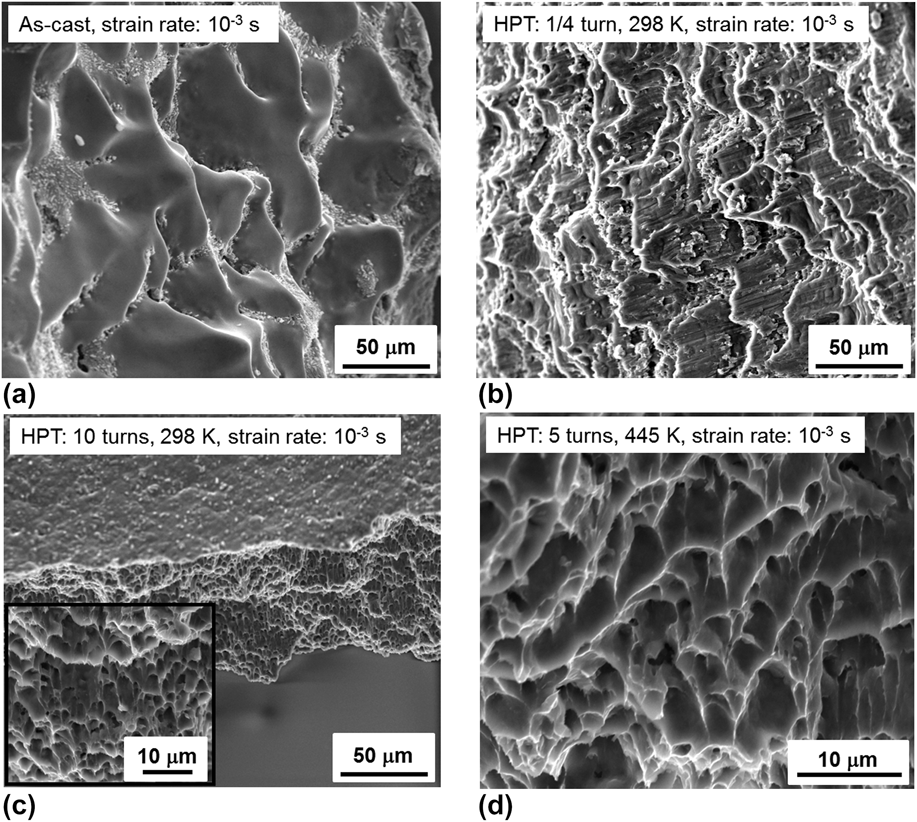
Figure 8 shows a series of fractographs for specimens tested at 298 K at an initial strain rate of 1.0 × 10⁻³ s−1: (a) shows the as-cast material and the other samples were processed by HPT at (b) 1/4 turn and (c) 10 turns at a processing temperature of 298 K and (d) 5 turns at a processing temperature of 445 K. It is readily apparent that both the as-cast sample in Fig. 8(a) and the samples processed to 10 turns in Fig. 8(c) and 5 turns in Fig. 8(d) exhibit ductile fracture where the fracture surfaces were filled with dimples. Furthermore, a detailed comparison of Fig. 8(a) and Figs. 8(c) and 8(d) demonstrates that the fracture surfaces of the samples processed to high numbers of HPT turns were significantly rougher than the as-cast material thereby confirming the improved ductility.
SEM micrographs showing the fracture surfaces of various samples tested at a strain rate of 1.0 × 10⁻³ s−1: (a) the as-cast condition, (b) and (c) the fracture surfaces on samples processed by HPT at 298 K through 1/4 and 10 turns, respectively, and (d) shows the fracture surface on the sample processed by HPT at 445 K for 5 turns: (b) represents a sample lying in the region of conventional behavior in Fig. 4 whereas (c) and (d) represent samples lying in the high strength–high ductility regions in Figs. 4 and 5, respectively.
It is reasonable to anticipate that cracks in the ductile samples will propagate through a coalescence of cavities in the α-Al and along the interfaces between the Si particles and the α-Al. However, in practice, the area fraction of the fracture of the Si/α-Al interfaces dramatically increases after processing to a high number of HPT turns and this can be attributed to the reduction in size of the Si particles as shown in Fig. 1(b) and their uniform distribution with increasing numbers of HPT turns.Reference Mungole, Nadammal, Dawra, Kumar, Kawasaki and Langdon38 By contrast, for samples processed through a small number of HPT turns, such as 1/4 turn in Fig. 8(b) and 1 turn (not shown), the fracture surfaces display a mixture of brittle and ductile failure so that these samples exhibit the conventional high strength but low ductility behavior after HPT processing and they fall within the zone of conventional behavior in Figs. 4 and 5.
IV. DISCUSSION
A. The influence of grain size in tensile testing after HPT processing
In any investigation designed to critically examine the paradox of strength and ductility, the important experimental parameters are the measured values for the UTS and the elongations to failure. Accordingly, it is convenient to bring the various experimental results together and to construct simple diagrams to display the influence of grain size on the values recorded for these two parameters. The results are shown in Fig. 9 for (a) the UTS and (b) the elongation to failure where, following the predictions of the Hall–Petch relationship,Reference Hall9,Reference Petch10 the data are plotted as a function of the inverse square root of the grain size, d −0.5.
The variation of (a) the UTS and (b) the elongation to failure with the inverse of the square root of the α-Al grain size showing data for HPT processing temperatures of 298 and 445 K.
It is apparent from Fig. 9(a) that the UTS generally increases with decreasing grain size in conformity with the Hall–Petch equation but in Fig. 9(b) it appears that the elongations to failure are relatively independent of grain sizes when the grains are reasonably large but the elongations increase dramatically when the grain size is very small. Thus, all experimental points lie within the broad area delineated by the two broken lines in Fig. 9(b) and the increase in the elongations to failure at the smallest grain sizes are consistent with the advent of a new flow mechanism under these conditions. It is reasonable to anticipate, based on the topological observations described in Sec. III. D, that this new mechanism is GBS because it is well established that the occurrence of GBS leads to high ductilities, including superplastic behavior, when the grain sizes are smaller than ∼10 μm.Reference Langdon50,Reference Langdon51
It should be noted that the calculation of grain size is dependent upon the cut-off value of the misorientation between the neighboring grains. Therefore, a misorientation cut-off value of 5°, as used in this study, will lead to a smaller grain size than when using a larger cut-off value such as 10°. In practice, however, the two grain size values will be related through a monotonically varying function and this will ensure that, within the scatter of the experimental data, the trends shown in Fig. 9 will remain valid irrespective of the choice of the cut-off value.
B. The potential for GBS in samples exhibiting the highest elongations
GBS is a diffusion-controlled flow mechanism that is generally considered to occur only at temperatures at and above ∼0.5T m.Reference Gifkins and Langdon52,Reference Langdon53 Nevertheless, the occurrence of GBS at low temperatures was predicted in early three-dimensional molecular dynamic simulations that were designed to model the behavior of nanocrystalline solidsReference Van Swygenhoven and Caro54–Reference Kumar, Van Swygenhoven and Suresh58 and there is increasing experimental evidence that GBS may occur in UFG metals after processing using SPD techniques such as ECAP and HPT.Reference Valiev, Kozlov, Ivanov, Lian, Nazarov and Baudelet59–Reference Polyakov, Semenova, Valiev, Huang and Langdon65 The advent of low temperature GBS after SPD processing is generally attributed to the introduction of an excess of extrinsic dislocations into the grain boundaries during the straining operation so that the boundaries are in a high-energy nonequilibrium configurationReference Valiev, Korznikov and Mulyukov66–Reference Horita, Smith, Nemoto, Valiev and Langdon68 and the movement of these extrinsic dislocations permits relatively easy GBS.Reference Valiev12
In the earlier development of the paradox of strength and ductility, the occurrence of both high strength and high ductility in UFG samples of Cu processed by ECAP and Ti processed by HPT was specifically attributed to the advent of some GBS which, it was suggested, occurred as an additional flow mechanism in these materials.Reference Valiev, Alexandrov, Zhu and Lowe27 In practice, it is well known that GBS will be facilitated by the very small grain sizes and by the larger fractions of high-angle grain boundaries that are a characteristic feature of materials subjected to SPD processing through large numbers of ECAP passesReference Kawasaki, Horita and Langdon69,Reference Xu, Horita and Langdon70 or HPT turns.Reference Wongsa-Ngam, Kawasaki and Langdon8,Reference Loucif, Baudin, Figueiredo, Brisset, Helbert, Chemam and Langdon71 The mechanism of GBS at very small grain sizes requires a stress exponent, n, of 2.0 which is equivalent to a strain rate sensitivity of m = 0.5.Reference Langdon72 In the present investigation, as shown in Fig. 6, the strain rate sensitivity was initially very low (∼0.03) but increased to ∼0.14 after 10 turns of HPT. This latter value of m is significantly lower than the theoretical value for GBS but it is identical to the value reported earlier for UFG Cu processed by ECAP for 16 passes where there was both high strength and high ductility.Reference Valiev, Alexandrov, Zhu and Lowe27 Accordingly, it is reasonable to assume that the present results match those reported earlier in the first description of the strength–ductility paradox and, as concluded in the earlier investigation, the value of m is consistent with flow occurring through a “mixture of GBS and crystallographic slip”.Reference Valiev, Alexandrov, Zhu and Lowe27
To provide a greater understanding of the effect of grain size on strength and ductility, it is important to investigate the variation of m with the average grain size produced in HPT processing. Accordingly, the strain rate sensitivity data shown in Fig. 6 are replotted in a semi-logarithmic form in Fig. 10 as a function of the grain size. This plot shows that the strain rate sensitivity remains low (<0.05) for all grain sizes above ∼1 μm where this is consistent with flow by crystallographic slip. However, the values of m increase rapidly at grain sizes below ∼1 μm and the highest value of m is associated with the smallest grain size. This suggests that grain boundary related flow mechanisms, such as GBS, were not active for the samples with the larger grain sizes even though these samples were produced through HPT processing. However, if the strain imposed by HPT processing is very high, leading to exceptional grain refinement to the submicrometer level, grain boundary related activities become significant. This is also supported by the non-monotonous increase in the strength of the material with HPT turns. Thus, as shown in Fig. 1, the grain sizes decrease monotonically with HPT turns for both processing conditions but, as shown in Figs. 2 and 3, the strength of the samples processed to higher numbers of HPT turns was not always greater than the samples processed to lower numbers of turns. Nevertheless, even with a reduction in the overall strength, the advent of GBS at the smallest grain sizes after the largest numbers of HPT turns led to a corresponding increase in ductility and therefore to favorable behavior that lay within the high strength–high ductility regions in Figs. 4 and 5. Examples of a minor decrease in strength but a corresponding increase in ductility are shown by the stress–strain curves for samples processed through 10 turns in Figs. 2(a) and 2(b).
The variation of the strain rate sensitivity with the average grain size within the gage length for samples processed by HPT at 298 K.
C. A reappraisal of the classic paradox of strength and ductility
The original report on the strength–ductility paradox presented an illustration, which has now become a classic representation, showing the yield stress plotted against the elongation to failure for a large number of materials.Reference Valiev, Alexandrov, Zhu and Lowe27 The major elements of this plot are reproduced in Fig. 11 where the shaded region below the curve delineates the conventional behavior of high strength and low ductility and the two points labeled nano Cu and nano Ti correspond to the results obtained after processing through 16 passes of ECAP and 5 turns of HPT, respectively. In Fig. 11, the datum points for Al and Cu are all taken from the earlier report and the numbers marked with percentages denote the strains imposed during rollingReference Valiev, Alexandrov, Zhu and Lowe27; for simplicity in presentation, additional single points for other materials, such as Co, Ni, and Zr, are not included but they lie within the shaded region. In practice, materials processed through conventional mechanical routes, such as rolling and extrusion, show a loss in ductility with increase in strength and these points all lie in the shaded region whereas materials subjected to SPD processing may, under favorable conditions, exhibit both high strength and high ductility so that these points lie in the region toward the top right-hand corner of the plot.
The diagram showing the strength–ductility paradox as developed by Valiev et al.Reference Valiev, Alexandrov, Zhu and Lowe27 where the shaded area represents the conventional behavior, the region of high strength and high ductility lies to the right of the solid and broken line and the numbers marked with percentages denote the strains imposed during rolling: the present results for the Al–7%Si alloy are superimposed on the plot and the displacement to the right with increasing number of HPT turns, N, is indicated by the arrow.
A careful inspection shows that Fig. 11 represents a qualitative presentation of the information provided earlier in a quantitative form in Figs. 4 and 5. Thus, both the nano Cu and nano Ti points in Fig. 11 lie within the high strength–high ductility region. For a direct comparison with the present investigation, it is instructive to take data for the Al–7%Si alloy when testing at a strain rate of 1.0 × 10⁻³ s−1 since this is the same strain rate used in the tensile testing by Valiev et al.Reference Valiev, Alexandrov, Zhu and Lowe27 and it is also the strain rate used for the data presented earlier in Figs. 2(a) and 2(b). Accordingly, the present results are superimposed in Fig. 11 where the open triangle represents the initial as-cast condition and the open circles and squares correspond to the two HPT processing temperatures of 298 and 445 K, respectively.
Inspection of Fig. 11 leads to several important conclusions. Thus, and as expected, the as-cast Al–7%Si alloy is stronger than the high purity (>99.5%) Al samples reported in the earlier study,Reference Valiev, Alexandrov, Zhu and Lowe27 the materials processed to small numbers of HPT turns lie within the conventional zone generally showing improved strength over the as-cast sample but relatively poor ductility and the samples processed to larger numbers of HPT turns display points that are displaced systematically toward the nonconventional region exhibiting both high strength and high ductility. Furthermore, similar results are obtained for both HPT processing temperatures. It is interesting to note that, unlike the nano Cu reported earlier,Reference Valiev, Alexandrov, Zhu and Lowe27 the increase in ductility of the Al–7%Si alloy is more rapid than the increase in strength. Nevertheless, the clear displacement with increasing numbers of turns, N, toward the nonconventional zone of high strength and high ductility, as represented by the arrow in Fig. 11, demonstrates that SPD processing to very high strains will potentially produce microstructures that are capable of displaying simultaneous increases in both strength and ductility.
D. General applicability of the present approach to the strength–ductility paradox
The evidence from Fig. 11 is that SPD processing of the Al–7%Si alloy to very high strains, as in HPT, provides a method for directly overcoming the conventional and well-established paradox of strength and ductility. This leads to three important conclusions.
First, SPD processing to a high strain provides a simple solution to the strength–ductility paradox. It is easily accomplished for all materials and it has significant advantages over other proposed, and less general, techniques such as using special procedures to induce a bimodal grain size distributionReference Wang, Chen, Zhou and Ma73,Reference Witkin, Lee, Rodriguez, Nutt and Lavernia74 or conducting long-term agingReference Zhao, Bingert, Zhu, Liao, Valiev, Horita, Langdon, Zhou and Lavernia18 or annealingReference Han, Mohamed, Bampton and Lavernia75 in the post-processed condition.
Second, the present results were obtained only for the Al–7%Si alloy but the conclusion regarding the necessity of attaining high strains in processing is fully consistent with earlier reports.Reference Valiev, Alexandrov, Zhu and Lowe27–Reference Kumar, Xu and Langdon29 This suggests, therefore, that the approach probably has wide applicability. Furthermore, the use of the quantitative illustrations in Figs. 4 and 5 provides a simple but direct procedure for both predicting and achieving high strength and high ductility in a wide range of materials.
Third, the general applicability of this approach is well supported by a very recent demonstration of the occurrence of GBS at room temperature in ultrafine-grained Pd where the melting temperature is 1828 K.Reference Yang, Fecht and Ivanisenko76 In these experiments, the sliding was revealed in compression testing of Pd having a grain size of ∼135 nm by using in situ experiments which were conducted by directly installing a testing facility in a high-resolution field-emission SEM. These results confirm the potential for achieving GBS in UFG materials even at exceptionally low homologous temperatures.
V. SUMMARY AND CONCLUSIONS
1. The paradox of strength and ductility was critically examined by processing a cast Al–7%Si alloy by HPT under an imposed pressure of 6.0 GPa for up to 10 turns at a temperature of either 298 or 445 K. The results show that the average grain size decreases with increasing numbers of turns and the smallest grain size is ∼0.4 μm within the gage length of tensile specimens processed at a temperature of 298 K. The average size of the Si particles also decreases with HPT processing to ∼0.12 μm after 5 turns but there is a slight increase when the processing is continued to 10 passes.
2. All samples processed by HPT show higher strength than the unprocessed as-cast sample. When tested at relatively low strain rates, the samples processed to higher numbers of HPT turns simultaneously show higher ductility and higher strength by comparison with the unprocessed material.
3. New diagrams are developed which give a simple display of normalized stresses against normalized strains and provide a quantitative evaluation of the potential for achieving high strength and high ductility. The use of these diagrams is examined for samples processed by HPT at temperatures of 298 and 445 K.
4. High strength and high ductility is achieved in the Al–7%Si alloy at the smallest grain sizes after the largest numbers of HPT turns. The measured strain rate sensitivity for these conditions is ∼0.14 which suggests that the flow mechanism is a mixture of GBS and crystallographic slip. The occurrence of sliding is supported directly by topological observations using AFM.
5. The present results are also displayed on the traditional diagram for strength and ductility and they demonstrate the importance of increasing numbers of turns in HPT to achieve both high strength and high ductility.
ACKNOWLEDGMENTS
The authors would like to acknowledge the help of Mr. Devi Lal and Mr. Amit Kumar in data analysis and microscopy of fractured surfaces, respectively, and they thank Dr. Sarath Menon of Naval Postgraduate School, Monterey, CA, USA, for providing the cast Al–7%Si samples. This work was partially funded by a Seed Grant (Indian Institute of Science, Bangalore) to PK. The work was supported in part by the National Science Foundation of the United States under Grant No. DMR-1160966 and in part by the European Research Council under ERC Grant Agreement No. 267464-SPDMETALS.