

1. INTRODUCTION
Suprathermal electrons, produced in the high intensity femtosecond laser interactions with solids, are known to produce intense and very short pulses of characteristic Kα X-ray radiation. The study and the development of these and similar radiation sources is a present topic of much interest (Reich et al., Reference Reich, Uschmann, Ewald, Düsterer, Lübcke, Schwoerer and Gibbon2003; Park et al., Reference Park, Chambers, Chung, Clarke, Eagleton, Giraldez and Zhang2006; Riley et al., Reference Riley, Angulo-Gareta, Khattak, Lamb, Foster, Divall, Hooker, Langley, Clarke and Neely2005; Riley et al., Reference Riley, Khattak, du Sert, Clarke, Divall, Edwards, Foster, Hooker, Langley, Mistry, Nely, Smith, Spindloe, Tallants and Tolley2006), this stems from the wide range and important applications of these radiation sources. For example, plasma diagnostics by X-ray scattering (Gregori et al., Reference Gregori, Glenzer, Chung, Froula, Lee, Meezan and Sawada2006), ultra-fast time resolved diffraction measurements, (Sokolowski-Tinten et al., Reference Sokolowski-Tinten, Blome, Blums, Cavalleri, Dietrich, Tarasevitch and von der Linde2003), flash backlighting of dynamical systems connected to inertial confinement fusion (Bennett et al., Reference Bennett, Sinars, Wenger, Cuneo, Adams, Barnard and Speas2006), as well as different applications in chemistry and biology (Rischel et al., Reference Rischel, Rousse, Uschmann, Albouy, Geindre, Audebert and Antonetti1997; Neutze et al., Reference Neutze, Wouts, van der Spoel, Weckert and Hajdu2000). It is therefore of great importance to know and to be able to predict as best as possible the temporal profile of this radiation source which is most difficult to measure. As stressed in the medical physics literature, where the utmost accuracy is required, the more accurate and complete method of calculating electron slowing down is to include a detailed treatment of the secondary electrons (Kawrakov, Reference Kawrakov2000). In this paper we will show that in order to obtain the time dependent Kα radiation pulse more accurately, secondary electron emission should be included in the electron slowing down calculation. To the best of our knowledge this topic in general has not been treated in the literature.
Two recent publications dealing with the temporal profile of the Kα pulse in high intensity, sub-picosecond laser–plasma interaction are by Chen et al. (Reference Chen, Shepherd, Chung, Kemp, Hansen, Wilks and Beiersdorfer2007) and by Nilson et al. (Reference Nilson, Davies, Theobald, Jaanimagi, Mileham, Jungquist and Meyerhofer2012). The authors in the former paper measured pulse durations of the order of 15 ps from a thin foil. In their analysis these authors bring up the possibility that secondary electron emission can have a significant effect on the time duration of the Kα pulse. Based on this, Neumayer et al. (Reference Neumayer, Lee, Offerman, Shipton, Kemp, Kritcher and Glenzer2009) also suggested that secondary electrons might introduce additional effects in Kα emission modeling. In the following we examine the importance of secondary electron emission on the temporal shape of the pulse as well as on its magnitude.
In the more recent paper, Nilson et al. (Reference Nilson, Davies, Theobald, Jaanimagi, Mileham, Jungquist and Meyerhofer2012), measured pulse widths of the order of 6 ps, using a streak camera of 1.9 ps resolution, and in this experiment the trapped electrons were assumed to deposit all of their energy within the foil. By calculating the Kα emission, as the electrons slow down, they were able to infer mean initial electron energies, by comparing the measured temporal pulse with the calculated one. In doing so, these authors did not account for the effect of secondary electrons emission in their calculation. We will examine here the effect of including secondary emission on the temporal pulse for monoenergetic electron as well for sources with large energy spreads such as in the latter experiment. We will also attempt to estimate the time spent by the electron outside the foil.
The basic theory is given in Section 2, emphasizing the two different approaches for calculating electron slowing down, that which explicitly deals with secondary electron emission and that which does not. In Section 3 we provide results for the temporal profiles with and without secondary emission for thin foil configurations but mainly for foils of thickness larger than the electron range, the latter topic is stressed here. We conclude in Section 4.
2. THEORY
2.1. Electron slowing down
Energetic electrons slowing down within a given target predominately lose their energy by an extremely large number of collisions with target electrons. In order to reduce the required amount of computation, one abandons the complete and detailed description of particle histories and deals instead with condensed case histories, where for a given path length the energy loss is integrated over the given segment (Berger, Reference Berger1963). This is the simplest method for treating electron slowing down, and it is called the continuous slowing down approximation (CSDA).
As the electron moves through the medium colliding with target electrons the latter are set into motion with a wide range of recoil energies. It is now generally recognized that energetic secondary electrons thus produced cannot be overlooked. Indeed, the Monte Carlo software packages, which stress the accuracy of their energy deposition results, for example EGSnrc (Kawrakov, Reference Kawrakov2000), GEANT (Agostinelli, Reference Agostinelli, Allison, Amako, Apostolakis, Araujo, Arce and Howard2003), and Penelope (Baro, Reference Baro, Sempau, Fernández-Varea and Salvat1995) all account for the secondary electrons in the slowing down process.
A basic procedure, for including secondary electrons, is to employ the so called Class II hybrid scheme, see Schneider and Cormack (Reference Schneider and Cormack1959), and in particular Berger (Reference Berger1963). In this scheme, secondaries are incorporated within the continuous slowing down approximation. We will use this method here, in our calculations as outlined below. For the conditions encountered in these types of experiments plasma effects on the stopping of electrons are neglected (Nardi & Zinamon, Reference Nardi and Zinamon1978).
2.2. Calculating secondary electron emission
We have investigated the secondary electron emission using the procedures described in detail in the Appendix of the review paper by Berger (Reference Berger1963). Secondary emission in the slowing down process is due to the so called “catastrophic collisions”, in which a non-negligible fraction, denoted by ε, of the fast electron energy, is imparted to a target electron. Calculation of the probability for secondary electron production with energy transfer greater than ε, based on the Moller cross-section as formulated by Rohrlich and Carlson (Reference Rohrlich and Carlson1954), is given by Berger (Reference Berger1963). This formula was derived for free electrons. Due to the relatively low values of the electron binding energies (less than 5 keV for the Ti target) compared with the bombarding energies, the free electron approximation here is of sufficient accuracy.
The probability per unit path length, μc for electron-electron scattering with fractional energy transfer ε > εth where εth is the threshold for energy transfer, is given by (Berger, Reference Berger1963),
 $${{\rm \mu} _{\rm c}} = {\rm NZC/}E\; H({{\rm \varepsilon} _{{\rm th}}})$$
where N is the number of atoms per cm3, Z is the atomic number, E is the electron energy, τ is the kinetic energy in units of mc2, C = 2πe/mv2 and for the given threshold ε,
 $$\eqalign{H({\rm \varepsilon}) & = 1/{\rm \varepsilon} - \, 1/(1 - {\rm \varepsilon}) + {[\tau/(\tau + 1)]^2}(0.5 - {\rm \varepsilon} ) \cr & \quad \, -(2\tau + 1)/{(\tau + 1)^2}\; {\rm log}[(1 - {\rm \varepsilon} )/{\rm \varepsilon} ]}$$
Secondary emission is calculated as the electron slows down. At each energy E, we set εth such that it is equal to E th/E, where the threshold energy E th, is the electron energy above which secondary electron emission is followed in detail.
Within the interval dx, the probability for secondary emission with ε > εth is μc(εth) dx. By random number sampling, we determine whether secondary emission occurs in dx. The value of ε cannot exceed 0.5, since both scattered and target particles are identical.
Should secondary emission occur, we determine ε, whose range is εth < ε < 0.5, by direct Monte Carlo sampling of the Moller cross-section given by (Berger, Reference Berger1963),
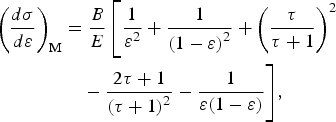 $$\eqalign{{\left( {\displaystyle{{d{\rm \sigma}} \over {d{\rm \varepsilon }}}} \right)_{\rm M}} & = \displaystyle{B \over E}\left[ {\displaystyle{1 \over {{{\rm \varepsilon }^2}}} + \displaystyle{1 \over {{{(1 - {\rm \varepsilon })}^2}}} + {{\left( {\displaystyle{{\rm \tau} \over {{\rm \tau} + 1}}} \right)}^2}} \right. \cr & \quad - \displaystyle{{2{\rm \tau } + 1} \over {{{({\rm \tau} + 1)}^2}}} - \displaystyle{1 \over {{\rm \varepsilon }(1 - {\rm \varepsilon })}}\Bigg],}$$
where, τ is the kinetic energy in units of the rest mass and B a constant, proportional to one over the velocity squared.
The time, energy, and as well as the position along the primary electron path of the point of emission of these recoils are stored for processing. After completing the calculation for the primary beam, the stored secondary emitted electrons are processed. Finally it should be noted that in the literature connected to biological applications, secondary electron emission is treated in a more elaborate manner (Bousis et al., Reference Bousis, Emfietzoglou, Hadjidoukas and Nikjoo2008).
2.3. Present calculations
The electron track is divided into small predetermined path lengths dx, where energy loss is calculated by the CSDA. In this interval the probability of Kα emission is also calculated as discussed below. We find it unnecessary in the present work to follow in detail electron motion, specifically not accounting for multiple scattering.
We distinguish here between the two different schemes regarding the treatment of secondary electrons. In the first secondary electrons with energies greater than εth are emitted and their trajectory followed, generating Kα radiation as they slow down. This is the so called Class II scenario (Berger, Reference Berger1963). In the second scheme, secondary emission is not dealt with specifically and the energy loss of the beam due to them is incorporated within the CSDA, with their energy locally deposited. This is the simplified Class I method, the CSDA energy loss dE/dx, must clearly be different between both cases.
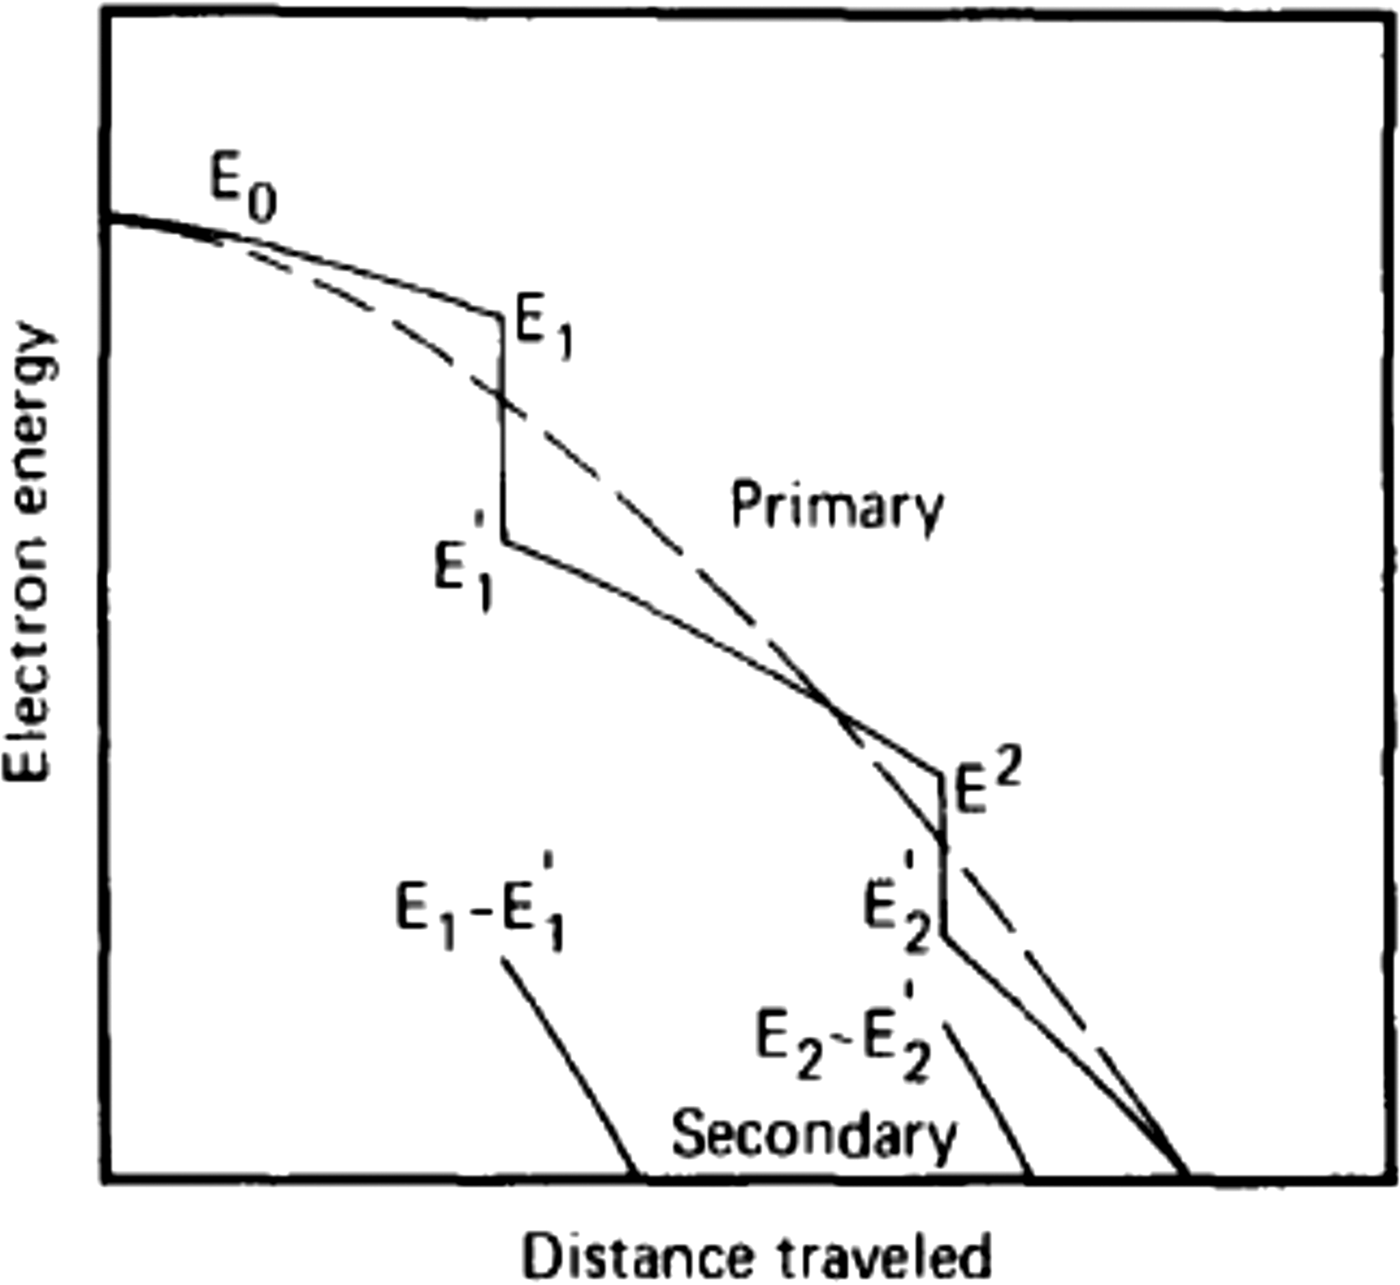
The Class I versus Class II procedures are well illustrated in Figure 1 by the graph adopted from Schneider and Cormack (Reference Schneider and Cormack1959), where the dashed line shows the energy as a function of distance within the regular Class I CSDA. The full curve gives the primary electron energy within the Class II scheme. The energy decreases here continuously, between the knock on or so called “catastrophic collisions” in which a secondary electron is produced. We note here that the two trajectories terminate at the same point.
Schematic illustration of the electron energy versus path length in the Class II hybrid model compared with the Class I scheme adapted from Schneider and Cormack (Reference Schneider and Cormack1959).

For the Class II case, with secondary emission followed along the electron track in between catastrophic collisions, energy loss within the CSDA is calculated by means of the “restricted” stopping power. Berger (Reference Berger1963) gives the “restricted” continuous slowing down part of the stopping, dE/dx, based on the Bethe stopping theory for soft collisions, and with the assumption that εth is sufficiently small he obtains,
 $$dE\,/\,dx = - {\rm NZC/}E\, [{\rm log}(2{E^2}{{\rm \varepsilon} _{{\rm th}}}({\rm \tau} + 2)/{I^2}) - {{\rm \beta} ^2}]$$
where, I is the so called mean excitation energy, which is obtained from atomic theory and is tabulated. For each path length interval, the procedure for secondary electron emission as outlined above is employed, where one stores and later processes the generated secondary electrons. This procedure is widely used in the literature for example Murata et al. (Reference Murata, Kyser and Ting1981), Andreo and Brahme (Reference Andreo and Brahme1984).
Berger (Reference Berger1963) also gives dE/dx for the Class I continuous slowing down calculation, where by essentially combining Eq. (3) with Eq. (4), he takes into account the effect of the secondary emission incorporating it into the stopping formula, thus,
 $$dE\,/\,dx = - {\rm NZC}\,/\,E\, [{\rm log}\,{E^2}(\tau + 2)/{I^2} + {\,f^-}(\tau, {{\rm \varepsilon} _{\rm u}})\; + {\rm \delta} ]$$
with,
 $$\eqalign{& {\,f^-}(\tau, {{\rm \varepsilon} _{\rm u}})\; = - 1 - {{\rm \beta} ^2} + {[\tau\,/\,(\tau+ 1)]^2}{{\rm \varepsilon} _{\rm u}}^2 /2 + (2\tau + 1)/ \cr & \quad {(\tau + 1)^2}\; {\rm log}(1 - {{\rm \varepsilon} _{\rm u}}) + {\rm log}[4{{\rm \varepsilon} _{\rm u}}(1 - {{\rm \varepsilon} _{\rm u}})] + 1/(1 - {{\rm \varepsilon} _{\rm u}})} $$
Here εu is the maximum possible recoil energy, in this case ½. Equation (5) is the equation used to generate electron range and energy loss tables (Berger & Selzer, Reference Berger and Selzer1964). The density correction δ is neglected here.
In the following, electron slowing down with Kα emission will be carried out using the Class II method, that is, bringing into account detailed secondary emission. For comparison and this being the main theme of the paper, slowing down with Kα emission will also be followed using the Class I scheme, where secondary emission is not specifically treated but is accounted for within the CSDA. In this second scenario we make use of Eq. (5), which is formulated as a continuous slowing down calculation, incorporating within it secondary emission. It should be borne in mind that Eq. (5) approximates secondary emission as a continuous process and therefore is valid for evaluating energy loss and range. It is less satisfactory as we show here below for the calculation of the temporal dependence of Kα radiation which requires specific treatment. It is important to note in connection with the results presented below that straggling within the CSDA, is not included neither in the Class I nor Class II schemes.
At each interval dx, the probability for Kα emission is also calculated using the cross-sections derived from Patoary et al. (Reference Patoary, Alfaz Uddin, Haque, Basak, Talukder, Karim and Saha2008) and which are based on the Binary Encounter Approximation (BEA). The secondary electrons are set into motion at their point of emission. As noted above we do not follow in detail the motion of secondary electrons. The secondary electrons at emission are assumed here to move in the direction of the primary electron. The electron path is followed within the thin target up to its edge. We note that the range of a 30 keV secondary is only about 6 µm, but higher energy recoils could escape a thin target.
Setting the threshold energy for secondary emission, E th is not a trivial problem. On the one hand E th should be as small as possible in order to generate more secondary electrons, thus improving the accuracy of the calculation. These electrons are generated by using the Moller cross-section which assumes that the target electrons are free. However, the Kα production cross-section is calculated here on the basis of BEA theory which assumes collisions with bound electrons. The BEA cross-section is obtained by integrating over the transferred electron energies from the minimum energy for Kα production, E min, up till the maximum energy transfer E max. In our modeling in this presentation, for energies above E th, the projectile electron collisions (the catastrophic collisions) are treated using the Moller free electron cross-sections, as done by Berger (Reference Berger1963). We thus require that the Moller cross-section for producing holes in the K shell from E th up till E max is well approximated by the BEA cross-section used for computing Kα production, in this energy range. But in fact for high enough energies, the BEA and Moller cross-sections agree with each other in a sufficiently accurate manner (Murata, Reference Murata, Kyser and Ting1981). Thus with a high enough value of E th our modeling is of sufficient accuracy.
In the following we look into the dependence of the Kα yield on the value of E th in the region between 20 and 35 keV taking note that the K edge for Ti is at 4.966 keV, which is essentially E min. We define Kα primary as the number of generated Kα-s by the primary beam, whose energy is depleted during the slowing down process due to secondary electron emission. Increasing E th brings about a moderate rise in “Kα primary”, while on the other hand, it causes a decrease in the number of produced secondaries thus lowering the Kα yield due to secondary electrons. The calculations give a relatively weak dependence of “Kα primary” and of the secondary generated Kα-s on the value of E th between 20 and 35 keV. The total Kα yield for E th at 35 and 20 keV are equal within 2%.
In the results to be presented here we take E th = 25 keV, 5 times the threshold for Kα emission. This value is a compromise between the accuracy of our model and the more accurate Kα yield, noting however the rather weak dependence of the Kα yield on the value of E th.
3. RESULTS
3.1. Targets studied
The temporal profile and yield of Kα emission is calculated for two different Titanium target configurations. For each of these targets the radiation will be calculated as discussed above with and without the detailed following of secondary electron emission.
The first and the mainly emphasized target is a “thick” target, in the present work it refers to electrons slowing down and depositing all of their energy within the target (in radiation physics thick targets pertain to targets of thickness of several radiation lengths). Furthermore, with the experiment of Nilson et al. (Reference Nilson, Davies, Theobald, Jaanimagi, Mileham, Jungquist and Meyerhofer2012) in mind, the Kα radiation is viewed from the entire target with self-absorption within the target not accounted for. In this experiment the thin foil target is also of small lateral dimensions and the electrons are trapped and continuously reflux as a result of the generated electrostatic fields. This continues until the electrons lose all of their energy within the target (Nilson et al., Reference Nilson, Davies, Theobald, Jaanimagi, Mileham, Jungquist and Meyerhofer2012). Such targets are preferable as radiation sources where high flux and small dimensions are required.
The second type target is a thin target of the order of 30 µm, much less than the range of a 1 MeV electron, see below. Such a target roughly describes experiments such as that of Zastrau et al. (Reference Zastrau, Audebert, Bernshtam, Brambrink, Kampfer, Kroupp, Loetzsch, Maron, Ralchenko, Reinholz, Ropke and Sengebusch2010) and of Chen et al. (Reference Chen, Shepherd, Chung, Kemp, Hansen, Wilks and Beiersdorfer2007) where we add thickness to the foil to account for refluxing. In the case of this target we are assuming an experiment where the Kα radiation is observed not from the whole target but from a limited area around the central axis.
3.2. “Thick” target – effect of secondary electrons
In this type of target we will stress the change in the temporal Kα pulse due to the detailed inclusion of secondary electron emission. Thus, slowing down is calculated using the two procedures described above. The first allows for following secondary emission, using Eqs. (1) and (2), while for the CSDA part of the stopping we use Eq. (4) for the restricted stopping of dE/dx. This is compared with slowing down with no detailed accounting of secondary emission, using Eq. (5) for the specific energy loss, with no energy loss straggling. Results are given for 1 and 4 MeV monoenergetic electron sources, incident normally on the Ti target surface. Following this we provide results for a Maxwellian electron spectrum as encountered in laser–plasma interactions.
Figure 2 gives the first and second generation secondary electron spectra for 10,000 source electrons at the energy of 1.0 MeV. As to be expected both the spectra rapidly decrease with increasing energy. The threshold for the first generation secondary emission is 25 keV, as can be observed in Figure 2. In this calculation 1.9 secondary electrons per incident beam electron are emitted constituting 13% of the incoming energy. The second generation electrons are emitted with no constraint on the threshold energy. These electrons contribute less than 1% to the Kα signal, hence we will present below the temporal Kα pulse where the first generation secondaries deposit all of their energy in the target with no further emission of secondaries.
First and second generation secondary electron spectra, in black and blue, respectively, for 1.0 MeV electrons from the thick Ti target. Threshold energy for secondary emission is 25 keV.
Time dependent Kα emission in the two scenarios, for the 1 MeV electron source is given in Figure 3 for 20,000 source electrons. The curve with the “Bragg peak” structure in black is for the case where secondary electron emission is not treated in detail (Class I). This peak reflects the Kα production cross-section as a function of energy recalling that straggling is not included in the calculation. The other two curves pertain to the scenario where the details of secondary emission are dealt with (Class II). Of these, the top one in blue, is the Kα emission from the primary, energy depleted incoming beam, which in addition to losing energy by means of the restricted CSDA also has its kinetic energy degraded due to secondary electron emission. Kα emission from the first generation secondary electrons is plotted in green well below the primary blue curve.
Kα pulse as a function of time, 1 MeV electrons, slowing down in a thick Ti target, with E thr = 25 keV. The radiation calculated from the secondary electron emission Class II scheme is plotted here, where the blue curve gives the Kα pulse from the primary beam and below that in green from the first generation secondary electrons. The black curve with the “Bragg Peak” structure is the Kα emission when secondary emission is not treated in detail.
The total temporal Kα pulse of primary plus secondary Kα pulse of the Class II method is plotted in blue and is compared with the no secondary scenario Class I calculation in Figure 4 for the 1 MeV electron source. Two points should be stressed; the total Kα yield in the Class II scenario is 15% larger than when secondary electrons are not followed, due to the additional contribution of the generated secondary electrons. Secondly, there is a basic difference between the “Bragg peak” like Class I pulse shape as compared with the somewhat but not significantly longer and smooth Class II shape. The random nature of the secondary emission in the Class II scheme introduces electron range straggling. Thus the electron track length has a finite range distribution with an appreciable amount of ranges larger than that of the Class I scheme which here has no straggling. The range for the 1 MeV electrons in the Class I scheme is 0.1265 cm, while in the Class II scheme the average is 0.124 cm, in satisfactory agreement. In this context we present in Figure 5 the range distribution in the Class II calculation, the statistical nature of the ranges is manifested in the temporal distribution.
Kα pulses as a function of time for a thick Ti target source of 1 MeV electrons with E thr = 25 keV. Total radiation in the secondary emission scenario from the primary beam plus first generation electrons is plotted in blue. In black, the curve with the Bragg peak structure is the radiation from the beam slowing down with secondary emission not treated in detail.
Range distribution of 1 MeV electrons slowing down in a Ti target in the Class II hybrid scheme, with E thr = 25 keV.
The likes of Figures 3 and 4 for the temporal Kα pulse for 1 MeV electrons are plotted in Figures 6 and 7 for the higher energy 4 MeV electron source. The basic patterns in the latter graphs are similar to those of Figures 3 and 4 but with a larger contribution by the secondary electrons. At this energy, with E th = 25 keV, 7.9 secondary electrons per beam electron are created during the slowing down consisting of 19% of the incident energy. The total Kα yield in the Class II scenario is calculated to be 19% larger than when secondary electrons are not followed, due to the additional contribution of the generated secondary electrons. The range for the 4 MeV electrons in the Class I scheme is 0.564 cm, while in the Class II scheme it is 0.562 cm, in excellent agreement although 19% of the incoming beam energy is lost to recoil in the Class II calculation. This indeed furnishes proof of the validity of the restricted stopping energy loss formula.
Kα pulse as a function of time, 4 MeV electrons, slowing down in a thick Ti target, with E thr = 25 keV. The radiation calculated from the secondary electron emission Class II scheme is plotted here, where the blue curve gives the Kα-s from the primary beam and below that in red from the first generation secondary electrons. The black curve with the “Bragg Peak” structure is the Kα emission when secondary emission is not treated in detail.
Kα pulses as a function of time for a thick Ti target source of 4 MeV electrons with E thr = 25 keV. Total radiation in the secondary emission scenario from the primary beam plus first generation electrons is plotted in blue. In black, the curve with the Bragg peak structure is the radiation from the beam slowing down with secondary emission not treated in detail.
We now address the structure obtained in the Class I calculation for the monoenergetic electrons which is characterized by the “Bragg peak” structure. In reality electron beams whether generated by accelerators or lasers are of finite energy width. In Figure 8 we provide results for the Gaussian energy smearing of the incident electron source for 1 MeV electrons, with σ = 0, 50, 100, and 200 keV. For σ = 50 keV we still have a “Bragg peak” structure while for 100 keV the curve flattens and for 200 keV the temporal pulse much resembles that with secondary electron emission as depicted in the previous graphs and which we assume to be that representing the temporal pulse with straggling. Thus for beams with an energy spread of less than 5% calculating the temporal pule using the simplified Class I scheme with no straggling will not be accurate.
Dependence of Kα temporal pulse shape for 1 MeV source electrons, on the width of the Gaussian energy distribution, in the Class I scheme where secondary electrons are not followed in detail. The highest and narrowest peak is for σ = 0, while the next 2 curves in decreasing order of magnitude in red and brown are for σ = 50 and 100 keV, respectively. The lowest magnitude curve where the peak is smeared is for σ = 200 keV.
Finally, we compare the temporal pulses with and without accounting in detail for secondary emission for a Maxwellian electron spectra of the form ~exp(−E/T). The results are given in Figure 9 for T = 1 MeV, relevant to the experiment of Nilson et al. (Reference Nilson, Davies, Theobald, Jaanimagi, Mileham, Jungquist and Meyerhofer2012). The “Bragg peak” effect observed above in the Class I scheme was washed out and the Class I and Class II schemes gave very similar shaped graphs. The total numbers of Kα photons in the Class II scheme is higher by 15% compared with the Class I calculation.
Kα pulses as a function of time for a thick Ti target source for a Maxwellian spectrum with T = 1 MeV. Total radiation in the Class II scheme from the primary beam plus first generation electrons is plotted in blue. In red, the lower curve, the radiation from the beam slowing down with secondary emission not treated in detail (Class I).
The Maxwellian temperature in the Nilson et al. (Reference Nilson, Davies, Theobald, Jaanimagi, Mileham, Jungquist and Meyerhofer2012) experiment was obtained by comparing the measured Kα temporal shape to that calculated by the Class I scheme, assuming that the time spent by the electrons outside the target during recirculation is negligible. Based on our reflux modeling in a very recent paper (Nardi et al., Reference Nardi, Zinamon and Maron2015), we examined the time spent outside the target by a 1 MeV electron, penetrating a 25 µm micron foil, as it refluxes back into the target. We denote by z the distance from the edge of the foil into the vacuum in the direction of the axis of symmetry of the foil, which is also the direction of the beam propagation. The electric field strength E(z) in this modeling is given by,
 $$\eqalign{& {\bf E}(z) = {{\bf E}_0}/({\rm 1} + z/{l_{\rm s}}),{\rm with} V\, \cr & \quad \hbox{the restoring potential given by},\;{\bf V} = \textstyle\int {\bf E}\; dz}$$
In the present calculations as also presented in Nardi et al. (Reference Nardi, Zinamon and Maron2015), l s = 2 µm, based on measurements of Romagnani et al. (Reference Romagnani, Fuchs, Borghesi, Antici, Audebert, Ceccherini, Cowan, Grismayer, Kar, Macchi, Mora, Pretzler, Schiavi, Toncian and Willi2005) and is of the order of the “local” electron Debye length (Passoni & Lontano, Reference Passoni and Lontano2004). E0 can be varied and determines the value of the restoring potential. In the present calculations E0 was set so as to give a restoring potential of 2.5 MeV. This potential is not self-consistent with the energy of the electron beam, but could be viewed as representative of the potentials in these types of problems. In this context we note that Passoni and Lontano (Reference Passoni and Lontano2004), as well as Hatchett et al. (Reference Hatchett, Brown, Cowan, Henry, Johnson, Key, Koch, Langdon, Lasinski, Lee, Mackinnon, Pennington, Perry, Phillips, Roth, Sangster, Singh, Snavely, Stoyer, Wilks and Yasuika2000) obtain that the electric field is proportional to the fast electron temperature. The transit time of the incoming beam through the foil is 88 fs while the time the electron spends refluxing back into the target is calculated for the above conditions to be 30 fs. The latter result can be viewed as representative of the time the electron refluxes and cannot be neglected and must be accounted for when connecting between the measured temporal pulse and the calculated slowing down time. Future work should attempt to calculate self-consistent potentials as well as the dependence of these potentials on the transverse dimension.
3.3. Thin target – effect of secondary electrons
We provide here the results for the effect of secondary emission on the Kα intensity for a thin Ti target of thickness 32 µm. This thickness is chosen with the experiment of Chen et al. (Reference Chen, Shepherd, Chung, Kemp, Hansen, Wilks and Beiersdorfer2007) in mind where the target is a 12.5 µm Ti foil. The additional foil thickness, of a factor of 1.6 times the foil thickness in the experiment was added in order to account for multi-refluxing. This number is based on our simplified but quantitative modeling of multi-refluxing (Nardi et al., Reference Nardi, Zinamon and Maron2015), where the energy deposition of the first six refluxing steps, within the central 160 µm area of the foil gave an increase in energy deposition of 1.6 times that of the primary beam. Thus the path length of 32 µm for the beam transit is assumed. In the experiment that we are calculating here, we observe the Kα radiation from the central foil area of radius of the order of 150 µm.
Figure 10 plots the temporal pulses in the Class II approaches for 200,000 source electrons at the energy of 1.0 MeV. The threshold for secondary emission is again 25 keV. The rectangular upper curve describes the Kα-s from the primary 1 MeV beam, traversing the foil and which is essentially the same as in the Class I approach where secondary emission is not followed (The average energy of the high energy electrons traversing the foil is slightly lower in the Class II scheme as compared with the Class I scheme). The low energy secondary electrons diffuse in the target under two different extreme assumptions: In the first they are emitted in parallel to the primary beam and undergo no scattering, exiting the target at its edge. In this case the secondaries contribute an additional 5% to the Kα pulse, see the lower shorter duration pulse in red. In the second assumption, which is an upper limit, each secondary electron deposits all of its energy within the foil. In this manner we account in an exaggerated way for multi-scattering which is very appreciable for these low energy electrons (Murata et al., Reference Murata, Kyser and Ting1981). Here the secondaries contribute an additional 20% to the Kα pulse with a very long low tail due to the long slowing down time of the secondaries as they deposit all of their energy within the foil. A fuller calculation and not necessarily within the context of this work, would include multiple scattering as well as following the refluxing motion of the low energy secondaries.
Temporal Kα pulse for the 32 µm thick Ti target in the Class II scheme. Top curve, black, temporal pulse of primary beam traversing the foil. Bottom, shorter curve in red secondary contribution to Kα pulse for secondaries moving in tandem with the primary beam and exiting the foil at its edge. Bottom longer curve in blue, secondary contribution to Kα pulse assuming that these deposits are all of their energy in the foil.
4. CONCLUSIONS
Accounting for secondary electron emission is a more complete method of simulating electron slowing down, and should be the one adopted in laser–plasma interactions, when calculating the temporal pulse. As noted above secondary emission, is included in the advanced Monte Carlo software simulation packages, Penelope, EGS4, and GEANT which are constructed with the maximum possible accuracy for determining energy deposition. (In these codes ε is assumed constant during slowing down and does not vary with the projectile energy as in the present paper). As pointed out by Kawrakov (Reference Kawrakov2000), the ITS code used by the laser plasma community is not a Class II code. Thus it is of importance to examine in general the importance of using the Class II scheme on the Kα temporal pulse, a topic which to our knowledge has not been generally addressed in the context of laser–plasma interactions. We note here that the possible significant impact of secondary electrons on the Kα temporal pulse was brought up by Chen et al. (Reference Chen, Shepherd, Chung, Kemp, Hansen, Wilks and Beiersdorfer2007), this point was investigated here.
We have developed here a procedure for calculating Kα emission in the Class II scheme, where we generate and follow the secondary electrons calculating their contribution to the temporal Kα pulse along with that of the primary electrons. Guided by experiments two types of targets were studied, the first a “thick” target, where all the primary beam energy is deposited and the second a “thin” foil target, where the electrons traverse the target and where we approximate the effect of refluxing. In the former case for 1 MeV electrons a flux increase of 15% is calculated, while for 4 MeV electrons the increase is 19% when employing the Class II scheme compared with the simpler Class I scheme. For monoenergetic beams with a small energy spread the temporal Kα pulse calculated by the Class II scheme gives results different from that of the Class I scheme where a “Bragg peak” is observed. This is due to the inclusion of straggling in the former case which is not included in the Class I scheme as is presented here in its simplified form. It will be of interest to calculate the temporal profile within the Class I scheme with a proper inclusion of straggling, a procedure which complicates the simplified Class I scheme as used for example by Nilson et al. (Reference Nilson, Davies, Theobald, Jaanimagi, Mileham, Jungquist and Meyerhofer2012). For electron sources with appreciable energy spread the “Bragg peak” effect is washed out, using the simplified Class I scheme, for example a Maxwellian energy spectrum.
The effects outlined in this paper in connection with secondary electrons should certainly increase as higher energy electron sources come into play, Mangles et al. (Reference Mangles, Murphy, Najmudin, Thomas, Collier, Dangor and Krushelnick2004). We also note that a more accurate result for the Class II scheme could perhaps be obtained by including straggling within the Class II CSDA calculation (Andreo & Brahme, Reference Andreo and Brahme1984). However, these authors point out that this procedure gives a negligible contribution provided that the threshold for secondary emission is relatively small as is the case here.
In the case of the thin foil target and looking at the area around the central axis of the target, secondary emission does not have a significant impact on the temporal Kα pulse. In the upper exaggerated limit case for secondary electron deposition, a 20% increase in total intensity is calculated which is however smeared in the form of a long and very low amplitude pulse.
ACKNOWLEDGEMENT
This work was partially supported by the Minerva Foundation (Germany), grant #711741.