Implications
In temperate climates, grazed grass is usually the cheapest feedstuff available to beef producers. Inclusion of a grazing period before finishing would decrease the cost of bull beef production, which is traditionally based on a high concentrate ration fed indoors. This modification of the traditional production system led to a decrease in intramuscular fat (IMF) and collagen solubility which resulted in a decrease in a sensory panel’s evaluation of tenderness, flavour liking and overall liking. However, the age of the bulls at slaughter had a relatively small influence on sensory tenderness.
Introduction
Traditionally in Ireland, most male cattle were slaughtered as steers (Bord Bia, 2011). Recently, there has been an increase in the proportion of male animals slaughtered as bulls (Bord Bia, 2011) due to their comparative production advantages (O’Riordan et al., Reference O’Riordan, Crosson and McGee2011). Typically, production systems for suckler bulls involve weaning at about 8 months and finishing indoors on a diet of ad libitum concentrates and minimal roughage. In Ireland, the cost of conserved grass is frequently lower than that of alternative feedstuffs, whereas grazed grass is the cheapest feedstuff available to producers (Finneran et al., Reference Finneran, Crosson, O’Kiely, Shalloo, Forristal and Wallace2011). The inclusion of a conserved grass and/or a grazing period before slaughter is desirable from a cost of production perspective.
In addition to its economic attractiveness, beef from pasture-based production systems is increasingly appreciated by consumers due to its ‘green’ image (Grunert et al., Reference Grunert, Bredahl and Bunsæ2004) and favourable fatty acid composition (French et al., Reference French, Stanton, Lawless, O’Riordan, Monahan, Caffrey and Moloney2000; Baublits et al., Reference Baublits, Pohlman, Brown, Johnson, Rule, Onks, Murrieta, Richards, Sandelin, Loveday and Pugh2006). However, incorporating a grazing period would also likely increase the age at slaughter, which may negatively influence the sensory characteristics of beef, especially tenderness (Sinclair et al., Reference Sinclair, Cuthbertson, Rutter and Franklin1998; Bures and Barton, Reference Bures and Barton2012). Alterations in the appearance or sensory characteristics of bull beef produced in this way could have a negative impact on the attractiveness of the beef to consumers accustomed to beef from the ‘traditional’ production system. However, Cerdeno et al. (Reference Cerdeno, Vieira, Serrano, Lavın and Mantecon2005) indicated that it was possible to improve the sensory qualities of beef from grass-based systems, by allowing a finishing period on concentrate diets, whereas at the same time retaining the advantages of grass feeding. Similarly, studies on steers and dairy bulls by McCaughey and Cliplef (Reference McCaughey and Cliplef1996) and Vestergaard et al. (Reference Vestergaard, Therkildsen, Henckel, Jensen, Andersen and Sejrsen2000), respectively, showed that animals raised on grass and finished on concentrate diets for 2 to 3 months produced beef with similar desirable sensory quality to intensively fed animals.
The effect of such modifications and their associated increase in slaughter age on quality of beef from suckler bulls has not been widely studied. The primary objective of the current study was, therefore, to examine the influence of inclusion of grass silage or grass silage followed by grazed grass, before finishing on concentrates, on organoleptic and biochemical indicators of beef quality. A range of carcass weights (CW) is required by the various markets for bull beef; therefore, a second objective was to investigate the effect of CW on beef quality within the modified production systems. It was hypothesised that feeding on silage and pasture before finishing on concentrates would produce beef with a sensory quality as acceptable as beef from animals housed indoors and fed concentrates.
Material and methods
Animals and management
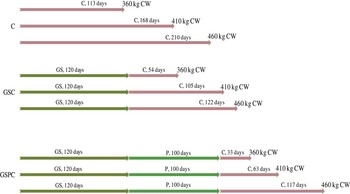
As part of a larger study described by O’Riordan et al. (Reference O’Riordan, Crosson and McGee2011), 126 weaned Charolais and Limousin-sired suckler bulls were purchased at livestock marts in Ireland at ~8 months of age during October/November, acclimatised to slatted floor accommodation and offered grass silage ad libitum plus 2 kg/head per day of a barley-based concentrate. In early December, animals were assigned at random to a 3 production system (PS)×3 CW factorial arrangement of treatments (Figure 1) balanced for sire breed and birth date, with 14 bulls (nine Charolais-sired and five Limousin-sired) in each treatment group. The three PS were (1) ad libitum concentrates (860 g/kg rolled barley, 60 g/kg soya bean meal, 60 g/kg molasses and 20 g/kg minerals/vitamins) plus 1.5 kg grass silage dry matter daily until slaughter (C), (2) grass silage (GS) ad libitum plus 1.5 kg C daily for 120 days followed by ad libitum concentrates until slaughter (GSC) or (3) GS ad libitum plus 1.5 kg C daily for 120 days, followed by 100 days grazing and then ad libitum concentrates until slaughter (GSPC). There were four pens of animals (three or four animals per pen) when indoors. The three target CW within each PS were 360, 410 and 460 kg. Within each PS, groups were assigned at the beginning of the study for slaughter when the group mean reached the live weight to achieve the target CW. A 3-week period was allowed for animals to adjust to the concentrate diet and their weight was regularly recorded. The bulls were slaughtered at a commercial abattoir (Kepak Group, Clonee, County Meath, Ireland). The experimental design could have required nine separate slaughter events depending on the growth of the animals in the various PS. In the event, due to overlap of two target CW across PS on two occasions, seven slaughter events were required. The study was carried out under license from the Irish Government Department of Health and Children and all procedures used complied with national regulations concerning experimentation on farm animals.
Schematic illustration of the 3 production systems (PS)×3 carcass weights (CW) factorial arrangement of treatments. The three PS were: C=concentrate, GSC=grass silage (GS) followed by C, and GSPC=GS followed by pasture (P) and then C; and three CW were: 360, 410 and 460 kg.

Carcass trait measurements and sample collection
Carcass grade and fat colour measurement
Post-slaughter, carcasses were weighed and graded for conformation (15-point scale, classes E+ (highest) to P− (lowest), E+ is 15) and fatness (15-point scale, scores 5+ (highest) to 1− (lowest), 5+ is 15) according to the EU Beef Carcass Classification Scheme (Anon, 2004). Carcasses were then chilled under factory conditions. Subcutaneous fat colour (L, a, b) was measured (48 h postmortem) using a Miniscan XE Plus (Hunter Associates Laboratory Inc., Reston, VA, USA). Fat colour was measured at two positions: (1) lower round/rump region: in an area on the proximal pelvic limb posterior to the last lumbar vertebra and extending to the penultimate sacral vertebra and (2) 13th rib region. Measurements were taken within 10 cm lateral to the midline of the carcass, but avoiding areas of conspicuous pebbling. Duplicate measurements of lightness, ‘L’, redness, ‘a’ and yellowness, ‘b’ values were made on non-overlapping zones of each site, and hue angle, ‘h°’, (i.e. [tan−1(b/a)][180/π]) and chroma, ‘C’ (i.e. √(a 2+b 2)) were calculated from ‘a’ and ‘b’ values. All measurements were made using the D65 illuminant.
Carcasses were cut at the 5th/6th rib interface 48 h postmortem. Meat colour grades were assessed by abattoir personnel (after a blooming time of 1 h at 4oC) who routinely use Meat Standards Australia colour sticks for this purpose (Anon, 2005). The meat colour sticks, labelled as 1A (extremely bright red), 1B (very bright red), 1C (moderately bright red), 2 (slightly bright red), 3 (red), 4 (slightly dark red), 5 (moderately dark red), 6 (very dark red) and 7 (extremely dark red) were assigned values of 1 to 9 (where 1 is 1A, i.e. extremely bright red) for statistical analysis.
pH measurement
The ultimate pH of the longissimus thoracis (LT) muscle was measured at 48 h postmortem by making a scalpel incision in the muscle at the 5th rib and inserting a glass electrode (Model EC-2010-06; Amagruss Electrodes Ltd, Westport, Ireland) attached to a portable pH metre (Model no. 250A; Orion Research Inc., Boston, MA, USA) ~2.5 cm into the muscle. The metre was calibrated using standard phosphate buffers (pH 4.01 and 7.00, Radiometer, Copenhagen, Denmark). The electrode was rinsed with distilled water between measurements.
Sample collection
At 48 h postmortem, samples of the LT muscle were excised (from the 10th rib area), vacuum packed, aged for 15 days at 2°C, and stored at −18°C before compositional, collagen and sensory analysis.
Compositional and collagen analyses
Thawed samples of LT (4°C overnight) were homogenised using a Robot coupe blender (R301 Ultra; Robot coupe SA, Vincennes, France). Sub-samples (20 g) were dispensed into plastic tubes (100×150 mm, McDonnells, Dublin, Ireland) and re-frozen for subsequent collagen analysis. Moisture and IMF contents were determined using the SMART Trac rapid fat analyser (CEM Corporation, Matthews, NC, USA) using Association of Official Analytical Chemists (AOAC, 1990) Methods 985.14 and 985.26, respectively. Protein concentration was determined using a LECO FP328 (LECO Corp., St. Joseph, MI, USA) protein analyser based on the Dumas method and according to AOAC method 992.15 (AOAC, 1990). Ash was determined by incinerating samples in a furnace (540°C overnight).
Total and heat-soluble (77°C, 65 min) collagen concentrations were determined by quantitative determination of hydroxyproline by a colorimetric reaction as described by Kolar (Reference Kolar1990).
Sensory analysis
The sensory analysis was carried out using a 10-person trained taste panel who had been selected for their sensory acuity using the methods outlined in British Standards Institution (BSI, 1993). The samples were thawed overnight at 4°C, cut into 20 mm thick steaks and grilled on pre-coded foil-lined grill pans under preheated, domestic low-level grills, turning every 3 min until the centre temperature of 74°C (measured by a thermocouple probe at the geometrical centre of the sample) was reached. All fat and connective tissue was trimmed and the muscle cut into blocks of 2 cm3, which were wrapped in pre-labelled foils and placed in a heated incubator until given to the assessors. Samples were tasted in an order based on the designs outlined by MacFie et al. (Reference MacFie, Bratchell, Greenhoff and Vallis1989) for balancing carryover effects between samples. Thus, each panellist received six samples in a session, randomised by the sensory panel software, in a different order for each panellist. Within a panel, three samples were from one PS at the three CW, and three from the next PS. PS 1, 2 and 3 were rotated through three consecutive panels in the combinations 1 and 2, 3 and 1, 2 and 3 such that after three panels in a morning eight replicates of each PS and CW combination had been sampled by each panellist. Sensory assessments were completed under red light in a purpose built sensory suite. Each tasting booth was equipped with computer terminals linked to a fileserver running a sensory software program (Fizz v 2.20 h, Biosystemes, Couternon, France). Panellists assessed each steak using 0 to 100 mm unstructured intensity line scales for a consensually agreed texture profile, where 0=nil and 100=extreme, and eight-point category scales for tenderness (1=extremely tough to 8=extremely tender), juiciness (1=extremely dry to 8=extremely juicy), beefy flavour and abnormal beef flavour intensities (1=extremely weak to 8=extremely strong).
Statistical analysis
Data were analysed using the Mixed model procedure of SAS (Version 9.3, SAS Institute Inc., Cary, NC, USA); PS, CW and their interactions were treated as fixed effects and animal as a random effect. For data relating to the sensory analysis, panellist and session were also included as fixed effects. Pearson’s correlation coefficients (r) were generated to determine the relationships between selected production, carcass and quality traits using the CORR procedure of SAS.
Results
Production and carcass traits
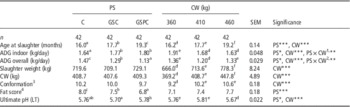
The days on ad libitum concentrates before slaughter were 113, 168 and 210 for C; 54, 105 and 122 for GSC; and 33, 63 and 117 for GSPC, of 360, 410 and 460 kg CW, respectively (Figure 1). The main effects of PS and CW on production and carcass traits data are presented in Table 1. The GSPC bulls were older (P<0.001) than GSC bulls, which in turn were older (P<0.001) than C bulls. Bulls with 460 kg CW were older (P<0.001) than 410 kg CW, which in turn were older (P<0.001) than 360 kg CW bulls. There was an interaction (P<0.01) between PS and CW with respect to average daily live weight gain (ADG) indoors (i.e. during finishing on the concentrate diet). Thus for 360 kg CW, ADG indoors was similar for GSPC and GSC, and for GSC and C, but higher (P<0.05) for GSPC than for C. For 410 kg CW, ADG indoors was higher (P<0.05) for GSPC than for GSC and C which did not differ, whereas for 460 kg CW, GSPC and C, which did not differ, had lower (P<0.05) ADG indoors than GSC. There was an interaction (P<0.01) between PS and CW for ADG overall, whereby for 360 kg CW, ADG for GSPC was lower (P<0.05) than for C and GSC (which did not differ); however, at 410 and 460 kg CW, ADG for GSC and GSPC (which did not differ) was lower than C bulls.
Production and carcass traits of bulls from three production systems (PS) (C=concentrate, GSC=grass silage followed by C, GSPC=grass silage followed by pasture and then C) and carcass weights (CW) (360, 410 and 460 kg)

SEM=standard error of the mean for comparison of main effects; ADG=average daily live weight gain; LT=longissimus thoracis muscle.
1 Mean values (kg/day)=1.77, 1.93 and 2.02 for 360 kg CW, 1.55, 1.58 and 1.90 for 410 kg CW and 1.59, 1.81 and 1.49 for 460 kg CW of C, GSC and GSPC, respectively.
2 Mean values (kg/day)=1.50, 1.51 and 1.07 for 360 kg CW, 1.43, 1.09 and 1.08 for 410 kg CW and 1.50, 1.27 and 1.23 for 460 kg CW of C, GSC and GSPC, respectively.
3 Conformation classes E+ (highest) to P− (lowest), (E+ is 15).
4 Fat score classes 5+ (highest) to 1− (lowest), (5+ is 15).
a,b,cMeans of PS within rows, assigned different superscripts differ significantly (P<0.05).
d,e,fMeans of CW within rows, assigned different superscripts differ significantly (P<0.05).
*P<0·05, **P<0·01, ***P<0·001.
Slaughter and CW were higher (P<0.001) for 460 kg CW than for 410 kg CW, which in turn were higher (P<0.001) than 360 kg CW. Conformation score was higher (P<0.001) for 460 and 410 kg CW (which did not differ) than 360 kg CW. Fat score was lower (P<0.001) for GSPC than GSC, which in turn was lower (P<0.001) than C. Ultimate pH was higher (P<0.05) for GSPC than GSC, but similar to C, which in turn was similar to GSC. Bulls with 460 kg CW had lower (P<0.001) ultimate pH than 410 and 360 kg CW, which did not differ.
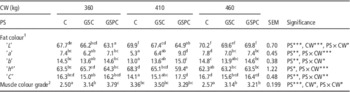
Subcutaneous fat colour and muscle colour grade data are presented in Table 2. There was an interaction (P<0.05) between PS and CW with respect to ‘L’ value (subcutaneous fat lightness). Thus for 360 kg CW, ‘L’ value did not differ between C and GSC, but both were higher than for GSPC. For 410 kg CW, the ‘L’ value was higher for C than GSC, which in turn was higher than GSPC, whereas for 460 kg CW, ‘L’ value was similar for all PS. There was an interaction between PS and CW with respect to ‘a’ (P<0.001), ‘b’ (P<0.05), and ‘C’ (P<0.01) values. Thus, for 360 and 460 kg CW, the ‘a’, ‘b’, and ‘C’ values were similar for all PS, whereas for 410 kg CW, the ‘a’, ‘b’, and ‘C’ values were lower for C and GSC (which did not differ) than for GSPC. There was an interaction (P<0.001) between PS and CW with respect to ‘h°’ value. Thus, for 360 and 460 kg CW, the ‘h°’ value was similar for all PS, whereas for 410 kg CW, the ‘h°’ value was higher for C and GSC (which did not differ) than for GSPC. There was an interaction (P<0.05) between PS and CW with respect to muscle colour grade. Thus, for 360 kg CW, muscle colour was lighter (lower score) for C than for GSC, which in turn was lighter than for GSPC. For 410 kg CW, muscle colour was similar for all PS, whereas for 460 kg CW, muscle colour was lighter for C than for GSC or GSPC which did not differ.
Subcutaneous fat colour and muscle colour grade of bulls from three production systems (PS) (C=concentrate, GSC=grass silage followed by C, GSPC=grass silage followed by pasture and then C) slaughtered at three target carcass weights (CW) (360, 410 and 460 kg)

1 Subcutaneous fat colour, where ‘L’=lightness, scale 0 (black) to 100 (white); ‘a’=redness, scale +a (red) to –a (green); ‘b’=yellowness, scale +b (yellow) to –b (blue); ‘h°’=hue, (hue angle of 0/360° is red, 90° is yellow, 180° is green and 270° is blue colour); ‘C’=chroma/saturation/colour intensity, higher ‘C’ values indicate higher colour saturation.
2 Muscle colour grades 1 (extremely bright red) to 9 (extremely dark red).
a,b,c,d,e,fMeans within rows, assigned different superscripts differ significantly (P<0.05).
*P<0·05, **P<0·01, ***P<0·001.
Chemical composition and collagen data
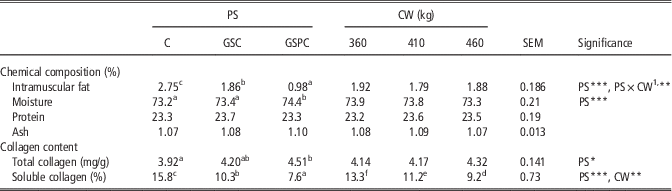
Chemical composition and collagen data are summarised in Table 3. There was an interaction (P<0.01) between PS and CW with respect to IMF content whereby for 360 kg CW, C and GSC which did not differ were higher than GSPC; for 410 kg CW, C was higher than GSC and GSPC, which did not differ, whereas for 460 kg CW, C was similar to GSC but higher than GSPC, whereas GSC and GSPC did not differ. Moisture content was lower (P<0.001) for C and GSC (which did not differ) than for GSPC. Total collagen was similar between C and GSC but lower (P<0.05) than GSPC, whereas GSC and GSPC did not differ. Soluble collagen proportion was higher (P<0.001) for C than for GSC, which in turn was higher (P<0.001) than GSPC. With respect to CW, the soluble collagen proportion was higher (P<0.01) for 360 kg than for 410 kg, which in turn was higher (P<0.01) than for 460 kg.
Chemical composition and collagen content of longissimus thoracis muscle of bulls from three production systems (PS) (C=concentrate, GSC=grass silage followed by C, GSPC=grass silage followed by pasture and then C) and carcass weights (CW) (360, 410 and 460 kg)

SEM=standard error of the mean for comparison of main effects.
1 Mean values (%)=2.55, 2.64 and 0.56 for 360 kg CW, 3.23, 1.32 and 0.82 for 410 kg CW and 2.46, 1.63 and 1.54 for 460 kg CW of C, GSC and GSPC, respectively.
a,b,cMeans of PS within rows, assigned different superscripts differ significantly (P<0.05).
d,e,fMeans of CW within rows, assigned different superscripts differ significantly (P<0.05).
*P<0·05, **P<0·01, ***P<0·001.
Sensory analysis
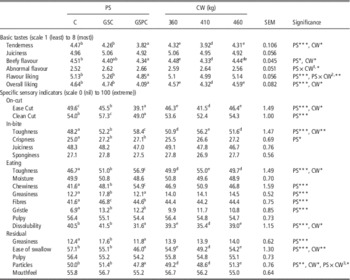
Sensory data are presented in Table 4. The C and GSC, which did not differ, had higher (P<0.001) tenderness values than GSPC. Tenderness was similar between 360 and 460 kg CW, but both were higher (P<0.05) than 410 kg CW. The C was similar to GSC in beefy flavour but higher (P<0.05) than GSPC, whereas GSC and GSPC did not differ. Beefy flavour was higher for 360 kg CW than for 410 kg CW but similar to 460 kg CW, which in turn was similar to 410 kg CW. There was an interaction (P<0.05) between PS and CW with respect to abnormal flavour. Thus for 360 kg CW, abnormal flavour was higher for C and GSPC (which did not differ) than for GSC. For 410 kg CW, abnormal flavour was lower for C and GSPC (which did not differ) than for GSC, whereas GSC and GSPC did not differ; for 460 kg CW, abnormal flavour was similar for all PS. There was an interaction (P<0.01) between PS and CW with respect to flavour liking. Thus, for 360 kg CW, flavour liking was higher for C and GSC (which did not differ) than for GSPC. For 410 kg CW, C was similar to GSC but higher than GSPC, whereas GSC and GSPC did not differ; for 460 kg CW, flavour liking was similar for all PS. The C and GSC, which did not differ, were higher (P<0.001) in overall liking than GSPC. The overall liking for 360 and 460 kg CW (which did not differ) was higher (P<0.05) than for 410 kg CW.
Sensory panel evaluation of longissimus thoracis muscle of bulls from three production systems (PS) (C=concentrate, GSC=grass silage followed by C, GSPC=grass silage followed by pasture and then C) and carcass weights (CW) (360, 410 and 460 kg)

SEM=standard error of the mean for comparison of main effects.
1 Mean values=2.65, 2.40 and 2.72 for 360 kg CW, 2.47, 2.78 and 2.68 for 410 kg CW and 2.43, 2.67 and 2.59 for 460 kg CW of C, GSC and GSPC, respectively.
2 Mean values=5.03, 5.51 and 4.76 for 360 kg CW, 5.17, 5.01 and 4.79 for 410 kg CW and 5.17, 5.26 and 4.99 for 460 kg CW of C, GSC and GSPC, respectively.
3 Mean values=49.36, 52.24 and 46.12 for 360 kg CW, 50.86, 47.77 and 47.29 for 410 kg CW and 49.77, 54.10 and 50.06 for 460 kg CW of C, GSC and GSPC, respectively.
a,b,cMeans of PS within rows, assigned different superscripts differ significantly (P<0.05).
d,eMeans of CW within rows, assigned different superscripts differ significantly (P<0.05).
*P<0·05, **P<0·01, ***P<0·001.
Ease of cut was higher (P<0.001) for C than for GSC, which in turn was higher than for GSPC. The ease of cut for 360 and 460 kg CW (which did not differ) was higher (P<0.05) than for 410 kg CW. Clean cut was higher (P<0.001) for GSC than for C, which in turn was higher (P<0.001) than for GSPC. Toughness (both during in-bite and eating) was lower (P<0.001) for C than for GSC, which in turn was lower (P<0.001) than for GSPC. The toughness (both during in-bite and eating) for 360 and 460 kg CW (which did not differ) was lower (P<0.05) than for 410 kg CW. Crispness was lower (P<0.05) for C than for GSC and GSPC, which did not differ. Chewiness was lower (P<0.001) for C than for GSC, which in turn was lower (P<0.001) than for GSPC. Greasiness (both during eating and residual) was lower (P<0.001) for C and GSPC (which did not differ) than for GSC. The C was less (P<0.001) fibrous than GSPC, which in turn was less fibrous (P<0.001) than GSC. The C was less (P<0.001) gristly than GSC and GSPC, which did not differ. Dissolubility and ease of swallow were higher (P<0.001) for C and GSC (which did not differ) than for GSPC. The dissolubility and ease of swallow for 360 and 460 kg CW (which did not differ) were higher (P<0.05) than for 410 kg CW. There was an interaction (P<0.05) between PS and CW with respect to residual particles. Thus, for 360 kg CW, residual particles for C were similar to GSC and GSPC, whereas GSC was higher than GSPC. For 410 kg CW, residual particles were same for all PS, whereas for 460 kg CW residual particles for C and GSPC (which did not differ) were lower than GSC.
Correlations among selected production, carcass and beef quality traits
The correlations between production, carcass and beef quality traits are summarised in Supplementary Material S1.
Discussion
The context of this study was that the introduction of a conserved grass and/or a grazing period before finishing on a high concentrate ration would decrease the cost of bull beef production in Ireland. A range of CW was examined to reflect the CW requirements of different markets.
Age at slaughter increased in the order C<GSC<GSPC reflecting the lower energy supply from grass silage and grazed grass compared with concentrates. A similar trend was observed for CW, i.e. 360<410<460 kg. The higher growth rate before slaughter for GSC and GSPC bulls may reflect compensatory growth during the finishing period as they had previously experienced a nutritionally restricted diet compared with C (Hornick et al., Reference Hornick, Van Eenaeme, Gérard, Dufrasne and Istasse2000). With regard to CW, the higher ADG indoor for the 360 kg CW bulls can be explained by the shorter finishing period to reach the desired CW as live weight gain decreases progressively with duration of the finishing period (Caplis et al., Reference Caplis, Keane, Moloney and O’Mara2005).
Carcass conformation scores were similar across PS and increased with increasing CW as expected as conformation score is mainly influenced by CW and breed (O’Riordan et al., Reference O’Riordan, Crosson and McGee2011). Fat score, an indication of fat deposition, decreased in the order C>GSC>GSPC, reflecting the lower energy supply for GSC and GSPC during the forage feeding periods.
The postmortem pH profile of a muscle is often associated with glycogen reserves before slaughter, which in turn are related to the pre-slaughter stress experienced by the animal (Pethick et al., Reference Pethick, Rowe and McIntyre1994, Pethick and Rowe, Reference Pethick and Rowe1996). In the present study, the bulls were unlikely to have experienced stress-induced glycogen depletion as they were finished indoors and accustomed to regular pre-slaughter handling. Nevertheless, muscle colour grade was positively correlated with pH reflecting the higher ultimate pH recorded for GSPC compared with GSC bulls and for 360 and 410 kg CW compared with 460 kg CW. However, meat from none of the animals was considered dark, firm and dry as the pH values were within the ‘normal’ pH range for acceptable colour (Warriss, Reference Warriss2010).
When slaughtered at 360 kg CW, muscle colour grade increased (i.e. the muscle appeared darker) in the order C<GSC<GSPC. A similar trend was observed at 460 kg CW (C<GSC/GSPC). This suggests that an increase in slaughter age in the modified production systems may result in darker meat as muscle tissue gets darker with increasing slaughter age (Dunne et al., Reference Dunne, O’Mara, Monahan and Moloney2006). The darker muscle from GSPC bulls may also reflect physical activity during grazing (Priolo et al., Reference Priolo, Micol and Agabriel2001).
A decrease in lightness of subcutaneous fat for GSPC bulls at 360 and 410 kg CW could be related to the lower fat score of these carcasses, whereby the underlying muscle contributed to an increase in the surface darkness of the carcass. This hypothesis is supported by the positive correlation between fatness score and fat lightness. However, at 460 kg CW, all carcasses attained similar lightness possibly because of an increase in fatness score as a result of the increased age at slaughter.
Based on the review of Dunne et al. (Reference Dunne, O’Mara, Monahan and Moloney2006), we hypothesised that fat yellowness would increase with the inclusion of a pre-slaughter grazing period. Although yellowness and saturation were higher in GSPC compared with GSC and C for the 410 kg CW, there is insufficient evidence to support this hypothesis as there was no effect of PS on either parameter at the other CW examined. A similar conclusion can be drawn with respect to redness.
There was a positive correlation between fat score and IMF content. Although the variation in IMF explained by fat score was small (~10%), it is not uncommon in this type of study mainly due to confounding factors (such as age at slaughter). It may also reflect the relative patterns of adipose tissue deposition, i.e., subcutaneous depot before intramuscular depot. Furthermore, with respect to the inclusion of a period of pre-slaughter grass feeding, the effect of subsequent concentrate feeding (up to 117 days in the case of the 460 kg CW) still resulted in a lower IMF in the GSPC bulls compared with C bulls at 360 kg after a similar period of concentrate feeding (113 days). A similar finding was reported by Vestergaard et al. (Reference Vestergaard, Therkildsen, Henckel, Jensen, Andersen and Sejrsen2000), with beef from bulls raised on pasture-based systems having lower IMF content. Low marbling fat in pasture-based production systems has been linked to quality attributes, including the production of beef with a darker colour (Scollan et al., Reference Scollan, Dannenberger, Nuernberg, Richardson, MacKintosh, Hocquette and Moloney2014). The negative correlation between IMF and meat colour grade in the current data supports this association.
The increase in mean total collagen values and decrease in collagen solubility from C to GSC to GSPC bulls and with increasing CW likely reflects an effect of age at slaughter (Blanco et al., Reference Blanco, Jurie, Micol, Agabriel, Picard and Garcia-Launay2013). As McCormick (Reference McCormick1994) indicated, older animals have higher and more mature collagen cross-links, which makes the muscle collagen less soluble. The soluble collagen proportion was also positively correlated (R=21%) with IMF content. Nishimura (Reference Nishimura2015) propose that IMF infiltration has a loosening effect on collagen structure. This could interfere with the formation of stable age-related intermolecular collagen cross-links, thereby increasing solubility. Therefore, the difference in collagen solubility between PS may be explained by the significant differences in IMF. With regard to CW, the decrease in collagen solubility with increasing CW is likely to be explained by the increased age at slaughter as the IMF was similar between the CW.
With regard to basic sensory taste characteristics, the lower tenderness, beefy flavour, flavour liking and overall liking of GSPC compared with C and GSC bulls could be attributed to variations in age at slaughter, degree of fat cover, IMF and collagen solubility and/or their net effects. That beef from the GSC and C groups was similar in tenderness, flavour liking and overall liking ratings (which are basic tastes) indicates that the inclusion of grass silage before finishing on concentrate diet may not negatively affect the sensory characteristics of the beef. We believe the most likely contributors to the differences in tenderness between the GSPC and other PS are the IMF and the collagen solubility; this is based on the lack of a significant difference in tenderness between CW 360 and 460, despite a comparable difference in age with that across the three PS. In support of the overall tenderness data, beef from the GSPC was perceived by panellists to be more difficult to cut, and tougher on biting and while chewing. It was also disintegrated less in the mouth producing fewer particles.
Beef from grass-based systems is often characterised as having less intense flavour, and is less preferred by consumers (Griebenow et al., Reference Griebenow, Martz and Morrow1997). Differences in flavour of beef from concentrate and grass-based systems can be attributed to variation in fatty acid profile and other constituents in the beef (Baublits et al., Reference Baublits, Pohlman, Brown, Johnson, Rule, Onks, Murrieta, Richards, Sandelin, Loveday and Pugh2006). The less desirable characteristics (i.e. lower beefy flavour and lower flavour liking) of beef from GSPC bulls likely reflects the residual effect of grass feeding, despite all animals receiving a pre-slaughter concentrate diet. This hypothesis is supported by the interaction between PS and CW, whereby the difference between C and GSPC was smaller for the 460 CW (i.e. the GSPC bulls received concentrates for longer) than for the other CW. Similarly, it was reported that in beef from pasture fed animals some flavours, such as grassy and fishy, which could contribute to abnormal flavour, were reduced by finishing animals on concentrate diets (Priolo et al., Reference Priolo, Micol and Agabriel2001).
With regard to CW, the lower mean values for tenderness and overall liking for 410 CW reflects a lower value only within GSC (i.e. there was no difference between CW within C and GSPC). As the experimental design required each group of animals to be slaughtered on a different occasion, this difference may reflect some anomaly in the slaughter conditions on one occasion as opposed to any biological factor.
Conclusion
Modification of a traditional (i.e. concentrate based) bull production system by introducing a period of grass silage feeding before finishing on concentrates resulted in a decrease in IMF and collagen solubility, but had little effect on sensory characteristics. A grazing period subsequent to the silage feeding period and before finishing on concentrates led to a further decrease in IMF and collagen solubility that were associated with a decrease in tenderness, flavour liking and overall liking. Within the conditions of the experiment, the age of the bulls at slaughter had a relatively small influence on sensory tenderness.
Acknowledgements
The senior author acknowledges receipt of a Teagasc Walsh Fellowship. The assistance of Karen Hussey and staff at Teagasc, Ashtown and staff at Teagasc, Grange, is also acknowledged. The assistance of staff and management at Kepak Group, Clonee, County Meath with sample collection and carcass measurement is greatly appreciated.
Supplementary Material
To view supplementary material for this article, please visit http://dx.doi.org/10.1017/S1751731116001944