INTRODUCTION
Physiological traits can be employed in breeding programmes, because they can increase the selection efficiency (Edmeades et al. Reference Edmeades, Mcmaster, White and Campos2004). Carbon isotope discrimination (Δ, a measure of the 13C/12C ratio in plant tissues compared with the air) is used as a reliable indirect assessment of the long-term water-use efficiency (WUE, the ratio of the biomass produced to the water consumed to produce it) in C3 species (Farquhar et al. Reference Farquhar, Ehleringer and Hubick1989) and proposed as a tool for yield improvement in many C3 crops (Hall et al. Reference Hall, Richards, Condon, Wright and Farquhar1994; Turner Reference Turner1997).
Leaf Δ is a reliable indicator of WUE in beans grown under various conditions (Ehleringer et al. Reference Ehleringer, Klassen, Clayton, Sherill, Fuller-Holbrook, Fu and Cooper1991; Raeini-Sarjaz et al. Reference Raeini-Sarjaz, Barthakur, Arnold and Jones1998). Since bean productivity is often limited by water availability (Boutraa & Sanders Reference Boutraa and Sanders2001) and substantial genetic variation for WUE was identified (Muñoz-Perea et al. Reference Muñoz-Perea, Allen, Westermann, Wright and Singh2007), Δ seems to be a promising tool for the selection of high-yielding genotypes. Genetic variation for Δ is more easily revealed under well-watered conditions (Royo et al. Reference Royo, Villegas, Carcía Del Moral, Elhani, Aparicio, Rharrabti and Araus2002). However, Δ determined in leaves, although a good indicator of WUE, gives weak and contradictory results when related to yield in beans (White et al. Reference White, Castillo, Ehleringer, Garcia and Singh1994). In cereals, Δ determined in grain was found to give stronger relationships with grain yield (GY) and to be a more reliable criterion for the selection of high yielders (Merah et al. Reference Merah, Deléens, Teulat and Monneveux2001a, Reference Merah, Deléens, Teulat and Monneveux2002). Also, grain Δ showed a negative association with protein content (PC) in wild and bread wheat (Rafi et al. Reference Rafi, Ehdaie and Waines1992; Tokatlidis et al. Reference Tokatlidis, Tsialtas, Xynias, Tamoutsidis and Irakli2004). However, the authors are unaware of analogous works in grain legumes.
The high cost of carbon isotope analysis and the expensive equipment needed restrict the use of Δ in breeding programmes (Brennan et al. Reference Brennan, Condon, Van Ginkel and Reynolds2007). Ash content of plant tissues (ASH) was proposed as a low-cost and easily measured surrogate for Δ (Araus et al. Reference Araus, Amaro, Casadesús, Asbati and Nachit1998; Merah et al. Reference Merah, Deléens, Souyris and Monneveux2001b; Tsialtas et al. Reference Tsialtas, Kassioumi and Veresoglou2002). In wheat, ASH was related with GY even when the relationship between Δ and GY was not significant (Tsialtas et al. Reference Tsialtas, Tokatlidis, Tamoutsidis and Xynias2005; Misra et al. Reference Misra, Randive, Rao, Sheshshayee, Serraj and Monneveux2006). Dry bean cultivars showed substantial variation for grain ASH, which was also associated with nutrient content in grains (Ceyhan Reference Ceyhan2006).
Bean, a self-pollinated legume, is grown worldwide in various environments and cropping systems, as a source of high-quality protein mainly for human consumption (Graham & Ranalli Reference Graham and Ranalli1997; Acosta-Gallegos et al. Reference Acosta-Gallegos, Kelly and Gepts2007). Bean landraces are characterized by considerable genetic variation, which could be exploited for the improvement and maintenance of modern varieties (Beebe et al. Reference Beebe, Rengifo, Gaitan, Duque and Tohme2001; Gómez et al. Reference Gómez, Blair, Frankow-Lindberg and Gullberg2004). Honeycomb breeding within two bean landraces has proved to be successful in isolating progeny lines with high and stable yield performance (Tokatlidis et al. Reference Tokatlidis, Papadopoulos, Baxevanos and Koutita2010), which constituted the material of this study. The honeycomb breeding methodology was suggested as an innovative procedure for the efficient control of undesired environmental effects (Fasoulas & Fasoula Reference Fasoulas and Fasoula1995; Fasoula & Fasoula Reference Fasoula and Fasoula2002). Very low density and the arrangement of entries constitute two of the major principles that distinguish the honeycomb method from conventional breeding schemes. Entries are allocated systematically across the entire experimental area (i.e. equilateral pattern) to cope with the soil heterogeneity, whereas interplant distance is high enough to exclude plant-to-plant interference for resources and erase the detrimental effects on selection effectiveness of the negative relationship between genotype yielding and competitive ability (Tokatlidis et al. Reference Tokatlidis, Tsialtas, Xynias, Tamoutsidis and Irakli2004, Reference Tokatlidis, Xynias, Tsialtas and Papadopoulos2006, Reference Tokatlidis, Tsikrikoni, Tsialtas, Lithourgidis and Bebeli2008; Fasoula & Boerma Reference Fasoula and Boerma2007). The procedure was found effective in the breeding of several crops such as snap bean (Phaseolus vulgaris L., Traka-Mavrona et al. Reference Traka-Mavrona, Georgakis, Koutsika-Sotiriou and Pritsa2000), cotton (Gossypium hirsutum L., Batzios et al. Reference Batzios, Roupakias, Kechagia and Galanopoulou-Sendouca2001), rice (Oryza sativa L., Ntanos & Roupakias Reference Ntanos and Roupakias2001) and tomato (Lycopersicon esculentum L., Christakis & Fasoulas Reference Christakis and Fasoulas2002).
The aim of the present study was to test whether grain physiological traits (Δ, ASH) could predict GY and quality (PC, mean grain weight (MGW)) in dry bean genotypes grown under different densities (1·2 and 4·8 plants/m2) and environments (glasshouse and field conditions).
MATERIALS AND METHODS
Origination of the genotypes
The vicinity of the Prespa lakes (north-western Macedonia, Greece) is a traditional dry bean growing area, famous for the high quality of the product. A local population (i.e. traditional landrace) named plaki Prespas had been used mainly in the highlands until the 1970s and thereafter it was replaced by another population named Chrisoupoli, which was assumed to be more adaptable to the neighbouring lowlands. The material for this study comprised 19 progeny lines derived from these two populations. Honeycomb selection took place based on the single plant GY and under the very low density of 1·2 plants/m2. A total of 432 plants of each population were grown in the glasshouse, in a non-replicated (NR-0) honeycomb trial (Fasoulas & Fasoula Reference Fasoulas and Fasoula1995) for each population. Two other similar NR-0 trials were established in an adjacent field, each containing c. 500 plants. The HONEY microcomputer program (Batzios & Roupakias Reference Batzios and Roupakias1997) was used to apply the ‘moving-circle’ selection of individual plants. More specifically, in the honeycomb field layout, each plant holds a central position and is surrounded by a number of plants allocated in concentric rings. A particular plant is selected if it out-yields all the surrounding plants included in a circle, the size of which is defined by the selection intensity (Fasoulas & Fasoula Reference Fasoulas and Fasoula1995); in this work, each plant was compared with 42 surrounding plants (Tokatlidis et al. Reference Tokatlidis, Papadopoulos, Baxevanos and Koutita2010). In this way, 19 high yielders were selected, and the seed of each selected plant constituted a separate line. Given that dry bean is a predominantly self-pollinated species (Acosta-Gallegos et al. Reference Acosta-Gallegos, Kelly and Gepts2007), no measures were taken to control pollination and derived lines were treated as ‘pure lines’. A detailed description of the whole procedure is given by Tokatlidis et al. (Reference Tokatlidis, Papadopoulos, Baxevanos and Koutita2010).
Experimental conditions and treatments
The experimentation was conducted for two growing seasons (2004/05) at the Farm of the Technological Education Institute of Western Macedonia, Florina, Greece, (40°46′N, 21°22′E, 705 m asl) in a glasshouse (on a sandy loam soil with a pH of 6·4, 16 g organic matter/kg and a water-holding capacity of 0·35 m3/m3) and an adjacent field (on a sandy loam soil with a pH of 5·8, 21 g organic matter/kg and a water-holding capacity of 0·26 m3/m3). Two or three seeds were sown in each hill by hand and thinned to a single plant at the TL1 stage (Debouck Reference Debouck, van Schoonhoven and Voysest1991). Plants were also grown in small plastic pots and transplanted at the PL stage in cases of emergence failure. Individual plants were staked on canes 2·0–2·3 m high. Rainfall for the field-grown plants totalled c. 200 mm during the growing season (May–September). Irrigation was applied at 270 mm and 320 mm in the glasshouse and in the field, respectively, ensuring unlimited water supply. Fertilization was applied before sowing at 20 kg N/ha, 50 kg P/ha, 60 kg Κ/ha and 20 kg MgO/ha in the glasshouse, and 20 kg N/ha, 50 kg P/ha and 40 kg Κ/ha in the field. The mean temperatures during the growing season (March–July in the glasshouse and May–September in the field) were 21·9 and 21·6°C in the glasshouse and 20·9 and 21·1°C in the field in 2004 and 2005, respectively. Plants were cut c. 140 days after seeding and pods were collected, air-dried and threshed in order to estimate GY.
Evaluation of the genotypes at the low density of 1·2 plants/m2
The 19 progeny lines, along with the two original populations, were tested according to the replicated-21 (R-21) honeycomb experimental design (Fasoulas & Fasoula Reference Fasoulas and Fasoula1995) under the very low density of 1·2 plants/m2 (interplant distance 1·0 m). The R-21 layout involves 21 entries allocated evenly across the entire experimental area and a particular plant of each entry is always surrounded by plants of the remaining entries constituting a complete circular replicate and ensuring highly comparable, among entries, conditions (Tokatlidis et al. Reference Tokatlidis, Papadopoulos, Baxevanos and Koutita2010). In total, 532 plants (c. 25 per entry) were established in the glasshouse (15 March 2004) and 994 plants (c. 47 per entry) in the field (6 May 2004).
Evaluation of the genotypes at the commercial density of 4·8 plants/m2
In 2005, the 21 genotypes were tested in randomized complete blocks (RCBs), each block replicated four times including border rows. In the glasshouse (seeding on 12 March), each plot consisted of two rows 4·8 m long. The spacing was consistent with the farming practice in the region, with 0·70 m between rows and 0·60 m between double-plant hills within the row, corresponding to a density of 4·8 plants/m2. A similar trial was established in the field (26 April), but each plot included four rows 6·6 m long from which the two central rows of each plot were harvested.
Measurements and determinations
In the low-density experiments, after the division of the experimental area into three blocks, the collected seeds of a given entry from each block formed a separate sample, giving three samples (replications) per entry. In the dense stand, the determination of Δ values and ASH was conducted in three out of four replications in order to restrict the isotope analysis cost. A sub-sample (c. 50 g) of each sample was dried at 75°C for 48 h and ground to fine powder.
Carbon isotopes were determined at Gaia Center-Goulandris Natural History Museum, Kifissia, Greece, on an isotope mass spectrometer (CF-IRMS, PDZ-Europa, Crewe, UK) coupled to an elemental analyser for the online sample preparation and N determinations. The carbon isotope ratio δ13C (‰) in the samples was calculated as

where the standard was the universally accepted Peedee Belemnite (PDB) limestone. Δ was calculated as

where δa and δp are δ13C of the air and leaf sample, respectively. δa is c. −8‰.
A sub-sample (c. 1 g) of the ground material was combusted at 500°C for 4 h in a muffle furnace and ASH was determined by weighing the residue. Grain PC was determined as N×6·25 (g/kg), and expressed in dry mass. The MGW was estimated once per genotype in the mixed sample, which was retained for the next season seeding.
Statistical analysis
The data of low-density experiments were subjected to analysis of variance (ANOVA) as a completely randomized (CR) design with three replications and with the environments (glasshouse and field) and genotypes as main factors. The data of dense stand experiments were analysed as an RCB design with two main factors (environments and genotypes) and three replications. The statistical analysis was performed using the M-STAT statistical package (MSTAT-C, version 1.41, Crop and Soil Sciences Department, Michigan State University, USA).
RESULTS
Evaluation under low density
The main factors (environments, E and genotypes, G) significantly affected the values of the traits determined. Their interaction was also significant, except for PC. Lower Δ values (19·4‰ v. 21·0‰, P<0·001) and ASH (48·9 g/kg v. 49·9 g/kg, P<0·001) were found in the glasshouse compared to the field, but the reverse was evident for PC (267 g/kg v. 227 g/kg, P<0·001). Values of Δ ranged from 17·8 to 21·1‰ in the glasshouse (P<0·001) and from 19·8 to 22·7‰ in the field (P<0·001). The lowest ASH was 42·6 g/kg and the highest 53·5 g/kg in the glasshouse (P<0·001) and 45·3 and 54·7 g/kg, respectively, in the field (P<0·001). PC ranged from 213 to 322 g/kg in the glasshouse, and from 196 to 254 g/kg in the field. The lowest coefficient of variation (C.V.) was found for ASH (0·025) and the highest for PC (0·095). A stable genotypic ranking was evident only for PC, because the G×E interaction was not significant for this trait.
Evaluation under dense stand
In the dense stand, ASH was significantly affected by the main factors and their interaction (G: P<0·01, E and G×E: P<0·001), while Δ was affected by the environment (20·9‰ in the glasshouse and 19·5‰ in the field, P<0·001) and PC was affected by both G (P<0·01) and E (P<0·05), but not by their interaction. The highest ASH was found in the glasshouse (47·9 g/kg v. 47·1 g/kg) and the highest PC in the field (254 g/kg v. 234 g/kg). The range of Δ was from 19·5 to 22·2‰ in the glasshouse and from 18·4 to 20·8‰ in the field. The lowest and highest ASH were 43·3 and 50·8 g/kg, respectively, in the glasshouse and 41·0 and 50·1 g/kg, respectively, in the field. PC ranged from 193 to 292 g/kg in the glasshouse and from 214 to 290 g/kg in the field. As in low-density experiments, ASH had the lowest (0·030) and PC the highest (0·134) C.V. No environmental effect on the genotypic ranking was evident for PC, accounting for the lack of significant G×E interaction.
Relationships of the traits determined
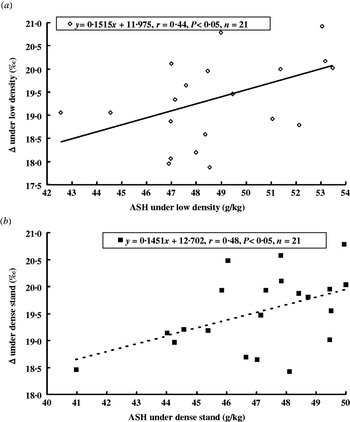
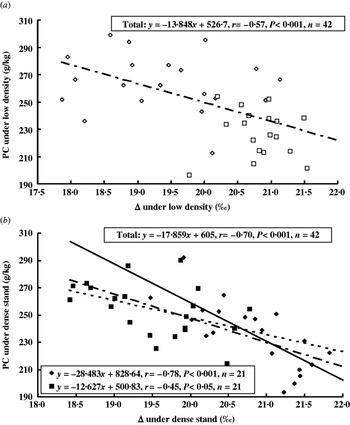
Positive correlations (P<0·05) were found between Δ and ASH at the low density in the glasshouse and in the dense stand in the field (Fig. 1). Strong, negative correlations (P<0·001) between Δ and PC were found under both densities for the data combined over the glasshouse and field conditions (Fig. 2). The Δ–PC relationship was stronger in the dense stand rather than the low density, derived mainly from the glasshouse data.
The relationships of ASH with Δ: (a) in the glasshouse at low density and (b) in the dense stand in the field.

Correlations between Δ and PC at: (a) low density and (b) the dense stand. ◇, Low density in the glasshouse. □, Low density in the field. ◆, High density in the glasshouse. ▪, High density in the field. Trend lines: (––) for glasshouse, (- - -) for field conditions and (- – -) for combined glasshouse and field data (total).

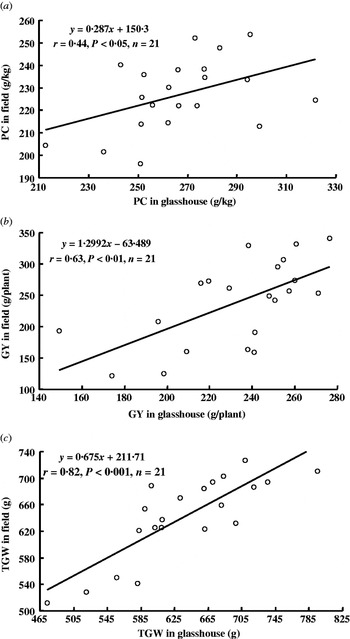
Under low density, no significant correlation of values determined in the glasshouse with the respective values in the field was found for either Δ or ASH. A weak, positive correlation was evident for PC, a stronger one for GY and a highly significant one for MGW (Fig. 3). In the dense stand, the simple correlation coefficients among values obtained in the glasshouse and the field were marginally significant for both PC and GY (r=0·43, P<0·05 and r=0·42, P<0·06, respectively). Nevertheless, strong significant correlations were found for ASH (r=0·93, P<0·001) and MGW (r=0·82, P<0·001).
Correlations between the data obtained in the glasshouse and in the field under low density for (a) PC, (b) GY and (c) MGW.

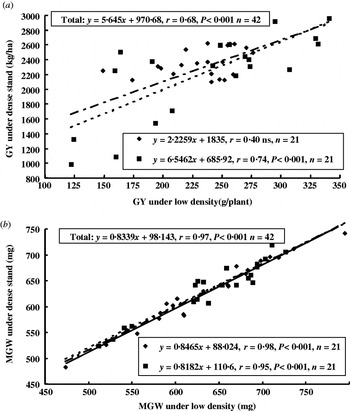
Strong, positive relationships were found for MGW values obtained at low density with those at the dense stand, on the basis of simple correlation coefficients computed from data obtained in either glasshouse or field conditions, and also combined across both conditions (Fig. 4). There was a significant positive relationship between the GY and the two densities in the field, but not in the glasshouse (Fig. 4). For ASH, a weak, positive correlation was found in the glasshouse conditions (y=0·3113x+3·2673, r=0·50, P<0·05, n=21), while negative correlations were found for Δ (y=−0·3981x+28·243, r=−0·49, P<0·01, n=42) and PC (y=−0·3163x+32·234, r=−0·37, P<0·05, n=42) when data were combined over the glasshouse and field conditions.
Correlations between the data obtained at low density and the dense stand for (a) GY and (b) MGW. ◆, Glasshouse; ▪, Field conditions. Trend lines: (––) for glasshouse, (- - -) for field conditions and (- – -) for combined glasshouse and field data (total).

DISCUSSION
Intra-landrace selection revealed significant genetic variation for GY within the landraces tested in this work (Papadopoulos et al. Reference Papadopoulos, Tokatlidis, Tamoutsidis, Koutsika-Sotiriou and Koutroubas2007; Tokatlidis et al. Reference Tokatlidis, Papadopoulos, Baxevanos and Koutita2010). Regarding grain physiological (Δ, ASH) and quality (PC) traits, genotypic differentiation was more pronounced and stable (lower C.V.) under the low density compared to the dense stand, indicating an effect of plant density on trait expression (Gouveia & Freitas Reference Gouveia and Freitas2008). Under ultra-low density, which approaches the absence of competition, genotypic expression and differentiation are maximized (Fasoulas & Fasoula Reference Fasoulas and Fasoula1995), allowing the identification of even limited genetic variation (Fasoula Reference Fasoula1990; Fasoula & Boerma Reference Fasoula and Boerma2005, Reference Fasoula and Boerma2007; Tokatlidis et al. Reference Tokatlidis, Tsialtas, Xynias, Tamoutsidis and Irakli2004, Reference Tokatlidis, Xynias, Tsialtas and Papadopoulos2006, Reference Tokatlidis, Tsikrikoni, Tsialtas, Lithourgidis and Bebeli2008). Previous works have reported density effects on phenology, phenotype expression, resource use and finally yield (Heath & Hebblethwaite Reference Heath and Hebblethwaite1987; Mazer & Wolfe Reference Mazer and Wolfe1992; Gonzalo et al. Reference Gonzalo, Vyn, Holland and McIntyre2007), but the respective effects on plant physiology and especially Δ are rarely studied and more research is necessary.
Recently, the employment of physiological traits in breeding was suggested as a means of increasing selection efficiency (Edmeades et al. Reference Edmeades, Mcmaster, White and Campos2004). A physiological trait can be used as a selection criterion, when its heritability is higher than yield or other traits (Hall et al. Reference Hall, Richards, Condon, Wright and Farquhar1994), a finding confirmed for leaf Δ in cotton (Stiller et al. Reference Stiller, Read, Constable and Reid2005) and bread wheat (Rebetzke et al. Reference Rebetzke, Richards, Condon and Farquhar2006). Flag leaf and grain Δ were proposed as reliable, indirect selection criteria for GY in C3 cereals, with grain Δ being more suitable (Merah et al. Reference Merah, Deléens, Teulat and Monneveux2001a, Reference Merah, Deléens, Teulat and Monneveux2002). However, earlier work in beans revealed weak and inconsistent relationships of GY with leaf Δ depending on low or high heritability of leaf Δ (White et al. Reference White, Castillo and Ehleringer1990, Reference White, Castillo, Ehleringer, Garcia and Singh1994; Zacharisen et al. Reference Zacharisen, Brick, Fisher, Ogg and Ehleringer1999). These findings guided this study to explore the relationships between GY and grain Δ. The absence of significant relationships for any combination of density and environment disputes grain Δ usefulness as a tool for selection of high yielders in dry bean. An explanation for this contradiction between cereals and beans is possibly the proportional differences in the grain components, which are reflected in the bulk grain isotope composition (Dungait et al. Reference Dungait, Docherty, Straker and Evershed2008). However, Δ was negatively correlated with grain PC, especially under the dense stand, in accordance with previous reports on wheat (Rafi et al. Reference Rafi, Ehdaie and Waines1992; Tokatlidis et al. Reference Tokatlidis, Tsialtas, Xynias, Tamoutsidis and Irakli2004).
Grain ASH, a trait related to bean nutritive value (Ceyhan Reference Ceyhan2006), differed significantly between genotypes. The ASH in flag leaf or grain was proposed as a cheap and easily determined surrogate of Δ in breeding programmes when a large number of Δ determinations is not affordable (Brennan et al. Reference Brennan, Condon, Van Ginkel and Reynolds2007). However, contrary to previous findings (Araus et al. Reference Araus, Amaro, Casadesús, Asbati and Nachit1998; Merah et al. Reference Merah, Deléens, Souyris and Monneveux2001b; Tsialtas et al. Reference Tsialtas, Kassioumi and Veresoglou2002), grain ASH was not a reliable surrogate of grain Δ in beans, since only weak and inconsistent relationships between the two traits were found. In cereals, significant and strong relationships were found between ASH and GY even when the Δ-GY relationships were weak or not significant (Tsialtas et al. Reference Tsialtas, Tokatlidis, Tamoutsidis and Xynias2005; Misra et al. Reference Misra, Randive, Rao, Sheshshayee, Serraj and Monneveux2006). Such findings were not evident in this study. Grain Δ and ASH showed non-significant or weak correlations when data of the two environments (glasshouse and field) or densities were plotted against each other, an indication of low heritability of the traits (Tsialtas et al. Reference Tsialtas, Kassioumi and Veresoglou2002). In contrast, both GY and MGW exhibited strong, positive correlations between the low-density performance and that in the dense stand, indicating consistent genotypic ranking and thus, high heritability of the traits selected under low density (Papadopoulos et al. Reference Papadopoulos, Tokatlidis, Tamoutsidis, Koutsika-Sotiriou and Koutroubas2007).
In conclusion, genotypes differed significantly for grain Δ, ASH and PC, especially under low density (1·2 plants/m2). However, grain Δ and ASH were not related with GY in dry beans grown under the two environments (glasshouse and field) and densities and thus, they cannot serve as indirect selection criteria. Only a negative relationship between grain Δ and PC was evident. GY and especially MGW were consistent across both densities and environments, indicating selection effectiveness for these traits under low density.
We thank Mrs E. Tsantila at Gaia Center-Goulandris Natural History Museum, Kifissia, Greece for the isotopic determinations. This study was funded by a grant of the Technological Education Institute of Western Macedonia, Greece (no. 23/19-12-2006 of Education and Research Committee). We are grateful to the anonymous reviewers for their comments and efforts to form a concise paper.