1. Introduction
In 2019, more than 342 million patients were identified as having retinal diseases, and a significant number of these required a microsurgical intervention in order to preserve or restore vision [1]. However, retinal surgery is characterized by a complex workflow and delicate tissue manipulations that require both critical manual dexterity and learned surgical skills [Reference Gijbels, Poorten, Gorissen, Devreker, Stalmans and Reynaerts2]. Many of these patients lack access to proper and timely treatment and therefore increase their chances of blindness. Medical robots and robot-assisted surgery (RAS) setups are envisioned as a potential solution for reducing the work intensity, improving the surgical outcomes, and extending the work lifetime of experienced surgeons [Reference Wei, Goldman, Simaan, Fine and Chang3–Reference Qi, Ovur, Li, Marzullo and Song14]. Different from the robotic laparoscopic minimally invasive surgery, the retinal surgery needs further consideration of specific precision which requires additional design in robotic system [Reference Qi, Ovur, Li, Marzullo and Song14, Reference Su, Qi, Schmirander, Ovur, Cai and Xiong15]. In 2016, surgeons at Oxford’s John Radcliffe Hospital performed the world’s first robot-assisted eye surgery, demonstrating the safety and the possibility of using a robot system in the most challenging task in retinal surgery [Reference Edwards, Xue, Meenink, Beelen, Naus, Simunovic, Latasiewicz, Farmery, de Smet and MacLaren16], namely the dissection of the epiretinal or inner limiting membrane over the macula.
Autonomous technology has been first proposed by David L. Heiserman in 1976 [Reference Heiserman17] and has been developed rapidly because of large-scale research and business attempts in autonomous driving (AD) [Reference Yurtsever, Lambert, Carballo and Takeda18]. Not only restricted to applications in AD, but the introduction of autonomy into RAS may also someday assist microsurgeons to perform surgery with better outcomes and higher efficiency [Reference Li, Deng and Zhao9, Reference Yang, Cambias, Cleary, Daimler, Drake, Dupont, Hata, Kazanzides, Martel, Patel, Santos and Taylor19–Reference Shi, Chang, Wang, Zhao, Zhang and Yang23].
A proper sensing method for instrument localization is fundamental for autonomous tasks in retinal surgery. Zhou et al. [Reference Zhou, Yu, Huang, Mahov, Eslami, Maier, Lohmann, Navab, Zapp, Knoll and Nasseri24] utilized microscope-integrated optical coherence tomography (MI-OCT) to perform subretinal insertion under visual servoing. However, MI-OCT has a very limited visual depth of roughly 2 mm. Hence, it is hard for it to meet the requirements for some tasks with large-scale navigation inside the eye. The boundaries constraining the instruments’ movement range depend on the applications and could be treated as a volume of 10 mm × 10 mm × 5 mm [Reference Zhou, Wu, Ebrahimi, Patel, He, Gehlbach, Taylor, Knoll, Nasseri and Iordachita25, Reference Probst, Maninis, Chhatkuli, Ourak, Poorten and Van Gool26]. This estimation is based on the available microscope view for some typical retinal surgeries, that is navigating needles close to the retina or tracking vessel.
The contradiction of the image resolution and image range of OCT makes it less suitable for the guidance of instrument movements over a large range, for example a volume of 10 mm × 10 mm × 5 mm. To navigate intraocular instruments in 3D with a large range, Probst et al. proposed a stereo-microscope vision system with deep learning to localize the needle tip [Reference Probst, Maninis, Chhatkuli, Ourak, Poorten and Van Gool26]. This method showed advantages in the simplified in terms of logistics; however, there are constraints due to the need of data annotation and illumination. To cope for this, Yang et al. [Reference Yang, Martel, Lobes and Riviere27] and Zhou et al. [Reference Zhou, Wu, Ebrahimi, Patel, He, Gehlbach, Taylor, Knoll, Nasseri and Iordachita25] proposed a proactive of method using a spotlight source. Different from Yang et al. [Reference Yang, Martel, Lobes and Riviere27], spotlight source proposed in this paper is a single spotlight source with a single projection pattern or triple projection pattern which can be mounted on the tooltip. However, the theoretical error analysis and proper guidance for designing a spotlight have not been fully studied and discussed yet.
In this paper, we investigate the theoretical error analysis for spotlight-based instrument localization in 5D for retinal surgery. The error limitations are explored by a sensitivity analysis of the spotlight configuration. The contributions of this paper are listed as follows,
-
• The detailed mathematical models to derive the pose and position of instrument from a single spotlight and three spotlight are proposed and verified.
-
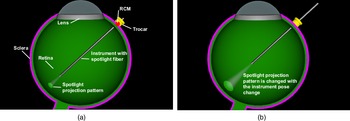
• The high-fidelity simulation environment built with Blender [28] shown in Fig. 1 makes it possible to verify the theory under controlled various conditions.
-
• The experiment results indicate that the single spotlight version can localize the position of the instrument with an average error of 0.028 mm while the multiple spotlights version yields 0.024 mm showing the promising for retinal surgery.
The remainder of the paper is organized as follows: in the next section, we briefly present the related work. The proposed method is described in Section 3. In Section 4, the performance of the proposed method is evaluated and discussed. Finally, Section 5 concludes this paper.
2. Related work
To navigate instruments inside the eye, three approaches have been proposed. The first approach uses the optical coherence tomography (OCT) modality in form of MI-OCT. OCT imaging is popular not only in the retina diagnostics but also intraoperatively to provide useful visual feedback to the operating surgeon [Reference Roodaki, Grimm, Navab and Eslami29–Reference Zhou, Yu, Mahov, Huang, Eslami, Maier, Lohmann, Navab, Zapp, Knoll and Ali Nasseri32], having the benefits of a suitable resolution and a radiationless imaging mechanism. An additional benefit is that it allows to see the interaction between the tissue and the instrument [Reference Weiss, Rieke, Nasseri, Maier, Eslami and Navab33]. However, the image range in depth direction is limited to roughly 2 mm which makes it only suitable for very fine positioning [Reference Roodaki, Grimm, Navab and Eslami29], for example internal limiting membrane peeling [Reference Seider, Carrasco-Zevallos, Gunther, Viehland, Keller, Shen, Hahn, Mahmoud, Dandridge, Izatt and Toth34] and subretinal injection [Reference Zhou, Yu, Huang, Mahov, Eslami, Maier, Lohmann, Navab, Zapp, Knoll and Nasseri24].
The second approach is stereo-microscope vision. Probst et al. proposed [Reference Probst, Maninis, Chhatkuli, Ourak, Poorten and Van Gool26] a stereo-microscope vision system which uses deep learning to reconstruct the retina surface and localize the needle tip. The benefit of this method is that it will not introduce any other additional instruments inside the eye. Moreover, the method can obtain an accuracy of 0.1 mm in 3D over a large range (the imaging range of the microscope). The drawback is that the deep learning method requires a large amount of annotated data for different surgical tools and the purely passive stereo-microscope vision systems could be influenced by variations in illumination.
A third is the use of a single microscope to navigate instruments. As the solo microscope image cannot provide the depth information, a structured light-based method can be applied. In this approach, the use of geometrical information is required. The use of light cones and their respective elliptical projections is a commonly selected approach. Chen et al. [Reference Chen, Wu and Wada35] used the ellipse shape to estimate the extrinsic parameters and the focal length of a camera by using only one single image of two coplanar circles with arbitrary radius. The relationship was also explored by Noo et al. [Reference Noo, Clackdoyle, Mennessier, White and Roney36] for the calibration of a cone-beam scanner used in both X-ray computed tomography and single-photon emission computed tomography. Swirski et al. [Reference Swirski and Dodgson37] used the ellipse shape to estimate the eyeball rotation with the pupil ellipse geometry with a single camera. In the eye surgery domain, Yang et al. [Reference Yang, Martel, Lobes and Riviere27] used a cone beam with structured light reconstruction to estimate a surface in the coordinate system of a custom-built optical tracking system named ASAP. There, after surface reconstruction, the tip-to-surface distance was estimated in the coordinate system of the ASAP [Reference Yang, MacLachlan, Martel, Lobes and Riviere38]. Inspired by Yang et al.’s approach, Zhou et al. [Reference Zhou, Wu, Ebrahimi, Patel, He, Gehlbach, Taylor, Knoll, Nasseri and Iordachita25] proposed a spotlight to navigate an instrument and measure the distance between the instrument tip and the surface with real-time performance in a large range of 10 mm × 10 mm × 5 mm.
To further study the spotlight navigation capabilities, in this paper we explore the performance upper limitation with a theoretical analysis. To verify the correctness of the analysis, a high-fidelity simulation environment with Blender is built up and tested with different simulated trajectories. Furthermore, the multi-spotlight design is also analyzed and verified to have the potential to improve the localization performance.
3. Methods
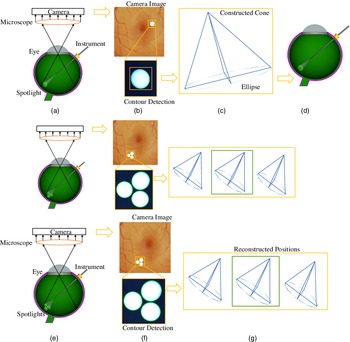
The overall framework is depicted in Fig. 2. A microscope with camera is used to capture intraocular images. A light fiber with a lens producing a cone-shaped light beam is attached to the surgical instrument.
(a) The simulation setup in Blender. The movement of the instrument is constrained by the remote center of motion (RCM) to reduce the trauma of the incision point on the sclera. (b) The spotlight pattern changes with the location of the instrument.

(a) A spotlight is attached to the instrument. The camera and microscope system are set up to record the projection of the spotlight on the intraocular surface of the eye. (b) Post-processing is used to detect the contour of the projection on the captured images. (c) The known surface is used to reconstruct the real projection. An ellipse is fitted and used to reconstruct the cone. (d) The light cone is placed above the real projection to determine the position of the instrument. (e) For the multiple spotlights scenario, three spotlights are attached to the instrument. (f) The three projections are used independently to reconstruct possible vertex positions. (g) The median position is picked as the result.

The projected light pattern is extracted from the camera image. The contour of the projection is extracted, using post-processing and contour detection. Information about the camera setup and the retinal surface is used to reconstruct the three-dimensional shape of the contour. An ellipse is fitted into the contour shape. Based on the fitting result and the geometric properties of the light cone, the source position of the light can be reconstructed.
3.1. Projection pattern reconstruction
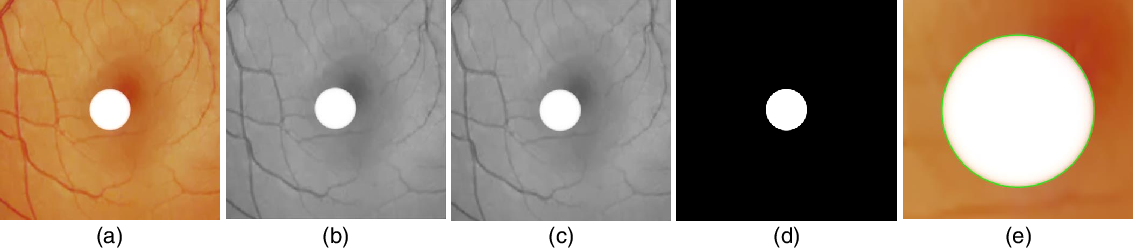
First, the camera image is converted from RGB to grayscale. Then, a Gaussian and a median filter are applied to reduce the noise. The result is converted into a binary image using a threshold obtained with the Otsu binarization method [Reference Otsu39]. Afterward, the ellipse fitted is used to reconstruct the shape of the spotlight projection. An example for each step is depicted in Fig. 3.
The original image (a) is converted to a grayscale image (b). A Gaussian and median filter (c) are used reduce noise. The result is converted into a binary image (d) that is used for the contour detection. A closeup of the detected contour (green) on top of the original image can be seen in (e).

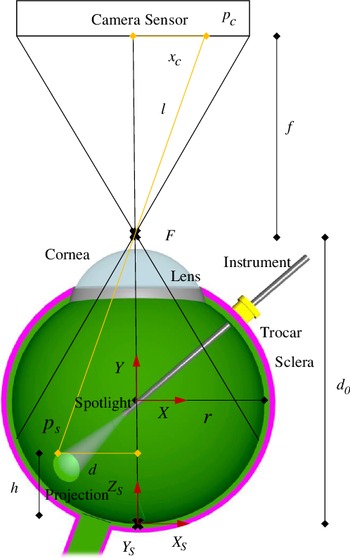
The camera projection of the intraocular surface onto the image plane can be described using the pinhole camera model. Based on the camera model and the surface shape (simplified to be perfectly spherical), we can reconstruct the three-dimensional projection directly from the microscope image. The setting for the reconstruction is depicted in Fig. 4.
Cross-section along the optical axis. Used for the reconstruction of the projection.

Using a point
 $p_c$
on the camera sensor and the focal point, we can define a line
 $l$
that intersects the surface of the sphere at the point
 $p_s$
. By using a cross-section containing
 $p_s$
, the focal point (F), and the center of the sphere, the problem can be simplified to an intersection between
 $l$
(yellow in Fig. 4) and a circle. The line
 $l$
is given by Eq. (1) and the circle by Eq. (2), where
 $f$
is the focal length,
 $r$
is the radius of the sphere, and
 $d_0$
is the distance between the focal point and the bottom of the sphere.
 $y_1$
is the Euclidean distance between the center of the camera sensor and
 $p_c$
. Here, the coordinate system is defined with the center of the sphere as shown in Fig. 4.
 \begin{equation} y=\frac{f}{y_1}x+(d_0-r) \end{equation}
 \begin{equation} x^2+y^2=r^2 \end{equation}
The said intersection allows to calculate the distance (
 $d$
) between the point on the sphere surface
 $p_s$
represented by
 $p_1$
and the optical axis.
The resulting Eq. (3) is based on the quadratic formula used to derive the intersection between the line and the circle.
 \begin{equation} d=\frac{\frac{2 d_0 f}{y_1}-\frac{2 r f}{y_1}+\sqrt{\left(\frac{2 r f}{y_1}+\frac{2 d_0 f}{y_1}\right)^2-4 \left(1+\frac{f^2}{y_1^2}\right) (d_0^2-2 d_0 r)}}{2 \left(1+\frac{f^2}{y_1^2}\right)} \end{equation}
Knowing the distance (
 $d$
) between the optical axis and the point
 $p_s$
, we can obtain the corresponding height (
 $h$
) using Eq. (4). The height is defined as the distance between
 $p_s$
and the bottom of the sphere along axis
 $Y$
, as depicted in Fig. 4.
 \begin{equation} h=r-\sqrt{r^2-d^2} \end{equation}
Given the position
 $p_c=(x_c,y_c)$
and the distance
 $d$
, we can calculate the estimated position
 $p_s=(x_s,y_s,z_s)$
, given by Eqs. (5), (6), and (7). Here,
 $s$
is the physical size of the camera sensor in mm and
 $p$
is the resolution of the image sensor.
 \begin{equation} x_s= \left \{ \begin{matrix} \dfrac{d}{\sqrt{1+\frac{y_c^2}{x_c^2}}},& \text{if } x_c\geq 0\\ \\[-5pt] \dfrac{-d}{\sqrt{1+\frac{y_c^2}{x_c^2}}}, & \text{otherwise} \end{matrix} \right. \end{equation}
 \begin{equation} y_s=\dfrac{y_p}{x_p}x_s \end{equation}
 \begin{equation} z_s=h \end{equation}
This allows to fully reconstruct the three-dimensional contour of the intersection based on the shape on the camera sensor.
3.2. Cone-sphere intersection
The intersection between a cone and a sphere is a rather complicated three-dimensional curve that does not lie on a two-dimensional plane. The only exception is the special case, where the center of the sphere lies on the axis of the cone, producing a circle-shaped intersection.
A parametric equation for this curve can be derived using equations defining a sphere and a cone. A right circular cone with the vertex in the origin can be defined using Eq. (8), where
 $\beta$
is the opening angle of the spotlight.
 $\beta$
is defined as the angle between the axis of the cone and every line from the vertex to a point on its surface. The axis is equal to the
 $Z$
axis.
 \begin{equation} z^2=\frac{x^2+y^2}{\tan\!(\beta )^2} \end{equation}
A sphere can be defined using Eq. (9), where
 $r$
is the radius of the sphere and
 $(x_0, y_0, z_0)$
is the position of the center.
 \begin{equation} (x-x_0)^2+(y-y_0)^2+(z-z_0)^2=r^2 \end{equation}
To set
 $y_0 =0$
and simplify the equation of the intersection, we can rotate the coordinate system around the axis of the cone, so that the center of the sphere is in the plane defined by the Z and X-axis. This does not lead to a loss of generality, as the cone is not affected by the rotation. The resulting equation used for the sphere is given in Eq. (10).
 \begin{equation} (x-x_0)^2+y^2+(z-z_0)^2=r^2 \end{equation}
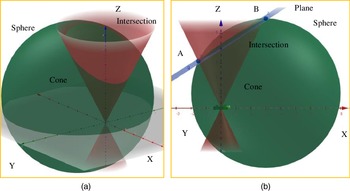
(a) Intersection between a sphere and a cone. (b) The blue plane is used to show the similarity between the cone-sphere intersection and an ellipse.

We can then obtain an equation for the intersection by combining Eqs. (8) and (10). The resulting equation is parametric with
 $x_i=x$
as a parameter. The points
 $p_i=(x_i,y_i,z_i)$
of the intersection can be calculated with Eqs. (11) and (12), where
 $c=\tan\!(\beta )$
. The range of values for
 $x$
is given in Eq. (13) and can be calculated using Eqs. (8) and (9). The definitions for
 $x_1$
and
 $x_2$
are given in Eqs. (14) and (15).
 \begin{equation} z_i=\frac{z_0+\sqrt{z_0^2-(1+c^2)(x_0^2-r^2+z_0^2-2x_0x)}}{(1+c^2)} \end{equation}
 \begin{equation} y_i=\pm \sqrt{z_i^2c^2-x^2} \end{equation}
 \begin{equation} x = [x_1,x_2] \end{equation}
 \begin{equation} x_1=\frac{\left(x_0+\frac{z_0}{c}\right)+\sqrt{\left(x_0+\frac{z_0}{c}\right)^2-1-\frac{1}{c^2} (x_0^2+z_0^2-r^2)}}{1+\frac{1}{c^2}} \end{equation}
 \begin{equation} x_2=\frac{\left(x_0-\frac{z_0}{c}\right)-\sqrt{\left(x_0-\frac{z_0}{c}\right)^2-1-\frac{1}{c^2} (x_0^2+z_0^2-r^2)}}{1+\frac{1}{c^2}} \end{equation}
3.3. Cone-plane intersection
When inspecting the shape of a cone and plane intersection in three dimensions, it is very similar to an ellipse. An example is depicted in Fig. 5(a). This similarity motivates us to simplify the real intersection to the shape of an ellipse, as this can significantly reduce the localization effort. Because instead of trying to reconstruct the location of the light source based on a projection of a three-dimensional curve, we can reconstruct based on the projection of an ellipse. It is known that the intersection between a cone and a plane has the shape of an ellipse, if the angle between the axis of the cone and the plane is higher than the opening angle of the cone. To show the similarity between the cone-sphere intersection to an ellipse, we construct a plane
 $P$
that intersects the cone and therefore produces an ellipse-shaped intersection.
The cone-plane intersection should be close to the cone-sphere intersection. First, we take the two points (A (
 $x_1$
, 0,
 $z_A$
) and B (
 $x_2$
, 0,
 $z_B$
)) on the cone-sphere intersection with the biggest distance between each other and connect them with a line. The resulting plane
 $P$
is made perpendicular to the
 $XOY$
plane and contains this line. The x-coordinates of these two points are the ends of the range for the values of
 $x$
and can be calculated using Eqs. (14) and (15). The Z-coordinates of A and B are calculated using the cone equation as shown in Eq. (16). Figure 5(b) depicts an example for the constructed plane
 $P$
(blue).
 \begin{equation} z_A=\frac{x_1}{c}, z_B=\frac{-x_2}{c} \end{equation}
The resulting plane
 $P$
is defined by Eq. (17).
 \begin{equation} P\;:\; z=\frac{z_A-z_B}{c(z_A+z_B)}x+z_1-\frac{x_1(z_A-z_B)}{c(z_A+z_B)} \end{equation}
The maximum difference between the intersections.

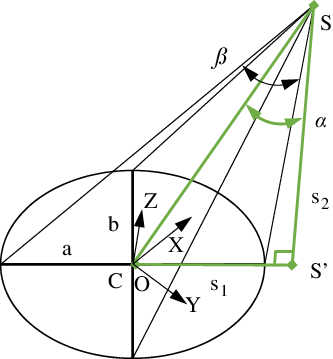
Triangle (green) used to derive the vertex position based on a given ellipse.
 $S$
denotes the spotlight source.
 $C$
denotes center of ellipse.
 $s_1$
is the distance between
 $S'$
and
 $C$
.
 $s_2$
is the height of the spotlight source
 $S$
with the
 $XOY$
plane.

This equation can be used in combination with Eq. (8) to obtain the cone-plane intersection points
 $p'_{\!\!i}=(x'_{\!\!i},y'_{\!\!i},z'_{\!\!i})$
as a parametric (
 $x'_{\!\!i}=x$
) equation.
 $y'_{\!\!i}$
and
 $z'_{\!\!i}$
are given by Eqs. (18) and (19). Due to the definition of the plane, the range of values for
 $x$
is also given by Eq. (13).
 \begin{equation} y'_{\!\!i}=\pm \sqrt{\left(\frac{z_A-z_B}{c(z_A+z_B)}x-z_A-\frac{x_1(z_A-z_B)}{c(z_A+z_B)}\right)^2c^2-x^2} \end{equation}
 \begin{equation} z'_{\!\!i}=\sqrt{\frac{x^2+y_i^{\prime 2}}{c^2}} \end{equation}
From the definition of the plane
 $P$
, we know that the intersections have the two points A and B in common. To find the maximum difference between these two intersections, we can use the points
 $(x_h,0,z_h)$
where the surfaces intersecting the cone have their biggest difference.
 $z_h$
and
 $x_h$
are defined in Eqs. (20) and (21).
 \begin{equation} z_h=\cos\!\left(\sin^{-1}\left(\cos\!(\beta )\frac{x_0}{r}\right)\right)r+z_0 \end{equation}
 \begin{equation} x_h= \left \{ \begin{matrix} \sqrt{r^2-(z_h-z_0)^2}+x_0,& \text{if } x_0\geq 0\\\\ -\sqrt{r^2-(z_h-z_0)^2}+x_0, & \text{otherwise} \end{matrix} \right. \end{equation}
This allows us to directly calculate the maximum difference between the two intersections (the real intersection and simplified ellipse) by using the parametric equations. For our use case, we define an area of interest which is shown in Fig. 3. It is a 10 mm × 10 mm × 5 mm range, mainly defined by the microscope view and surgical region. The opening angle
 $\beta$
of the cone is independent of the instrument location and depends only on the designed spotlight’s lens. Therefore, we can calculate the maximum difference for different values for
 $\beta$
. This gives guidance on which angles could be suitable in regard to an error tolerance. The resulting maximum differences are given in Table I.
For our use case, these differences are negligible for the listed opening angles and we can see the projection as an ellipse without introducing a significant error (
 $\lt\!\lt$
10 μm).
3.4. Ellipse to cone reconstruction
For the ellipse fitting, the reconstructed shape of the contour is rotated onto the
 $XOY$
plane as shown in Fig. 6. After reconstructing the vertex of the cone, the inverse rotations are applied. The ellipse can be defined using the position of its center, the length of the major axis
 $a$
, and minor axis
 $b$
. The size of the minor axis is related to the distance between the vertex of the cone and the plane. The relationship between
 $a$
and
 $b$
depends on the angle between the cone and the
 $XOY$
plane.
Properties of the camera in the Blender simulation.

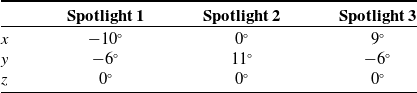
Rotations applied to each spotlight to achieve the correct angles.

To find the vertex position, a right triangle is used as depicted in Fig. 6. One corner of the triangle is the vertex position, and one corner is in the center position. The side
 $s_2$
is perpendicular to the XOY plane, and the side
 $s_1$
follows the major axis. The length of the side
 $s_1$
and
 $s_2$
can be calculated using Eqs. (22), (23), and (24),
 \begin{equation} \alpha =\sin^{-1}\left(\sqrt{1-\frac{b^2}{a^2}}\cos\!(\beta )\right) \end{equation}
 \begin{equation} s_1=a\frac{\sin\!(2\alpha )}{\sin\!(2\beta )} \end{equation}
 \begin{equation} s_2=a\left(\frac{\cos\!(2\alpha )}{\sin\!(2\beta )}+\frac{1}{\tan\!(2\beta )}\right) \end{equation}
where
 $\alpha$
is the angle between
 $s_2$
and the hypotenuse of the triangle
 $SC$
. As the ellipse lies in the
 $XOY$
plane. The spotlight position in
 $XYZ$
is defined as
 $p_l=(x_l,y_l,z_l)$
shown in Fig. 6. The
 $x_l$
and
 $y_l$
can be calculated using the rotation of the ellipse and
 $s_1$
.
 $z_l$
equals to the length of
 $s_2$
. Due to the symmetry of the ellipse, two possible positions for the vertex exist. Knowing the rough position of the insertion point allows us to narrow it down to one position. To derive the final result, the inverse rotations have to be applied to the vertex position.
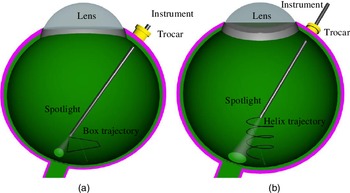
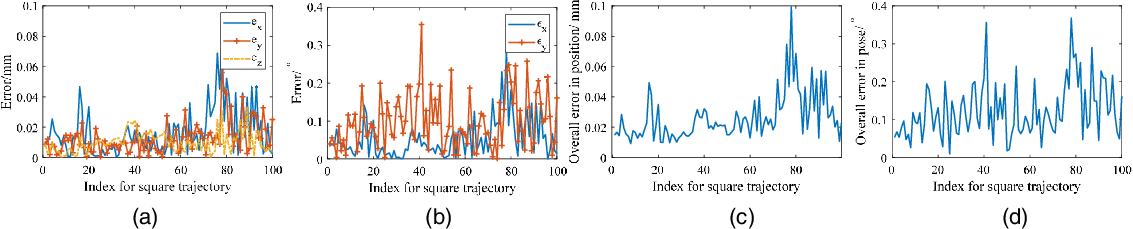
(a) Path of the spotlight used during the first test (Box). (b) Path of the spotlight used during the second test (Helix).

The error performance with the box trajectory for a single spotlight.
 $e_x$
,
 $e_y$
, and
 $e_z$
denote the error in
 $X_S$
,
 $Y_S$
, and
 $Z_S$
axis shown in Fig. 4, respectively.
 $\epsilon _x$
and
 $\epsilon _y$
denote the rotation error in
 $Y_S$
and
 $Z_S$
axis. (a) Positioning error in each direction
 $X_S$
,
 $Y_S$
, and
 $Z_S$
. (b) Orientation error in
 $Y_S$
and
 $Z_S$
. (c) Overall error in position. (d) Overall error of orientation.

The error performance with the box trajectory for multiple spotlights. (a) Positioning error in each direction
 $X_S$
,
 $Y_S$
, and
 $Z_S$
. (b) Orientation error in
 $Y_S$
and
 $Z_S$
. (c) Overall error in position. (d) Overall error of orientation.

3.5. Multiple spotlights
As the single spotlight may be prone to errors, we further analyze a setup with multiple spotlights. To evaluate the performance of such a setup, an instrument with three attached spotlights is evaluated. For each projection, the possible vertex positions are reconstructed independently following the algorithm for the single spotlight. To choose the resulting position, all possible combinations including three positions are evaluated based on their spatial difference. The set with the lowest difference is selected. From these three positions, the median position is selected as the final result. The workflow is depicted in Fig. 1(e–g).
Error for different tests.

The error performance with different light intensities. The whiskers show the minimum and maximum recorded distance changes. The start and end of the boxes denote the first and third quartile. The band, red dot, and cross represent the median, mean, and outliers of the recorded changes, respectively. (a) Positioning error with the square trajectory for a single spotlight. (b) Rotation error with the square trajectory for a single spotlight. (a) Positioning error with the helix trajectory for a single spotlight. (d) Rotation error with the helix trajectory for a single spotlight.

The error performance with different light intensities. (a) Positioning error with the square trajectory for multiple spotlights. (b) Rotation error with the square trajectory for multiple spotlights. (a) Positioning error with the helix trajectory for multiple spotlights. (d) Rotation error with helix trajectory for multiple spotlights.

4. Experiments and results
The localization algorithm is tested using a simulation. Realistic scenes are rendered with the 3D creation suite Blender 2.8. The algorithm is implemented using Python and the computer vision library OpenCV 3.4. The two versions (single spotlight and three spotlights) are compared by moving the spotlights along two fixed routes.
4.1. Blender scene
The eyeball is modeled using a sphere with a radius of 12 mm. To increase the realism, a retina texture is added. The camera is positioned above the sphere facing downwards. The properties of the camera and the spotlight, as introduced in the previous section, are listed in Table II.
For the version with multiple spotlights, the three spotlights are angled to ensure that their projection does not overlap for the given working range. The applied rotations are given in Table III.
4.2. Evaluation
For the evaluation, the instrument is moved along two given paths, and the localization algorithm is executed 100 times during the movement. The two paths are depicted in Fig. 7. During the movement, the pose of the instrument with the spotlight is constrained by the RCM.
The positioning error is defined as the Euclidean distance between the result of the localization and the real position. Additionally, the error for the rotation of the instrument, split into rotations around the
 $Y_S$
and
 $Z_S$
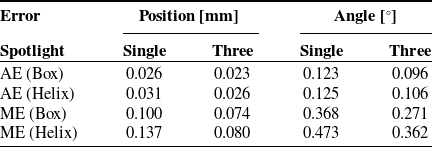
axis in Fig. 4, is given. The results are plotted in Figs. 8 and 9. The average errors (AE) and maximum errors (ME) are listed in Table IV.
The impact of the spotlight appearance is additionally tested by performing the simulations with different light intensities. This provides a sensitivity analysis of the proposed method to the selection of spotlight source power. The results are plotted in Figs. 10 and 11. When increasing the spotlight power to more than 0.25 W, the error performance reduces and keeps steady. An infrared light source and an infrared camera could be used to further enhance the sharpness of the spotlight projection.
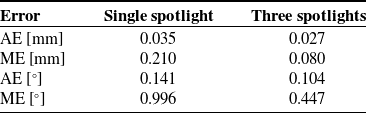
To evaluate the impact of small deformations (caused by retinal disease, e.g., macular hole) on the retinal surface, a setup is tested by adding 15 bumps with a diameter of around 0.5 mm and a deviation in height from the sphere surface of 0.1 mm [Reference Shin, Chu, Hong, Kwon and Byeon40]. The bumps are placed in a 3
 $\times$
5 grid formation across the area of interest. The result is shown in Table V with helix trajectory. The AE are very close to the test without the deformation. The maximum positioning error of the version with a single spotlight is significantly higher with a value of 0.210 mm compared to 0.133 mm in the multiple spotlights case. The maximum error of the version with multiple spotlights is equal to the maximum error during the test without the deformations.
Overall error for the deformed surface with helix trajectory.

5. Conclusion
In this paper, we presented a theoretical analysis of using a spotlight-based instrument localization for retinal surgery. Different from previous work, the projection of the spotlight is directly used to infer the pose of the instrument. The concept is tested using a high-fidelity simulation environment, both with a single and with three spotlights. In the conducted tests, the single spotlight version is able to localize the position of the instrument with an average error of 0.028 mm, while the multiple spotlights version yields 0.024 mm. This shows that the proposed concept works in theory, making the performance boundaries promising for retinal surgery. The main limitation of current work is that the eyeball is treated as a sphere, which however in the realistic the eyeball somehow has a degree of deformation. This need to be further verified in the real scenario. The robustness and reliability of method can be further improved via the online method. Inspired by the work from [Reference Su, Hu, Karimi, Knoll, Ferrigno and De Momi41], the future work would be using the artificial network method in the assembly line to learn and optimize for an online estimation which can enhance the robustness and accuracy of the instrument position and pose inside the eye.
Authors’ contributions
Mingchuan Zhou: Conceptualization, investigation, methodology, modeling, design, simulation, writing, funding. Felix Hennerkes: Methodology, modeling, writing. Jingsong Liu: Investigation, methodology. Zhongliang Jiang: Methodology, Writing, revising. Thomas Wendler and M. Ali Nasseri: Methodology, editing. Iulian Iordachita: Methodology, modeling, writing, and funding. Nassir Navab: Methodology, modeling, writing, revising, and funding.
Financial support
The authors would like to acknowledge the Editor-In-Chief, Associate Editor, and anonymous reviewers for their contributions to the improvement of this article. We would like to thank the financial support from the U.S. National Institutes of Health (NIH: grants no. 1R01EB023943-01 and 1R01 EB025883-01A1) and TUM-GS internationalization funding. The work is also supported by the ZJU-100 Young Talent Program.
Conflicts of interest
The authors declare none.