Implications
Body composition can be manipulated by diet in utero. In particular, enhanced prenatal nutrition can minimise intrauterine growth retardation and positively influence prenatal muscle development. This in turn can benefit birth weight, intra-litter variation in birth weight, growth and meat quality. As such, the nutritional strategies applied in this study, with a view to ‘programme’ postnatal traits in offspring have implications in overall pork production. In addition, the pig, as an omnivore with a similar digestive physiology and feeding pattern to the human, serves as a useful human model for the developmental origins of diseases such as obesity.
Introduction
A stimulus or insult, at critical period of prenatal development resulting in a permanent physiological response is defined as prenatal programming (Armitage et al., Reference Armitage, Khan, Taylor, Nathanielsz and Poston2004). Maternal nutrition during gestation is one such stimulus that can influence foetal growth and development, with the possibility of life-long implications.
The phenotype portrayed by muscle fibres and their numbers, are key to the quantity and quality of meat production (Rehfeldt et al., Reference Rehfeldt, Fiedler, Dietl and Ender2000). Prenatal programming is of relevance to the pork industry as increased nutrition at critical periods of development in utero influences muscle fibres (Dwyer et al., Reference Dwyer, Stickland and Fletcher1994; Gatford et al., Reference Gatford, Ekert, Blackmore, De Blasio, Boyce, Owens, Campbell and Owens2003; Bee, Reference Bee2004). It is commonly accepted that myogenesis in pigs occurs in a biphasic manner in which a first wave of myoblast fusion occurring from 25 to 50 days of gestation (dg) forms the primary fibres, whereas a second wave from 45 to 80 dg forms the secondary fibres (Ashmore et al., Reference Ashmore, Addis and Doerr1973; Swatland and Cassens, Reference Swatland and Cassens1973). Interestingly, the number of muscle fibres are considered fixed after birth (Wigmore and Stickland, Reference Wigmore and Stickland1983). In an effort to improve carcass and meat quality traits in offspring, attention has been focussed on the manipulation of muscle fibre populations at these key prenatal developmental stages.
Studies (Dwyer et al., Reference Dwyer, Stickland and Fletcher1994; Gatford et al., Reference Gatford, Ekert, Blackmore, De Blasio, Boyce, Owens, Campbell and Owens2003; Cerisuelo et al., Reference Cerisuelo, Baucells, Gasa, Coma, Carrion, Chapinal and Sala2009) have found that elevated maternal nutrition for sows between 25 to 50 dg and 45 to 80 dg, can impact the fibre number, secondary-to-primary fibre type ratio and oxidative fibre Type IIa composition in offspring, with often favourable downstream improvements in growth rate and gain : feed ratio. Furthermore, histological analysis of pigs from this trial revealed that increased maternal feeding in mid gestation improves the oxidative capacity of muscle (Markham et al., Reference Markham, Latorre, Lawlor, Ashton, McNamara, Natter, Rowlerson and Stickland2009). Indeed, a larger number of smaller or oxidative fibres can produce more favourable meat quality traits (more intense colour, optimum ultimate pH, less drip loss and improved tenderness of meat; Lengerken et al., Reference Lengerken, Wicke and Maak1997; Chang et al., Reference Chang, da Costa, Blackley, Southwood, Evans, Plastow, Wood and Richardson2003). However, some studies have found that increased maternal nutrition had no beneficial or even negative effects on growth, muscle fibres and meat quality of offspring (Nissen et al., Reference Nissen, Danielsen, Jorgensen and Oksbjerg2003; Heyer et al., Reference Heyer, Andersson, Lindberg and Lundström2004). In addition Lawlor et al. (Reference Lawlor, Lynch, O'Connell, McNamara, Reid and Stickland2007), observed an increase in the number of piglets born dead due to increased feeding from 50 to 80 dg.
As a true omnivore, the pig displays similar feeding patterns, digestive physiology and dietary habits to humans (Patterson et al., Reference Patterson, Lei and Miller2008). Accordingly, investigation into pig gestation feeding and the effects on foetal development, body composition and growth patterns provide a model for understanding the mechanisms of early programming in humans, which influence health risks later in life (McMillen and Robinson, Reference McMillen and Robinson2005). The underlying mechanisms of intrauterine programming are thought to be a response to nutrition altering the maternal and foetal endocrine axes (Fowden and Forhead, Reference Fowden and Forhead2004; Musser et al., Reference Musser, Davis, Dritz, Tokach, Nelssen, Minton and Goodband2004). Nutrients may interact directly with genes and their regulatory elements at the cellular level, altering patterns of growth and gene expression (Maloney and Rees, Reference Maloney and Rees2005). As such, investigation of the transcript abundance of genes associated with regulatory, metabolic and proteolytic pathways in skeletal muscle may help to elucidate the biological mechanisms of a particular phenotype. Insulin-like growth factor I (IGF1) is a 70 amino acid potent hormone with established effects on postnatal growth and development (Baker et al., Reference Baker, Liu, Robertson and Efstratiadis1993; Laron, Reference Laron2001). PAX7 expressed by satellite cells encodes a transcription factor, paired box domain-7, that can regulate proliferation/differentiation into mature cells in muscle (Seale et al., Reference Seale, Sabourin, Girgis-Gabardo, Mansouri, Gruss and Rudnicki2000; Patruno et al., Reference Patruno, Caliaro, Maccatrozzo, Sacchetto, Martinello, Toniolo, Reggiani and Mascarello2008). MYOG codes for a basic-helix-loop-helix transcription factor, myogenin, involved in myogenesis (Berkes and Tapscott, Reference Berkes and Tapscott2005). Calcineurin, encoded by the gene protein phosphatase 3 catalytic subunit – α-isoform (PPP3CA), is a protein phosphatase located in the nuclei of muscle cells (Torgan and Daniels, Reference Torgan and Daniels2006) that controls oxidative fibre type gene expression in skeletal muscle (Chin et al., Reference Chin, Olson, Richardson, Yang, Humphries, Shelton, Wu, Zhu, Bassel-Duby and Williams1998; da Costa et al., Reference da Costa, Edgar, Ooi, Su, Meissner and Chang2007). Peroxisome proliferator activated-receptors-γ (PPAR-γ) and -δ (PPAR-δ) are members of a family of nuclear transcriptions factors, fundamentally important for adipogenesis and energy homoeostasis (Lowell, Reference Lowell1999; van Raalte et al., Reference van Raalte, Li, Pritchard and Wasan2004). CS codes for the key enzyme citrate synthase involved in the first step of the citric acid cycle and, as such, is viewed as a metabolic marker for oxidative and respiratory capacity (Spina et al., Reference Spina, Chi, Hopkins, Nemeth, Lowry and Holloszy1996). CAPN1A codes for a proteolytic enzyme, Calpain 1, whereas CAST codes for its endogenous inhibitor calpastatin. Both enyzmes are members of the family of intracellular nonlysosomal Ca2+-regulated proteinases that participate in the proteolytic breakdown of muscle post mortem (pm; Goll et al., Reference Goll, Thompson, Li, Wei and Cong2003), but also have active roles in muscle growth, regulating myoblast fusion (Barnoy et al., Reference Barnoy, Maki and Kosower2005), attachment and spreading (Mazères et al., Reference Mazères, Leloup, Daury, Cottin and Brustis2006).
In this study, sow gestation feed levels were increased during the periods of critical muscle fibre development in offspring: between 25 to 50 dg, 50 to 80 dg and 25 to 80 dg, in an effort to beneficially ‘programme’ offspring for later life. To follow on from Markham et al. (Reference Markham, Latorre, Lawlor, Ashton, McNamara, Natter, Rowlerson and Stickland2009) observations, this study primarily investigates the transcription of a panel of genes expressed in offspring skeletal muscle, to determine whether changes in the expression of these genes could contribute to phenotypes (growth rate, carcass quality and meat quality).
Material and methods
Animals and treatments
The animal trial was conducted at the Teagasc, Pig Development Unit, Animal & Grassland Research & Innovation Centre, Moorepark, Fermoy, Co. Cork, Ireland and is described previously by Markham et al. (Reference Markham, Latorre, Lawlor, Ashton, McNamara, Natter, Rowlerson and Stickland2009). In this trial, 64 multiparous Landrace × Large White sows were artificially inseminated using pooled semen from seven Hylean Large White boars (Hermitage AI, Co. Kilkenny, Ireland). According to suppliers, parentage is free from the mutated Ryr and RN genes. The sows, balanced for parity at mating, were assigned to the following gestation feeding treatments: a standard control gestation diet at a feed allocation of 2.3 kg/day (C), feed allowance increased to 4.6 kg/day at early 25 to 50 dg (E), at mid 50 to 80 dg (M) and at early to mid 25 to 80 dg (EM). Periods selected represent key development stages of the primary and secondary muscle fibres in utero. At the end of each feeding treatment, sow feed allowance returned to 2.3 kg/day and between 110 dg and farrowing, all sows were fed 1.8 kg/day of lactation diet. Once farrowed, sows were liquid fed a lactation diet. Ingredient composition and chemical analysis of the gestation and lactation diets are described by Markham et al. (Reference Markham, Latorre, Lawlor, Ashton, McNamara, Natter, Rowlerson and Stickland2009).
At farrowing, each pig from each litter was individually weighed and tagged for identification purposes. Litter size was standardised at farrowing to approximately 10 pigs per litter by cross fostering within treatment groups. Creep feed was fed to all piglets from 12 days of age to weaning. At weaning three pigs were selected, within gender (females and entire males), from each of the 64 litters based on birth weight category (Light, Medium and Heavy). The absolute Lightest, Heaviest and Medium weight pigs established within each litter were selected. A total of 192 pig's (96 male and 96 female) weaning weight was recorded and the pigs were penned individually and followed through to day 49. After which, due to housing restrictions, all offspring (six female and six male) from four randomly selected litters per treatment were removed. As such, 144 pigs were followed through to slaughter at 130 days post weaning (pw). Pig diets from weaning to slaughter are described previously by Markham et al. (Reference Markham, Latorre, Lawlor, Ashton, McNamara, Natter, Rowlerson and Stickland2009). Pigs were fed three times daily in the first week and ad libitum thereafter. Intakes were recorded weekly. Pigs were weighed at day 14, 28, 49, 91 and 130 pw. Average daily gain (ADG) was calculated as: (weight change/number of days) × 1000. Feed conversion efficiency (FCE) was calculated as: average daily feed intake/ADG. Housing conditions for sows and pigs are described according to Lawlor et al. (Reference Lawlor, Lynch, O'Connell, McNamara, Reid and Stickland2007).
Carcass composition
Pre-slaughter and slaughter conditions were identical for each slaughter day. On a slaughter day, 18 pigs were transported 107 km to the abattoir. After a 2-h lairage, pigs (gender mixed before transport) were killed by bleeding after CO2 stunning, in groups of two. There were eight slaughter days from November to March. On a given slaughter day, all pigs originated from a single treatment. There were two slaughter days for each treatment (two batches). Tissue for meat quality and gene expression was harvested from batch 1. Muscle depth and backfat thickness, at 6 cm from the edge of the split back at the level of the 3rd and 4th last rib, was measured using a Hennessy grading Probe (Hennessy and Chong, Auckland, New Zealand). Lean content was estimated according to the following formula (Department of Agriculture and Food (Ireland), 2001): estimated lean meat content (%) = 60.30 – 0.847x + 0.147y, where x = fat depth (mm); y = muscle depth (mm). Carcass weight (cold) was estimated as the weight of the hot eviscerated carcass, (minus tongue, bristles, genital organs, kidneys, flare fat and diaphragm) 45 min after harvest × 0.98. Dressing out percentage was calculated as (carcass weight/body weight (BW) at harvest) × 100.
Tissue sampling
At harvest, within 45 min pm the complete semimembranosus (SM) and the semitendinosus (ST) muscles were excised from the left hind limb of a subsection of pigs: Treatment C (n = 15), Treatment E (n = 16), Treatment M (n = 18) and Treatment EM (n = 18) for meat quality and RNA analysis, respectively. Meat quality analyses were performed on the SM due to the limited availability of ST tissue after sampling for gene expression and fibre typing (Markham et al., Reference Markham, Latorre, Lawlor, Ashton, McNamara, Natter, Rowlerson and Stickland2009). Weight, length and girth measurements were also recorded for the complete ST. For RNA analysis, a complete transverse slice of the ST (0.5 cm in depth) from the mid-belly region was excised and immediately immersed in RNA-later® reagent (Ambion Inc., Texas, USA), according to the manufacturer's instructions, and stored at 4°C overnight. Within 24 h of harvest, samples were transferred to −80°C for archival storage.
Meat quality measurements
At 45 min pm, muscle pH was measured in the mid region of the whole SM using a WTW 325 pH meter (WTW GmbH, Weilheim, Germany) with a Mettler Toledo (Carl Stuart Ltd, Dublin 24, Ireland) combination spear probe. Muscle temperature was also measured at this time using the WTW TFK 325/HC temperature sensor (WTW GmbH, Weilheim, Germany). Muscle colour was assessed (from an average of six locations per sample) with a Minolta CR-300 colorimeter (Minolta Co. Ltd, Osaka, Japan) using the Hunter Lab colour scale (lightness (L*), redness (a*) and yellowness (b*)). After storage at 4°C overnight, pH, temperature and colour were measured at 24 h pm. At 24 h pm each SM per pig was uniformly sectioned for drip loss and compositional analysis. SM sections for compositional analysis were vacuum-packed and stored at −20°C until future use. Drip loss was determined in the SM according to the method of Honikel (Reference Honikel1998) and calculated as the loss in weight from 24 to 48 h pm. Samples for intramuscular fat (IMF) and total protein analysis were prepared by blending 100 g SM into a smooth homogenous paste using a mini blender. IMF content was analysed using the CEM SMART Trac™ Rapid Moisture/Fat analyser (CEM Corporation, NC, USA) according to Leffler et al. (Reference Leffler, Moser, McManus, Urh, Keeton and Claflin2008) methodology. Total protein determination was carried out according to procedure 992.15 of the Association of Official Analytical Chemists International (2006) with a LECO FP 528 protein analyser (Leco Corporation, MI, USA).
RNA extraction and cDNA synthesis
Samples of ST submerged in RNA-later® reagent were defrosted at room temperature for 30 min. As muscle fibre type may influence gene expression patterns, the deep and superficial regions of the ST were separated for independent analysis. Deep and superficial regions were visually identified based on colour, with red indicating deep muscle of high myogloblin content and the noticeable paler region identified as superficial. Of each tissue type, 50 mg was excised and total RNA extracted by homogenisation using the Ultra-Turrax® T25 Basic (IKA®, Werke GmbH & Co. KG, Germany) in 1 ml of TriPure isolation reagent (Roche Diagnostics, IN, USA), according to the manufacturer's instructions. Quality and quantity of total RNA was determined by optical density readings at 260 nm and 280 nm using a Nanodrop ND-1000 (Thermo scientific, Wilmington, DE, USA) and by electrophoresis through glycoxyl gels (Ambion). One microgram of quality assessed total RNA was DNAse treated and reverse transcribed into cDNA using the Quantitect® Reverse Transcription Kit (Qiagen, Crawley, West Sussex, UK), according to manufacturer's instructions into a final volume of 20 μl and stored at −80°C.
Absolute quantification by real-time PCR
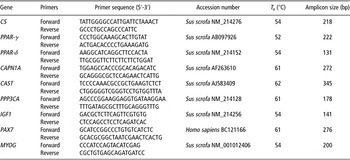
Primers for real-time PCR were designed across intron/exon boundaries where possible, to prevent amplification from genomic DNA. All primers were designed based on porcine GenBank sequences, except PAX7 primers. PAX7 primers were designed based on the complete human sequence. Table 1 lists the GenBank accession numbers, primer sequences, annealing temperatures and amplicon size. Absolute quantitative analysis of the candidate genes was performed using standards, as a dilution series of either plasmid DNA or PCR amplicon. As a quality control measure, real-time PCR assays of PPP3CA used both plasmid DNA and PCR amplicon methods. The results of the expression level were comparable across both methods.
Primers for real-time PCR

T a = annealing temperature; CS = citrate synthase; PPAR-γ = peroxisome proliferator activated-receptor-γ; PPAR-δ = peroxisome proliferator activated-receptor-δ; CAPN1A = calpain 1; CAST = calpastatin; PPP3CA = protein phosphatase 3 catalytic subunit – α-isoform; IGF1 = insulin-like growth factor 1; PAX7 = paired box protein 7; MYOG = myogenin.
For CS, CAPN1A, CAST, PPAR-γ, PPP3CA and PAX7 real-time PCR was performed in a LightCycler 480 instrument (Roche Diagnostics GmbH, Mannheim, Germany) using the LightCycler 480 SYBR Green I Master kit (Roche Diagnostics GmbH, Mannheim, Germany). Plasmid standards were created by cloning an amplified PCR product into PCR4-TOPO vector using the TOPO-TA cloning system (Invitrogen, Life Technologies, Carlsbad, CA, USA), following the manufacturer's guidelines. The cloned amplicon was confirmed by sequencing (Lark Technologies (Europe), Essex, UK). For real-time PCR for each gene of interest, plasmid DNA was linearised and quantified using the Nanodrop ND-1000 (Thermo scientific), enabling preparation of serially diluted plasmid DNA as the standard curve. For each 10 μl Lightcycler reaction, 1 μl of test cDNA template or serially diluted standard was used. Each programme began with initial denaturation at 95°C for 10 min, followed by 40 cycles of quantification consisting of 10 s denaturation at 95°C, 5 s annealing and 15 s elongation at 72°C. Annealing temperatures for each gene are specified in Table 1. Melting curve analysis was performed on each product by heating from a temperature 5°C above the annealing temperature to 95°C in the continuous fluorescence acquisition mode to ensure specificity of real-time products.
For PPAR-δ, IGF1, MYOG and PPP3CA real-time PCR was performed on the MJ Research Chromophore Real Time PCR Detector (Bio-Rad Laboratories Ltd, Hertfordshire, UK) using the QuantiTect SYBR Green kit (QIAGEN, Ltd, Sussex, UK). For generation of standards, PCR amplicons were purified from low melting agarose (Sigma UK Ltd, Poole, UK) using QIAEX II kit (QIAGEN), according to manufacturers instructions. PCR amplicons were confirmed by sequencing (Gene Service Ltd, Cambridge, UK). DNA concentration was quantified using the Nanodrop ND-1000 (Thermo Scientific) allowing serial dilution of amplicon to create the standard curve. For each 20 μl real-time PCR reaction, 2 μl of test cDNA or serially diluted standard was used. Each programme included denaturation at 95°C for 15 min, followed by 35 cycles of quantification consisting of 5 s denaturation at 94°C, 25 s annealing (annealing temperatures in Table 1) and 15 s elongation at 72°C. Melting curve analysis was performed on each product as described previously for real-time PCR using plasmid DNA method.
For each gene, real-time PCR runs were performed at least in duplicate to ensure reproducibility. For all values the absolute concentration of all genes were normalised to total RNA and expressed as copy number per 1 μg of total RNA.
Statistical analysis
The effect of treatment, gender, birth weight category and their interactions (when statistically significant), on growth performance, carcass quality, meat quality and gene expression of offspring were determined by mixed models (Statistical analysis software (SAS), 2006). Sow nested within treatment was included as a random effect. The number of pigs born alive was included as a covariate when significant. FCE and gene expression data were not normally distributed and as such, data were log transformed. For means separation, differences among least square means of control v. all other treatments were compared using a t-test (PDIFF option of SAS). The results were considered statistically significant when P < 0.05 and were considered as trends when 0.05 ⩽ P ⩽ 0.10.
Results
Effect of birth weight category, gender and treatment on offspring growth performance from birth to slaughter
Birth weight category, irrespective of treatment, influenced pig weight and ADG throughout life. Heavy, Medium and Light birth weight category pigs were 96.0, 95.6 and 87.3 kg at day 130 pw (s.e.m. = 1.50 kg; P < 0.001) and grew at 666, 669 and 618 g/day from weaning to day 130 pw (s.e.m. = 11.0 g/day; P < 0.001). Gender also affected ADG and FCE from day 91 to 130 pw (P < 0.001) with ADG of 796 and 891 g/day (s.e.m. = 14.0 g/day) and FCE of 3.14 and 2.71 (s.e.m. = 0.049) for females and males, respectively.
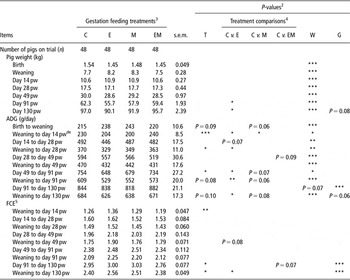
The effect of treatment on the growth and FCE of offspring is shown in Table 2. Treatment E pigs were both lighter at day 91 and 130 pw (P < 0.05) and had lower ADG from weaning to day 28 pw, day 49 to day 91 pw, weaning to day 91 and weaning to day 130 pw (P < 0.05), than the control pigs. Similarly, ADG tended to be lower for Treatment M compared with the control (P < 0.10) from day 49 to day 91 pw, weaning to day 91 pw and weaning to day 130 pw. FCE from weaning to day 130 pw was poorer for Treatment E offspring compared with the control offspring (P < 0.05). There was a treatment by birth weight category interaction for ADG from weaning to day 14 pw (P < 0.05). In the Heavy weight category, only Treatments E and M pigs had lower ADG than the control. In addition, the effect of treatment on ADG from weaning to day 14 pw differed between females and males (P < 0.05), with Treatment E and M females having lower ADG than their counterparts in the control.
Effect of treatment on offspring performance from birth to slaughterFootnote 1

C = control; E = early; M = mid; EM = early to mid; T = treatment; W = birth weight; G = gender; pw = post weaning; ADG = average daily weight gain; FCE = feed conversion efficiency; LS = least square.
Statistical differences are indicated by *P < 0.05; **P < 0.01; ***P < 0.001.
1 LS means of treatment effect are presented in table.
2 P-values are the effects of overall T, W and G.
3 Feed allocation of 2.3 kg/day throughout gestation for C sows. Feed allocation increased to 4.6 kg/day: at E = 25 to 50 dg, M = 50 to 80 dg and EM = 25 to 80 dg.
4 Comparisons represent T effect differences among LS means of C compared with Treatments E, M and EM. For means separation, differences among LS means were compared using a t-test.
5 Back transformed LS means. s.e.m. extracted from non-log transformed analysis of data.
d Treatment by W interaction (P < 0.05).
e Treatment by G interaction (P < 0.05).
Effect of birth weight category, gender and treatment on offspring carcass quality
At slaughter, Heavy and Medium birth weight category pigs had similar carcass weight and both were heavier than the Light category pigs (72.7, 72.5 and 65.8 kg, respectively; s.e.m. = 1.22 kg; P < 0.001). Similarly, for Heavy, Medium and Light pigs, muscle depth was 51.1, 51.2 and 49.3 mm (s.e.m. = 0.60 mm; P < 0.05), ST weight was 0.47, 0.48 and 0.43 kg (s.e.m. = 0.014 kg; P < 0.05) and ST girth was 21.71, 22.12 and 20.26 cm (s.e.m. = 0.409 cm; P < 0.001). Females had a higher dressing out (76.8 v. 74.5%; s.e.m. = 0.22%; P < 0.001), lower carcass backfat (9.7 v. 10.9 mm; s.e.m. = 0.26 mm; P < 0.001), greater muscle depth (51.9 v. 49.2 mm; s.e.m. = 0.53 mm; P < 0.001) and higher lean meat content (59.7 v. 58.3%; s.e.m. = 0.23%; P < 0.001), than males. In addition, females had a greater ST weight (0.48 v. 0.44 kg; s.e.m. = 0.013 kg; P < 0.05), ST length (18.85 v. 18.31 cm; s.e.m. = 0.196 cm; P = 0.07) and ST girth (21.78 v. 20.94 cm; s.e.m. = 0.396 cm; P = 0.08), than males.
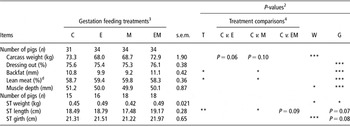
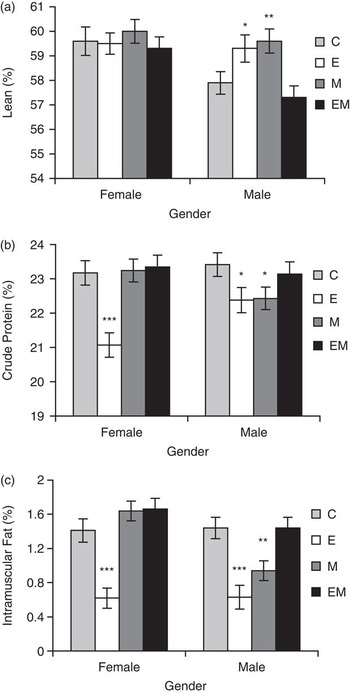
Carcass weight for Treatments E and M tended to be lighter than the control (P = 0.06, P = 0.10, respectively; Table 3). Treatment M pigs also had a lower back fat thickness and a shorter ST muscle than the control pigs (P < 0.05). At slaughter, only Treatments E and M male pigs had a greater lean content than their control counterparts (P < 0.05; Figure 1a).
Effect of treatment on carcass quality of offspringFootnote 1

C = control; E = early; M = mid; EM = early to mid; T = treatment; W = birth weight; G = gender; ST = semitendinosus; LS = least square.
Statistical differences are indicated by *P < 0.05; **P < 0.01; ***P < 0.001.
1 LS means of treatment effect are presented in table.
2 P-values are the effects of overall T, W and G.
3 Feed allocation of 2.3 kg/day throughout gestation for C sows. Feed allocation increased to 4.6 kg/day: at E = 25 to 50 dg, M = 50 to 80 dg and EM = 25 to 80 dg.
4 Comparisons represent treatment effect differences among LS means of C compared with Treatments E, M and EM. For means separation, differences among LS means were compared using a t-test.
d Treatment by G interaction (P < 0.05).
Treatment by gender interactions (P < 0.05) observed for carcass lean (a), semimembranosus crude protein (b) and semimembranosus intramuscular fat (c). Presented are female and male pigs from Treatments C (control), E (early – 25 to 50 dg), M (mid – 50 to 80 dg) and EM (early to mid – 25 to 80 dg). Within gender, least square means of control were compared with all treatments. For means separation, means were compared using a t-test. Treatments differed significantly from control *(P < 0.05); **(P < 0.01); ***(P < 0.001). Error bars represent standard error of means.

Effect of birth weight category, gender and treatment on meat quality of SM muscle of offspring
Birth weight category, irrespective of the treatment, influenced meat redness24 h with Heavy, Medium and Light pigs exhibiting values of 8.93, 8.33 and 7.65, respectively (s.e.m. = 0.292; P < 0.01). IMF content was highest in Medium pigs (1.29%) and lowest in Heavy pigs (1.03%) while being intermediate for Light pigs (1.24%; s.e.m. = 0.078%; P < 0.05). Gender influenced meat quality traits, with female pigs having a lower pH24 min pm (5.75 v. 5.83; s.e.m. = 0.033; P < 0.05), paler meat at 24 h pm (48.97 v. 47.61; s.e.m. = 0.366; P < 0.05) and greater IMF (1.26 v. 1.10%; s.e.m. = 0.064%; P < 0.05), than males, respectively.
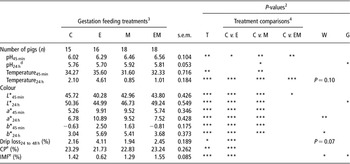
The pH45 min was higher in the SM muscle of pigs from Treatments E, M and EM than for control pigs (P < 0.05; Table 4). At 24 h pm a higher pH was still observed for Treatment M compared with control (P < 0.05). The SM muscle from Treatment M pigs had a lower temperature45 min than the control (P < 0.01). The SM muscle from Treatment M and EM pigs also had lower temperature24 h than the control (P < 0.001). In contrast, the temperature24 h of the SM from Treatment E pigs was higher than the control (P < 0.001). Lightness of the SM was reduced at 45 min and 24 h pm for Treatments E and M, whereas redness and yellowness were increased, compared with the control (P < 0.001). A reduction in lightness45 min was also observed for Treatment EM (P < 0.05). Drip loss24 to 48 h was higher, whereas crude protein (CP) and IMF contents were lower in SM muscle from Treatment E than control pigs (P < 0.001). Only for Medium weight category pigs, pH24 h in the SM tended to be higher for Treatment M than the control (6.00 v. 5.73; s.e.m. = 0.080; P = 0.06). There were treatment by gender interactions for the SM muscle CP (P < 0.05; Figure 1b) and IMF (P < 0.01; Figure 1c), with Treatment M males having lower levels than the control males.
Effect of treatment on meat quality of offspringFootnote 1

C = control; E = early; M = mid; EM = early to mid; T = treatment; W = birth weight; G = gender; L* = lightness; a* = reddness; b* = yellowness; IMF = intramuscular fat; LS = least square.
Statistical differences are indicated by *P < 0.05; **P < 0.01; ***P < 0.001.
1 LS means of treatment effect are presented in table.
2 P-values are the effects of overall T, W and G.
3 Feed allocation of 2.3 kg/day throughout gestation for C sows. Feed allocation increased to 4.6 kg/day: at E = 25 to 50 dg, M = 50 to 80 dg and EM = 25 to 80 dg.
4 Comparisons represent treatment effect differences among LS means of C compared with Treatments E, M and EM. For means separation, differences among LS means were compared using a t-test.
d Treatment by W interaction tendency (P = 0.06).
e Treatment by G interaction (P < 0.05).
Effect of treatment on candidate gene expression in the ST muscle of offspring
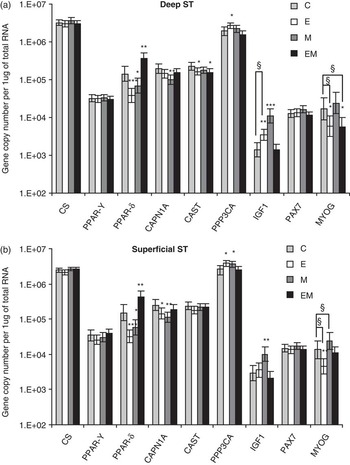
Candidate gene expression in the deep and superficial regions of the ST muscle for Treatments C, E, M and EM are presented in Figure 2a and b. Treatment by gender influenced MYOG expression levels, with deep ST muscle in Treatments E and EM females having lower levels of MYOG mRNA than their control counterparts (P < 0.05). In the superficial ST, MYOG gene expression was downregulated for Treatment E females (P < 0.01) and upregulated for Treatment M females (P < 0.05), with no differences between treatments for male pigs. IGF1 gene expression was upregulated in the deep ST for Treatment E but this difference was only observed for female and not male pigs (P < 0.01). In both deep and superficial ST, the IGF1 gene was upregulated for Treatment M (P < 0.01) over the control. In the deep and superficial ST muscle regions, PPAR-δ mRNA levels were higher in Treatment EM (P < 0.01) and lower in Treatments E (P < 0.001) and M (P < 0.05), compared with the control. In the deep and superficial ST, expression of the gene CAPN1A, coding for the proteolytic enzyme, was downregulated in Treatment M compared with the control (P < 0.01). Similarly, CAPN1A mRNA levels were lower in Treatment E compared with the control, but only in the superficial ST muscle region (P < 0.05). Gene expression of CAST, which codes for the calpain inhibitor, was also downregulated in the deep ST muscle region for Treatments E and EM (P < 0.05), when compared with the control. Levels of PPP3CA mRNA were increased for Treatment E in the deep ST (P < 0.05) and increased for Treatments E and M in the superficial ST muscle region (P < 0.05), compared with control. The mRNA levels of CS, PPAR-γ and PAX7 were no different from the control in either muscle region (P > 0.05).
Gene expression of: CS = citrate synthase; PPAR-γ = peroxisome proliferator activated-receptor-γ; PPAR-δ = peroxisome proliferator activated-receptor-δ; CAPN1A = calpain 1; CAST = calpastatin; PPP3CA = protein phosphatase 3 catalytic subunit – α-isoform; IGF1 = insulin-like growth factor 1; PAX7 = paired box protein 7; and MYOG = myogenin in the deep (a) and superficial (b), portion of the semitendinosus (ST) muscle for Treatments C (control), E (early – 25 to 50 dg), M (mid – 50 to 80 dg) and EM (early to mid – 25 to 80 dg). For each gene, least square means of control were compared with all treatments. For means separation, differences among least square means were compared using a t-test. Treatments differed significantly from control *(P < 0.05); **(P < 0.01); ***(P < 0.001). §Treatment by gender interaction: significant in female pigs only. In addition, MYOG mRNA levels increased in superficial ST of Treatment M female pigs (P < 0.05). Error bars represent 95% confidence intervals.

Discussion
Increased maternal nutrition from 25 to 50 dg (Treatment E)
The lower growth rates and a tendency towards a lighter carcass in Treatment E offspring compared with control pigs shows similarities with previous research (Nissen et al., Reference Nissen, Danielsen, Jorgensen and Oksbjerg2003). Interestingly in our study, the reduced MYOG mRNA levels in the ST muscle of Treatment E female offspring, may have contributed to the lower BW in this group, as previous studies have shown that MYOG-null mice have reduced growth rates (Knapp et al., Reference Knapp, Davie, Myer, Meadows, Olson and Klein2006). Circulating IGF1 has been shown to promote lean deposition (Owens et al., Reference Owens, Gatford, Walton, Morley and Campbell1999). Although a greater lean content was observed in Treatment E male offspring in this study, this cannot be explained by local IGF1 mRNA levels, which were only increased in the deep region of ST muscle for Treatment E females and not males. Perhaps, the local IGF1 levels in muscle differ from circulating IGF1 levels (Eliakim et al., Reference Eliakim, Moromisato, Moromisato, Brasel, Roberts and Cooper1997). Treatment E offspring had a lower IMF in the SM compared with control but had no observable difference in PPAR-γ expression. This is in contrast to Luo et al. (Reference Luo, Wei, Huang, Zhou, Jiang and Peng2009), who showed a positive relationship between PPAR-γ and IMF in pigs using a 10% linseed diet. Instead, this study noted a decrease in PPAR-δ levels in Treatment E offspring. Whether IMF is influenced by PPAR-δ levels is unknown. Luo et al. (Reference Luo, Wei, Huang, Zhou, Jiang and Peng2009), suggest that PPAR-δ is not directly involved in IMF, but can activate PPAR-γ through n-3 polyunsaturated fatty acid enrichment.
The drip loss24 to 48 h of the SM muscle was increased and therefore the water-holding capacity reduced in Treatment E offspring compared with the control. Excessive drip loss in packaging is undesirable and the most important physical factors influencing it are temperature pm and pH fall (Fernandez and Tornberg, Reference Fernandez and Tornberg1994). Indeed, it is well documented that a fast pH decline while muscle temperature is still high can increase drip loss (Briskey and Wismer-Pedersen, Reference Briskey and Wismer-Pedersen1961). Our study observed that Treatment E pigs had significantly higher initial pH45 min, but temperature45 min was no different from the control. Drip loss, was however, measured between 24 and 48 h pm. At this stage, although pH24 h was similar for both treatments, there was unexpectedly a 2.5°C higher temperature24 h for Treatment E compared with control offspring, which may have contributed to drip loss phenotype. Although pre- and post-slaughter management of pigs and meat were kept identical throughout the study to minimise the effect of slaughter day, the confounding nature of slaughter day on treatment cannot be ruled out on the meat quality parameters pH and temperature.
A greater proteolysis of key muscle proteins (desmin, viniculin and talin) can minimise lateral shrinkage of myofibrils in pm muscle and the forced expulsion of water (Melody et al., Reference Melody, Lonergan, Rowe, Huiatt, Mayes and Huff-Lonergan2004; Huff-Lonergan and Lonergan, Reference Huff-Lonergan and Lonergan2005). Interestingly, mRNA levels of CAPN1A, were lower in superficial ST muscle. Perhaps, a combination of higher temperature24 h and lower proteolytic activity may have contributed to the increased drip loss in Treatment E pigs.
The ST muscle of Treatment E offspring displayed elevated mRNA levels of PPP3CA. Coding for the Ca2+-activated calcineurin, this protein phosphatase has been shown to activate the slow oxidative muscle fibre type programme through the calcineurin/nuclear factor activated transcription factor pathway (Chin et al., Reference Chin, Olson, Richardson, Yang, Humphries, Shelton, Wu, Zhu, Bassel-Duby and Williams1998). Oxidative fibres are arguably more beneficial for meat quality than glycolytic fibres, conferring a more intense colour, higher ultimate pH, increased water-holding capacity and improved tenderness (Chang et al., Reference Chang, da Costa, Blackley, Southwood, Evans, Plastow, Wood and Richardson2003). Interestingly, fibre typing of these same pigs at day 131 pw revealed increases in the overall oxidative Type IIa fibre population in the ST of Treatment E pigs (Markham et al., Reference Markham, Latorre, Lawlor, Ashton, McNamara, Natter, Rowlerson and Stickland2009). Correspondingly, the lack of an effect on the CS mRNA levels, a metabolic marker in assessing oxidative and respiratory capacity, was surprising. CS is just one of several genes coding for proteins involved in the citric acid cycle (McCammon et al., Reference McCammon, Epstein, Przybyla-Zawislak, McAlister-Henn and Butow2003) and is subjected to post-translational modification (Bloxham et al., Reference Bloxham, Parmelee, Kumar, Wade, Ericsson, Neurath, Walsh and Titani1981).
Meat quality analysis for Treatment E also revealed redder meat indicating a higher myoglobin content (MacDougall, Reference MacDougall1982). It is noteworthy that the unexpectedly high drip loss and this redder colour of meat from Treatment E offspring may allow classification as red, soft and exudative meat (van Laack et al., Reference van Laack, Kauffman, Sybesma, Smulders, Eikelenboom and Pinheiro1994; Cheah et al., Reference Cheah, Cheah and Just1998; van Laack and Kauffman, Reference van Laack and Kauffman1999). Although drip loss in this study was not as severe (>5%) as in these previous studies, it reached 4.1% in Treatment E, which is within the 3% to 5% drip losses used to describe ‘red and watery’ meat (Fisher, Reference Fisher2007).
Increased maternal nutrition from 50 to 80 dg (Treatment M)
Increasing the maternal nutrition from 50 to 80 dg (Treatment M) upregulated IGF1 expression in the ST muscle of offspring. However, the elevated levels of gene transcripts of this potent growth factor did not translate into increased ST muscle weight or overall BW growth for Treatment M pigs. In fact, average daily growth rates tended to be lower from weaning to day 130 pw with carcass weight tending to be lighter than the control pigs. Perhaps, elevated IGF1 levels results in partitioning growth towards altering the body composition rather than overall growth (Pursel et al., Reference Pursel, Mitchell, Bee, Elsasser, McMurtry, Wall, Coleman and Schwartz2004; Bee et al., Reference Bee, Pursel, Mitchell, Maruyama, Wells, Solomon, Wall, Coleman and Schwartz2007). Indeed, Treatment M male offspring possessed more carcass lean tissue and less subcutaneous adipose tissue, than the control. In IGF1 overexpression experiments, the hypertrophic effect on muscle is induced mainly through the activation of satellite cells (Barton-Davis et al., Reference Barton-Davis, Shoturma and Sweeney1999). However, in this study, mRNA levels of the satellite cell marker PAX7 were unchanged across treatment groups. PAX7 is expressed by quiescent, active and proliferating satellite cells (Seale et al., Reference Seale, Sabourin, Girgis-Gabardo, Mansouri, Gruss and Rudnicki2000; Relaix et al., Reference Relaix, Rocancourt, Mansouri and Buckingham2005). Perhaps, differences existed in the level of satellite cell activation between treatments. Alternatively, IGF1 can also mediate part of its hypertrophic effect via direct action on differentiated myofibres (Barton-Davis et al., Reference Barton-Davis, Shoturma and Sweeney1999). However, Markham et al. (Reference Markham, Latorre, Lawlor, Ashton, McNamara, Natter, Rowlerson and Stickland2009) found no effect of increased maternal nutrition on myofibre cross-sectional area in the ST from these same animals. Certainly, this might suggest that increased lean and reduced carcass fat could be a function of lower BW at slaughter.
Carcass lean displays an inverse relationship with carcass fat (Sládek et al., Reference Sládek, Čechová and Mikulem2004). Interestingly, as carcass fat and IMF in male offspring were reduced, PPAR-δ gene expression was significantly lower in both the deep and superficial ST regions from Treatment M offspring, compared with control samples. PPAR-δ plays a role in lipid oxidation (Tanaka et al., Reference Tanaka, Yamamoto, Iwasaki, Asaba, Hamura, Ikeda, Watanabe, Magoori, Ioka, Tachibana, Watanabe, Uchiyama, Sumi, Iguchi, Ito, Doi, Hamakubo, Naito, Auwerx, Yanagisawa, Kodama and Sakai2003) and has also been implicated in regulating adipogenesis in mouse myoblasts (Yu et al., Reference Yu, Wu, Cheng, Mersmann and Ding2008). However, according to Luo et al. (Reference Luo, Wei, Huang, Zhou, Jiang and Peng2009), PPAR-γ is more closely related to IMF content than PPAR-δ and in our study PPAR-γ remained unchanged between treatments.
The SM of Treatment M offspring was darker and redder in colour than that of the control. A darker colour measured by the Hunter Lab L* scale, may not be surprising as the mRNA levels of CAPN1A, which codes for the proteolytic enzyme calpain 1, were lower in the ST muscle. Indeed, increased proteolysis is associated with paler colour and a condition known as pale soft exudative (Wilhelm et al., Reference Wilhelm, Maganhini, Hernández-Blazquez, Ida and Shimokomaki2010). However, drip loss was not decreased in Treatment M possibly due to the higher pH at 24 h pm (Bidner et al., Reference Bidner, Ellis, Brewer, Campion, Wilson and McKeith2004).
Increased maternal nutrition from 25 to 80 dg (Treatment EM)
Growth rates and carcass composition remain unchanged in Treatment EM offspring compared with control. Although significant differences were observed for pH and lightness at 45 min pm, other meat quality traits such as the ultimate pH, colour at 24 h, drip loss and carcass traits for Treatment EM offspring were unaffected by increased gestational feeding from 25 to 80 dg. This agrees with studies using a similar extended nutritional window (Nissen et al., Reference Nissen, Danielsen, Jorgensen and Oksbjerg2003; Heyer et al., Reference Heyer, Andersson, Lindberg and Lundström2004) in which no difference in meat quality traits were seen between treatments. Increased gene expression of PPAR-δ in deep and superficial ST, and decreased CAST in ST deep region with no observed phenotypic effect in carcass or meat quality when compared with control, indicate that many cellular factors contribute to phenotype expression.
Effect of weight category and gender
In agreement with numerous studies (Wolter et al., Reference Wolter, Ellis, Corrigan and DeDecker2002; Rehfeldt et al., Reference Rehfeldt, Tuchscherer, Hartung and Kuhn2008; Beaulieu et al., Reference Beaulieu, Aalhus, Williams and Patience2010), the pigs maintained their birth weight ranking for postnatal weight and growth throughout life. Some studies have also reported that Light birth weight pigs are associated with fatter carcasses (Bee, Reference Bee2004; Rehfeldt et al., Reference Rehfeldt, Tuchscherer, Hartung and Kuhn2008). However, our study in line with Beaulieu et al. (Reference Beaulieu, Aalhus, Williams and Patience2010) found no differences between littermates for carcass fat and lean. Interestingly, IMF was optimal in Medium weight pigs, whereas Rehfeldt et al. (Reference Rehfeldt, Tuchscherer, Hartung and Kuhn2008) and Beaulieu et al. (Reference Beaulieu, Aalhus, Williams and Patience2010) concluded that IMF was optimal in Light pigs. Differences between studies may owe to variations in study size or weight category cut-offs.
Previous studies have found that lighter littermates benefited most from increased sow gestation feed allowance with improved growth rates and gain-to-feed ratios of progeny (Dwyer et al., Reference Dwyer, Stickland and Fletcher1994; Cerisuelo et al., Reference Cerisuelo, Baucells, Gasa, Coma, Carrion, Chapinal and Sala2009). However, no treatment by birth weight category interaction effects were observed in this study.
Entire males are generally considered to have increased daily gain, better feed conversion and be leaner than female pigs (Campbell et al., Reference Campbell, Johnson, King and Taverner1990; Rikard-Bell et al., Reference Rikard-Bell, Curtis, van Barneveld, Mullan, Edwards, Gannon, Henman, Hughes and Dunshea2009). In our study, similar trends were observed for growth and feed conversion traits. However, we observed that females were leaner than entire males, a trend also reported by previous studies in our research facility (O'Connell et al., Reference O'Connell, Lynch and O'Doherty2006; Conte et al., Reference Conte, Boyle, O'Connell, Lynch and Lawlor2010). The discrepancies observed between studies may be due to the method of lean determination and the distribution of muscle and fat in the pig carcasses (O'Connell et al., Reference O'Connell, Lynch and O'Doherty2006). Indeed, Gispert et al. (Reference Gispert, Àngels Oliver, Velarde, Suarez, Pérez and Font i Furnols2010) and Hallenstvedt et al. (Reference Hallenstvedt, Kjos, Rehnberg, Øverland and Thomassen2010) report no growth and carcass lean differences between entire males and females.
In conclusion, this study suggests that doubling maternal feed intake affects offspring growth, carcass quality and meat quality. Effects were strongest for increased feeding from 25 to 50 dg. Increased maternal feeding from 25 to 80 dg was no different from the standard gestation control diet. Although mid-gestation treatment offspring had leaner carcasses, it seems that increased maternal nutrition does not provide major benefits for pig production. In fact, early- and mid-gestation treatments are deleterious on offspring growth and carcass weight. Gene expression analysis, does however, give an important insight into the molecular pathways involved in phenotypes both for porcine and human prenatal development. In particular, increasing maternal feeding elevated the expression levels of PPP3CA and Type IIa muscle fibres. Certainly, there are limitations with gene expression in which mRNA levels failed to explain phenotypes observed. (e.g. IGF1 gene expression and growth, CS gene expression and oxidative potential). In such cases, protein activity measurements may be more informative. Finally, lighter littermates in this study did not benefit from increased maternal feed intake.
Acknowledgements
The assistance of Mairead Daly, Edward Beatty, Philippa Fealy and Claire Ashton is gratefully acknowledged. We thank the staff of the Pig Development Unit for care and feeding of the animals used in this study. This research was funded by the Teagasc, under the National Development Plan. Louise McNamara was in receipt of a Teagasc Walsh Fellowship funding for the duration of her PhD. We gratefully acknowledge funding from COST925 under the Short Term Scientific Mission (STSM) fund, which enabled Louise McNamara travel to the RVC.