1 Introduction
Our current understanding of wall turbulence is largely rooted in studies of equilibrium boundary layers with two-dimensional (2-D) mean velocity profiles (i.e. contained in a plane). However, non-equilibrium turbulence with mean-flow three-dimensionality is the rule rather than the exception in most geophysical and engineering flows. Prominent examples of the former are flows in complex terrain, tornadoes and river bends, while industrial flows include flow over swept-wing aircrafts and hulls of marine vehicles, around buildings and obstacles, within turbomachines, etc. Despite the ubiquity of such flows, fundamental questions remain unanswered regarding the structural changes of wall turbulence under three-dimensional (3-D) non-equilibrium conditions, challenging our intellectual ability to comprehend and predict wall turbulence in broader scenarios. In the present work, we study the transition of statistically stationary 2-D turbulence to non-stationary 3-D states induced by the sudden application of a spanwise pressure gradient. Our emphasis is on the multiscale structure of wall-bounded turbulence at moderately high Reynolds numbers.
The vast majority of the fundamental studies on wall turbulence have focused on a narrow subset of equilibrium 2-D wall-bounded flows (two-dimensional turbulent boundary layers; 2DTBL) such as turbulent channels (Kim, Moin & Moser Reference Kim, Moin and Moser1987; Lee & Moser Reference Lee and Moser2015), pipes (Wu et al. Reference Wu, Moin, Adrian and Baltzer2015; Pirozzoli et al. Reference Pirozzoli, Modesti, Orlandi and Grasso2018) and flat-plate boundary layers (Spalart Reference Spalart1988; Sillero, Jiménez & Moser Reference Sillero, Jiménez and Moser2013, Reference Sillero, Jiménez and Moser2014; Wu et al. Reference Wu, Moin, Wallace, Skarda, Lozano-Durán and Hickey2017). These studies have unravelled constitutive characteristics of the near-wall turbulence, including its self-sustaining nature (Jiménez & Moin Reference Jiménez and Moin1991; Jiménez & Pinelli Reference Jiménez and Pinelli1999; Panton Reference Panton2001; Flores & Jiménez Reference Flores and Jiménez2010; Hwang & Cossu Reference Hwang and Cossu2011; Hwang Reference Hwang2015; Farrell et al. Reference Farrell, Ioannou, Jiménez, Constantinou, Lozano-Durán and Nikolaidis2016; Farrell, Gayme & Ioannou Reference Farrell, Gayme and Ioannou2017), the coherent structure and geometry of the flow (del Álamo & Jiménez Reference del Álamo and Jiménez2006; Kawahara, Uhlmann & van Veen Reference Kawahara, Uhlmann and van Veen2012; Lozano-Durán, Flores & Jiménez Reference Lozano-Durán, Flores and Jiménez2012; Dong et al. Reference Dong, Lozano-Durán, Sekimoto and Jiménez2017; McKeon Reference McKeon2017), the life cycle of the momentum-carrying eddies (Hwang & Cossu Reference Hwang and Cossu2010; Lozano-Durán & Jiménez Reference Lozano-Durán and Jiménez2014b; Cossu & Hwang Reference Cossu and Hwang2017) and the wall-attached structure of the flow in the logarithmic layer (Marusic et al. Reference Marusic, Monty, Hultmark and Smits2013; Hwang & Bengana Reference Hwang and Bengana2016; Chandran et al. Reference Chandran, Baidya, Monty and Marusic2017; Cheng et al. Reference Cheng, Li, Lozano-Durán and Liu2019; Marusic & Monty Reference Marusic and Monty2019), among others. Unfortunately, theories built upon equilibrium wall turbulence have had limited impact on our ability to predict 3-D boundary layers (three-dimensional turbulent boundary layers; 3DTBL) and to grasp the physics underlying the extensive collection of numerical and experimental observations. This is principally due to the violation of the temporal and/or spatial homogeneity of the flow and the unidirectionality of the mean shear, which are foundational assumptions of 2DTBL absent in 3DTBL. Consequently, the knowledge established largely for equilibrium 2DTBL, such as the law of the wall (Prandtl Reference Prandtl1925; Millikan Reference Millikan, Hartog and Peters1938; Coles & Hirst Reference Coles and Hirst1969), the scaling laws for the velocity and energy spectra (Perry & Abell Reference Perry and Abell1975, Reference Perry and Abell1977; Zagarola & Smits Reference Zagarola and Smits1998; del Álamo et al. Reference del Álamo, Jiménez, Zandonade and Moser2004; Morrison et al. Reference Morrison, McKeon, Jiang and Smits2004; Hoyas & Jiménez Reference Hoyas and Jiménez2006; Klewicki et al. Reference Klewicki, Fife, Wei and McMurtry2007; Marusic et al. Reference Marusic, Monty, Hultmark and Smits2013; Vallikivi, Ganapathisubramani & Smits Reference Vallikivi, Ganapathisubramani and Smits2015; Chandran et al. Reference Chandran, Baidya, Monty and Marusic2017), structural models of the flow (Townsend Reference Townsend1976; Adrian, Meinhart & Tomkins Reference Adrian, Meinhart and Tomkins2000; Meneveau & Marusic Reference Meneveau and Marusic2013; Agostini & Leschziner Reference Agostini and Leschziner2017; Jiménez Reference Jiménez2018; Lozano-Durán & Bae Reference Lozano-Durán and Bae2019; Marusic & Monty Reference Marusic and Monty2019) and reduced-order models (Rowley & Dawson Reference Rowley and Dawson2017; Bose & Park Reference Bose and Park2018; Durbin Reference Durbin2018), cannot be generalised trivially to non-canonical 3DTBL.
Often, 3DTBL are classified according to their state as either in equilibrium or in non-equilibrium. Townsend (Reference Townsend1961) was the first to coin the term ‘equilibrium layer’ to define a portion of the boundary layer in which the rates of production and dissipation of turbulent kinetic energy are equal. De Graaff & Eaton (Reference De Graaff and Eaton2000) suggested a more restrictive definition in which the total shear stress is balanced by the shear stress at the wall. A comprehensive theory of equilibrium and self-similar flow motions in the outer region of turbulent boundary layers can also be found in the works by Castillo & George (Reference Castillo and George2001), Maciel, Rossignol & Lemay (Reference Maciel, Rossignol and Lemay2006) and Maciel et al. (Reference Maciel, Wei, Gungor and Simens2018). Here, we refer to equilibrium flow simply as that in a statistically stationary state. Despite equilibrium 3DTBL, such as the Ekman layer, being of paramount importance (see e.g. Spalart Reference Spalart1989; Coleman, Ferziger & Spalart Reference Coleman, Ferziger and Spalart1990; Littell & Eaton Reference Littell and Eaton1994; Wu & Squires Reference Wu and Squires1997), the subject of the present work is the non-equilibrium response of 3DTBL, which is one of the most challenging cases for the current turbulence theories. In addition to their equilibrium state (or lack thereof), 3DTBL are also classified according to the mechanisms by which the three-dimensionality is incorporated into the flow. In this respect, 3DTBL can be labelled as ‘viscous-induced’ when the three-dimensionality is a direct consequence of the viscous effects propagating from the solid boundaries (e.g. moving walls, accelerating frames of reference, …), or as ‘inviscid-induced’ when the 3-D flow is the result of space-varying body forces or pressure gradients (such as those triggered by the presence of complex geometries or by baroclinic effects in atmospheric flows). These two mechanisms are usually referred to as shear-driven and pressure-driven in the literature, although such a nomenclature may lead to confusion in some situations. Here we are concerned with the first kind, i.e. ‘viscous-induced’ 3DTBL, which are relevant for turbomachinery applications and large-scale wind farms, to mention just two examples, albeit it is worth noting that in many real-life scenarios three-dimensionality is induced by a combination of the two mechanisms.
From the early works by Bradshaw & Terrell (Reference Bradshaw and Terrell1969) and van den Berg & Elsenaar (Reference van den Berg and Elsenaar1972), it was readily noted that 3DTBL exhibit a response contrary to the common expectations from their 2-D counterparts. Such counter-intuitive effects manifest themselves in the reduction of the tangential Reynolds stress and the misalignment of the Reynolds stress and mean shear ‘vectors’. These observations have been reported for both equilibrium and non-equilibrium 3DTBL, albeit the effects are exacerbated in the latter. The pioneering studies on 3DTBL were laboratory experiments. Bradshaw & Terrell (Reference Bradshaw and Terrell1969) presented the first set of Reynolds stress measurements in a yawed flat plate as a surrogate of an ‘infinite’ swept wing. They observed a lag between the Reynolds stress angle and the mean velocity gradient angle despite the mild three-dimensionality of the flow. Subsequent experiments by Johnston (Reference Johnston1970), van den Berg et al. (Reference van den Berg, Elsenaar, Lindhout and Wesseling1975) and Bradshaw & Pontikos (Reference Bradshaw and Pontikos1985) confirmed the aforementioned behaviour in similar set-ups. In a succeeding series of studies, van den Berg & Elsenaar (Reference van den Berg and Elsenaar1972), Elsenaar & Boelsma (Reference Elsenaar and Boelsma1974) and van den Berg et al. (Reference van den Berg, Elsenaar, Lindhout and Wesseling1975) further showed that the intensity of the Reynolds stress for a given amount of turbulent kinetic energy (also known as Townsend’s structure parameter) dropped below the commonly reported value in 2-D flows, establishing the second main counter-intuitive effect of 3DTBL.
Over the past decades, a variety of additional experimental studies on 3DTBL have been performed, each characterised by the different mechanism utilised to induce three-dimensionality in the flow. Among them, we can highlight 3DTBL over wedges (Anderson & Eaton Reference Anderson and Eaton1987, Reference Anderson and Eaton1989; Compton & Eaton Reference Compton and Eaton1997), rotating cylinders (Furuya & Fujita Reference Furuya and Fujita1966; Bissonnette & Mellor Reference Bissonnette and Mellor1974; Lohmann Reference Lohmann1976; Driver & Hebbar Reference Driver and Hebbar1987, Reference Driver and Hebbar1989, Reference Driver and Hebbar1991), rotating disks (Littell & Eaton Reference Littell and Eaton1994), flow within the bend of ducts (Flack Reference Flack1993; Schwarz & Bradshaw Reference Schwarz and Bradshaw1993, Reference Schwarz and Bradshaw1994; Flack & Johnston Reference Flack and Johnston1994), swept steps and bumps (Flack Reference Flack1993; Webster, De Graaff & Eaton Reference Webster, De Graaff and Eaton1996) and wing–body junctions (Ölçmen & Simpson Reference Ölçmen and Simpson1992, Reference Ölçmen and Simpson1995). More recently, Kiesow & Plesniak (Reference Kiesow and Plesniak2002, Reference Kiesow and Plesniak2003) used particle image velocimetry (PIV) to acquire detailed information of the flow structure at varying degrees of cross-flow generated by moving belts. The large body of literature on experimental 3DTBL until the 1990s is summarised in the reviews by Fernholz & Vagt (Reference Fernholz and Vagt1981), van den Berg et al. (Reference van den Berg, Lindhout, Humphreys and Krause1988), Eaton (Reference Eaton1995) and Johnston & Flack (Reference Johnston and Flack1996).
The advent of direct numerical simulation (DNS) and large-eddy simulation (LES) led to an increase in the number of numerical investigations of 3DTBL. Computational studies carried out to date include channel flows subject to transverse pressure gradients (Moin et al. Reference Moin, Shih, Driver and Mansour1990; Sendstad Reference Sendstad1992; Coleman, Kim & Le Reference Coleman, Kim and Le1996a; He et al. Reference He, Lozano-Durán, He and Cho2018), flat plates with time-dependent free-stream velocity (Spalart Reference Spalart1989), rotating disks (Littell & Eaton Reference Littell and Eaton1994; Wu & Squires Reference Wu and Squires2000), Couette flows with spanwise pressure gradient (Holstad, Andersson & Pettersen Reference Holstad, Andersson and Pettersen2010) and concentric annulus with rotating inner wall (Jung & Sung Reference Jung and Sung2006), among others. Coleman et al. (Reference Coleman, Kim and Le1996a) and Coleman, Kim & Spalart (Reference Coleman, Kim and Spalart1996b, Reference Coleman, Kim and Spalart2000) computed DNS of initially 2-D fully developed turbulence subjected to mean strains, emulating the effect of spatially varying changes of the pressure gradients in ducts or diffusers. Wu & Squires (Reference Wu and Squires1997, Reference Wu and Squires1998) performed LES of the swept bump proposed experimentally by Webster et al. (Reference Webster, De Graaff and Eaton1996), while other numerical investigations have introduced three-dimensionality in flow by the impulsive motion of walls in the spanwise direction (Howard & Sandham Reference Howard and Sandham1997; Le Reference Le1999; Le, Coleman & Kim Reference Le, Coleman and Kim1999), by spanwise oscillating walls (Jung, Mangiavacchi & Akhavan Reference Jung, Mangiavacchi and Akhavan1992) and by a sustained lateral displacement of a finite section of the wall (Kannepalli & Piomelli Reference Kannepalli and Piomelli2000).
The current consensus among the experimental and numerical studies above is that three-dimensionality of the mean flow is typically accompanied by a decrease of the tangential Reynolds stress, the reduction of drag, and the misalignment of the mean Reynolds stress vector and mean shear vector. Given that equilibrium 2-D turbulence is commonly enhanced by the addition of mean shear, the previous results are non-trivial to interpret. Accordingly, there have been multiple attempts to reconcile the non-intuitive flow response with the traditional structural organisation of near-wall turbulence (Jiménez & Moin Reference Jiménez and Moin1991; Jiménez & Pinelli Reference Jiménez and Pinelli1999; Schoppa & Hussain Reference Schoppa and Hussain2002). Most structural studies of 3DTBL depart from the premise that 2DTBL are structurally ‘optimal’ for the generation of Reynolds stress, and that 3DTBL are essentially a distorted, less efficient version of the former. Lohmann (Reference Lohmann1976) postulated one of the first structural pictures of the flow by suggesting that transverse shear was responsible for the breakup of quasi-streamwise vortices into smaller structures. Bradshaw & Pontikos (Reference Bradshaw and Pontikos1985) further hypothesised that eddies were tilted away from their preferred alignment by the spanwise strain, which impeded the production of Reynolds stress. Eaton (Reference Eaton1991) stated that low-speed streaks are inhibited by the mean cross-flow, which reduces the number of ejections (and hence Reynolds stress) generated via streak instability and breakdown. Kannepalli & Piomelli (Reference Kannepalli and Piomelli2000) also observed significant disruption of the near-wall streaks at both the leading and trailing edge of the moving wall section as the flow adjusts to the new wall boundary conditions. Later PIV measurements by Kiesow & Plesniak (Reference Kiesow and Plesniak2002) confirmed a significant alteration of the near-wall flow physics, with significant disruption of the streak length compared to 2DTBL. On the other hand, the works by Anderson & Eaton (Reference Anderson and Eaton1989), Sendstad (Reference Sendstad1992), Littell & Eaton (Reference Littell and Eaton1994), Eaton (Reference Eaton1995) and Chiang & Eaton (Reference Chiang and Eaton1996) have centred attention on the strong asymmetry between vortices of different sign rather than on streaks as the main cause for stress reduction. They argued that the intrinsic structure of 3DTBL favour either a sweep or an ejection, which reduces the efficiency of the boundary layer to produce Reynolds stress. The LES by Wu & Squires (Reference Wu and Squires1997) supported the structural model proposed by Littell & Eaton (Reference Littell and Eaton1994). However, Jung & Sung (Reference Jung and Sung2006) rendered the latter scenario invalid in a concentric annulus by analysing the distinctive flow features using conditional analysis.
Previous numerical studies on 3DTBL focused on relatively low Reynolds numbers in which half or a larger portion of the boundary layer is dominated by viscous effects. Experimental studies are capable of attaining higher Reynolds numbers, but the current measurement techniques have limitations in accessing the near-wall region and generating fully resolved datasets in space and time. To date, it is unclear whether distinctly different mechanisms are at work at Reynolds numbers in which the inviscid core region occupies more than 80 % of the boundary layer thickness. Moreover, important questions remain unanswered at high Reynolds numbers, such as the scaling properties of the Reynolds stress reduction under 3-D non-equilibrium effects, the structural modifications in the flow responsible for these changes, and the formulation of a structural model consistent with the previous observations which accounts for the multiscale nature of turbulence. Therefore, the rich information provided by high-fidelity simulations at higher Reynolds numbers is needed for a detailed understanding of 3DTBL present in most real-world applications. In the present work, we address these questions and show that our higher Reynolds numbers, even if moderate, allow us to unravel the scaling laws and multiscale structural changes in the flow previously obscured by the lack of scale separation.
Finally, it is worth mentioning that the peculiarities of 3DTBL are expected to undermine the performance of modelling techniques built on and validated for 2DTBL. Especially concerning is the development and testing of wall models for LES, motivated by the need to bypass the inner wall region in order to reduce computational costs (Chapman Reference Chapman1979; Choi & Moin Reference Choi and Moin2012). Early wall models relying on equilibrium assumptions have yielded fair predictions in simple flows, but are known to be suboptimal in more complex configurations (Larsson et al. Reference Larsson, Kawai, Bodart and Bermejo-Moreno2016). This has motivated recent efforts to develop new wall models accounting for non-equilibrium effects (Balaras, Benocci & Piomelli Reference Balaras, Benocci and Piomelli1996; Wang & Moin Reference Wang and Moin2002; Park & Moin Reference Park and Moin2014; Yang et al. Reference Yang, Sadique, Mittal and Meneveau2015), free of tunable parameters (Bose & Moin Reference Bose and Moin2014; Lozano-Durán et al. Reference Lozano-Durán, Bae, Bose and Moin2017; Bae et al. Reference Bae, Lozano-Durán, Bose and Moin2018a) and capable of delivering robust predictions for non-canonical flow settings (see for instance the recent review by Bose & Park (Reference Bose and Park2018)). Note that, in general, wall models are not effective at transferring information of the flow structure from the inner to the outer layer (Piomelli & Balaras Reference Piomelli and Balaras2002). Hence, the current flow set-up characterised by a spanwise boundary layer growing from the wall is a challenging testbed for wall-modelled large-eddy simulation (WMLES).
The primary foci of this work are the investigation of the scaling properties of 3DTBL, absent in previous numerical studies at low Reynolds numbers, and the elucidation of the structural mechanisms responsible for Reynolds stress deficit during the initial transient. The insight gained is used to envision a multiscale structural model consistent with the scalings and structural changes observed. We also inspect the implications of three-dimensionality and non-equilibrium state for WMLES. A preliminary version of this work can be found in Giometto et al. (Reference Giometto, Lozano-Durán, Park and Moin2017). The current paper is organised as follows. The numerical set-up and database are presented in § 2. The analysis of the scaling and flow structure of the flow is discussed in § 3. In § 4, we focus on the comparison of selected quantities for DNS and WMLES. Finally, conclusions are offered in § 5.
2 Problem set-up and numerical database
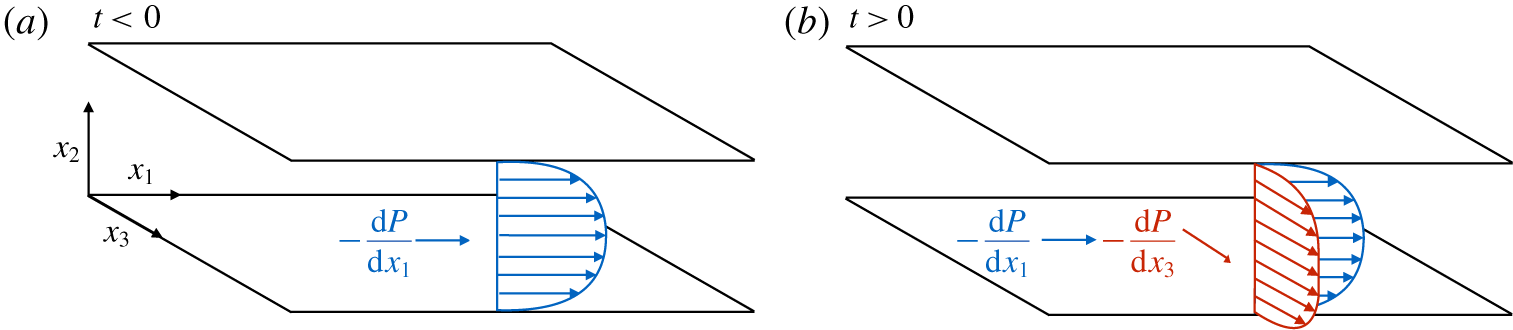
We perform a series of DNS of incompressible turbulent channel flow subjected to a sudden imposition of a transverse pressure gradient (Moin et al. Reference Moin, Shih, Driver and Mansour1990). The problem set-up is sketched in figure 1. This flow configuration, despite its simplicity, has proven successful in capturing the essential features of non-equilibrium 3DTBL. The calculation is initialised with a 2-D fully developed equilibrium channel flow. At  $t=0$, a mean spanwise pressure gradient is applied, inducing a sudden acceleration of the flow in the spanwise direction. During this process, the channel flow is driven in the streamwise direction by the usual mean streamwise pressure gradient. The current set-up is formally equivalent to the sudden application of an in-plane spanwise acceleration to the walls in the opposite direction (Panton Reference Panton1984, p. 253). Our focus is on the initial transient succeeding the application of the transverse pressure gradient.
Schematic of the numerical set-up of a 2-D fully developed turbulent channel flow subjected to a sudden transverse pressure gradient at  $t=0$. The profiles in blue and red represent the streamwise and spanwise mean velocity profiles, respectively. The channel flow is driven by a streamwise
 $\text{d}P/\text{d}x_{1}$ and spanwise
 $\text{d}P/\text{d}x_{3}$ mean pressure gradient applied in the streamwise and spanwise direction, respectively.

Two Reynolds numbers are considered, namely  $Re_{\unicode[STIX]{x1D70F}}=hu_{\unicode[STIX]{x1D70F}}/\unicode[STIX]{x1D708}\approx 500$ and
 $Re_{\unicode[STIX]{x1D70F}}\approx 1000$, both defined at
 $t=0$, where
 $h$ is the channel half-height,
 $u_{\unicode[STIX]{x1D70F}}$ is the friction velocity at
 $t=0$ and
 $\unicode[STIX]{x1D708}$ is the kinematic viscosity. The density of the fluid is
 $\unicode[STIX]{x1D70C}$. The streamwise, wall-normal and spanwise directions are represented by
 $x_{1}$,
 $x_{2}$ and
 $x_{3}$, respectively, and the corresponding velocities are
 $u_{1}$,
 $u_{2}$ and
 $u_{3}$. The pressure is denoted by
 $p$. The size of the computational domain is
 $L_{1}\times L_{2}\times L_{3}=4\unicode[STIX]{x03C0}h\times 2h\times 2\unicode[STIX]{x03C0}h$ for cases at
 $Re_{\unicode[STIX]{x1D70F}}\approx 500$, and
 $8\unicode[STIX]{x03C0}h\times 2h\times 3\unicode[STIX]{x03C0}h$ for cases at
 $Re_{\unicode[STIX]{x1D70F}}\approx 1000$. According to a previous study (Lozano-Durán & Jiménez Reference Lozano-Durán and Jiménez2014a), these domain sizes should suffice to accommodate the largest structures populating the region
 $x_{2}<0.4h$ (Marusic et al. Reference Marusic, Monty, Hultmark and Smits2013), which is the main focus of this study. Wall (or inner) units,
 $(\cdot )^{+}$, are obtained by normalising flow quantities by
 $u_{\unicode[STIX]{x1D70F}}$ and
 $\unicode[STIX]{x1D708}$, and outer units,
 $(\cdot )^{\ast }$, are defined in terms of
 $u_{\unicode[STIX]{x1D70F}}$ and
 $h$. Note that
 $(\cdot )^{+}$ and
 $(\cdot )^{\ast }$ are referred to
 $t=0$. The streamwise and spanwise mean pressure gradients are
 $\text{d}P/\text{d}x_{1}=\unicode[STIX]{x1D70C}u_{\unicode[STIX]{x1D70F}}^{2}/h$ and
 $\text{d}P/\text{d}x_{3}$, respectively. A campaign of simulations at different
 $Re_{\unicode[STIX]{x1D70F}}$ and multiple spanwise mean pressure gradients are performed with spanwise-to-streamwise mean pressure gradient ratios ranging from
 $\unicode[STIX]{x1D6F1}=(\text{d}P/\text{d}x_{3})/(\text{d}P/\text{d}x_{1})=1$ to 100. Several runs (
 $N_{R}$) are considered for each
 $Re_{\unicode[STIX]{x1D70F}}$ and
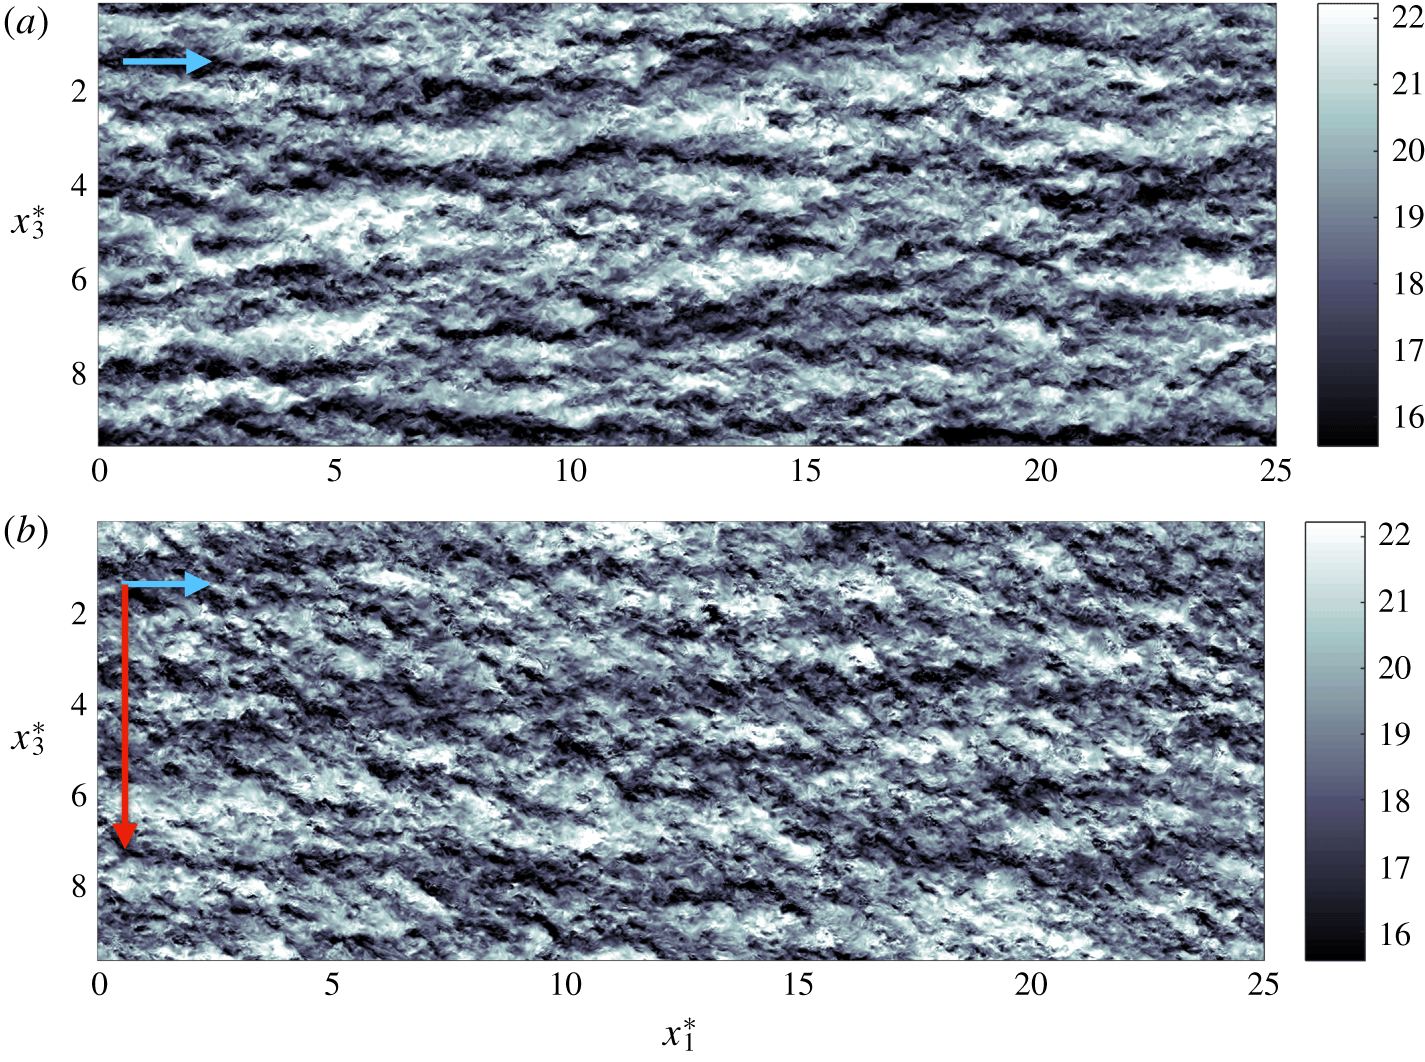
 $\unicode[STIX]{x1D6F1}$ by initialising the simulations with various temporally uncorrelated 2-D equilibrium turbulent channel flows. The set of simulations is summarised in table 1. Examples of the instantaneous streamwise velocity at two time instants are shown in figure 2 for
 $\unicode[STIX]{x1D6F1}=60$ at
 $Re_{\unicode[STIX]{x1D70F}}\approx 1000$.
Instantaneous  $x_{1}$–
 $x_{3}$ planes of the streamwise velocity at
 $x_{2}^{\ast }=0.25$ for (a)
 $t^{\ast }=0$ and (b)
 $t^{\ast }=0.6$. The data are for
 $\unicode[STIX]{x1D6F1}=60$ at
 $Re_{\unicode[STIX]{x1D70F}}\approx 1000$. The colour bars show the magnitude of the streamwise velocity normalised in wall units. The arrows represent the direction of
 $\text{d}P/\text{d}x_{1}$ in blue and
 $\text{d}P/\text{d}x_{3}$ in red, but note that lengths of the arrows are not to scale.

Geometry and parameters of the DNS runs:  $Re_{\unicode[STIX]{x1D70F}}$ is the friction Reynolds number;
 $L_{1}^{\ast }=L_{1}/h$ and
 $L_{3}^{\ast }=L_{3}/h$ are the streamwise and spanwise dimensions of the numerical box, respectively, with
 $h$ the channel half-height;
 $\unicode[STIX]{x1D6E5}_{1}^{+}$ and
 $\unicode[STIX]{x1D6E5}_{3}^{+}$ are the spatial grid resolutions in wall units for the streamwise and spanwise direction, respectively;
 $\unicode[STIX]{x1D6E5}_{2,min}^{+}$ and
 $\unicode[STIX]{x1D6E5}_{2,max}^{+}$ are the finer (closer to the wall) and coarser (further from the wall) grid resolutions in the wall-normal direction in wall units; and
 $N_{2}$ is the number of wall-normal grid points. The simulations are integrated for a time
 $T^{\ast }$ equal to one eddy turnover time defined as
 $T^{\ast }=Tu_{\unicode[STIX]{x1D70F}}/h=1$, where
 $u_{\unicode[STIX]{x1D70F}}$ is the friction velocity at
 $t=0$. Finally,
 $\unicode[STIX]{x1D6F1}=(\text{d}P/\text{d}x_{3})/(\text{d}P/\text{d}x_{1})$ is the spanwise-to-streamwise mean pressure gradient ratio driving the channel flow; and
 $N_{R}$ is the total number of runs performed per each case given by the pair (
 $Re_{\unicode[STIX]{x1D70F}},\unicode[STIX]{x1D6F1}$).

The simulations are performed by discretising the incompressible Navier–Stokes equations with a staggered second-order-accurate centred finite difference method (Orlandi Reference Orlandi2000) in space, and an explicit third-order-accurate Runge–Kutta method (Wray Reference Wray1990) for time advancement. The system of equations is solved via an operator splitting approach (Chorin Reference Chorin1968). Periodic boundary conditions are imposed in the streamwise and spanwise directions, and the no-slip condition is applied at the walls. The code has been validated in turbulent channel flows (Lozano-Durán & Bae Reference Lozano-Durán and Bae2016; Bae et al. Reference Bae, Lozano-Durán, Bose and Moin2018b) and flat-plate boundary layers (Lozano-Durán, Hack & Moin Reference Lozano-Durán, Hack and Moin2018). The validation for channel flows under the sudden imposition of a lateral mean pressure gradient is presented in appendix A. The streamwise and spanwise grid resolutions are uniform and denoted by  $\unicode[STIX]{x1D6E5}_{1}$ and
 $\unicode[STIX]{x1D6E5}_{3}$, respectively. The wall-normal grid resolution,
 $\unicode[STIX]{x1D6E5}_{2}$, is stretched in the wall-normal direction following a hyperbolic tangent. The time step is such that the Courant–Friedrichs–Lewy condition is always below 0.5 during the run. Details on the parameters of the numerical set-up are included in table 1. The sensitivity of the results to the grid resolution and size of the computational domain are discussed in appendix B.
3 Analysis of non-equilibrium 3DTBL
The present section is devoted, first, to the identification of universal scaling laws for the tangential Reynolds stress in the 3-D transient channel flow described in § 2, and, second, to the scrutiny of the structural and energetic alterations of the flow during the transient. A large number of studies have been dedicated to the scaling of quantities of interest in fully developed 2DTBL (see e.g. Millikan Reference Millikan, Hartog and Peters1938; Klewicki et al. Reference Klewicki, Fife, Wei and McMurtry2007; Monkewitz, Chauhan & Nagib Reference Monkewitz, Chauhan and Nagib2008). Recent efforts have been facilitated by the increased availability of numerical data at high Reynolds numbers with an appreciable scale separation between the inner and outer layers. In contrast, advances in non-equilibrium 3DTBL have been hindered by the lack of high-Reynolds-number flow datasets. Similar limitations apply to the analysis of structural changes on the flow.
The next subsection offers an overview of the evolution of the one-point statistics during the transient period, followed in § 3.2 by a discussion on the role of the no-slip wall. Then, in § 3.3 we classify the flow regimes and analyse the scaling laws concerning the history of the tangential Reynolds stress. The time-dependent 3-D structural changes undergone by the flow are discussed in § 3.4, and in the last subsection (§ 3.5) we propose a structural model consistent with our observations.
3.1 Overview of one-point statistics
We select the channel flow at  $Re_{\unicode[STIX]{x1D70F}}\approx 500$ with
 $\unicode[STIX]{x1D6F1}=60$ as a representative case to illustrate the non-equilibrium response of the flow succeeding the imposition of the lateral pressure gradient. The systematic analysis for various
 $Re_{\unicode[STIX]{x1D70F}}$ and
 $\unicode[STIX]{x1D6F1}$ is presented in § 3.2. For
 $t\rightarrow \infty$, the system attains a new statistically steady state corresponding to a 2-D channel flow at higher
 $Re_{\unicode[STIX]{x1D70F}}$ and mean-flow direction parallel to the vector
 $(\text{d}P/\text{d}x_{1},0,\text{d}P/\text{d}x_{3})$. We focus on the initial transient dominated by 3-D non-equilibrium effects for
 $t^{\ast }<1$. The statistical quantities of interest are computed by averaging the flow in the homogeneous directions, over the top and bottom halves of the channel, and among different runs. The averaging operator is hereafter denoted by
 $\langle \cdot \rangle$, and velocity fluctuations are signified by
 $(\cdot )^{\prime }$. Fluctuating velocities are measured with respect to the time-evolving mean velocity profiles in the streamwise and spanwise direction,
 $\langle u_{1}\rangle (x_{2},t)$ and
 $\langle u_{3}\rangle (x_{2},t)$, respectively.
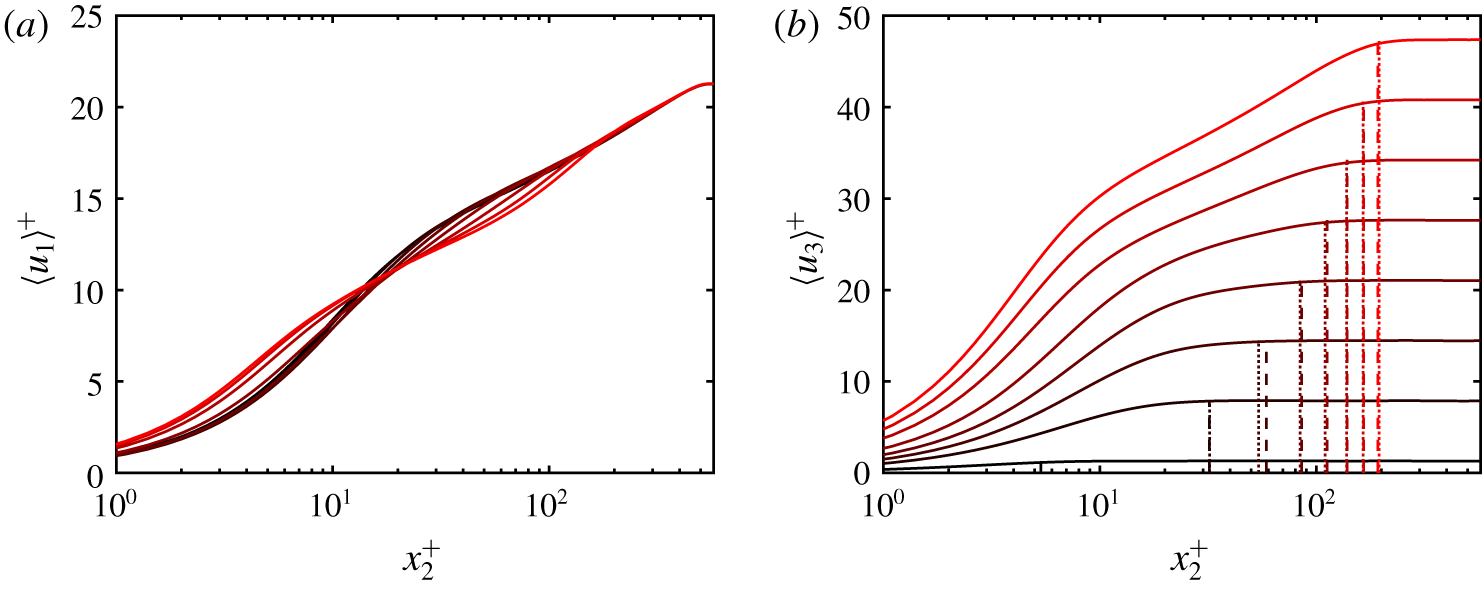
The mean velocity profiles are shown in figure 3 at several times. The streamwise mean velocity undergoes mild changes in shape (figure 3a), and the main outcome of the lateral pressure gradient is the development of a spanwise boundary layer of thickness  $\unicode[STIX]{x1D6FF}_{3}$ (figure 3b). The growth of
 $\unicode[STIX]{x1D6FF}_{3}$ is initially governed by viscous diffusion, i.e.
 $\unicode[STIX]{x1D6FF}_{3}\sim \sqrt{\unicode[STIX]{x1D708}t}$ for
 $t<t_{\unicode[STIX]{x1D708}}$. A rough estimation of
 $t_{\unicode[STIX]{x1D708}}$ is given by
 $t_{\unicode[STIX]{x1D708}}^{+}\approx 70$ (Moin et al. Reference Moin, Shih, Driver and Mansour1990), such that the initial viscous growth period becomes a smaller fraction of
 $T$ as
 $Re_{\unicode[STIX]{x1D70F}}$ increases. For
 $t>t_{\unicode[STIX]{x1D708}}$, turbulent diffusion prevails and
 $\unicode[STIX]{x1D6FF}_{3}\sim \sqrt{\unicode[STIX]{x1D708}_{e}t}$, where
 $\unicode[STIX]{x1D708}_{e}$ is the turbulent eddy viscosity. Assuming the mixing-length hypothesis,
 $\unicode[STIX]{x1D708}_{e}\sim u_{\unicode[STIX]{x1D70F}}\unicode[STIX]{x1D6FF}_{3}$, then
 $\unicode[STIX]{x1D6FF}_{3}\sim u_{\unicode[STIX]{x1D70F}}t$, i.e. the spanwise boundary layer grows linearly in time regardless of
 $\text{d}P/\text{d}x_{3}$ in first-order approximation. The agreement of the approximation
 $\unicode[STIX]{x1D6FF}_{3}^{+}\approx 0.445t^{+}$, included in figure 3(b), with
 $\unicode[STIX]{x1D6FF}_{3}$ highlights the validity of the previous assumptions after the initial viscous phase. The inertial core of the channel,
 $\langle \cdot \rangle _{\infty }$, is accelerated by the mean spanwise pressure gradient such that
 $\unicode[STIX]{x1D70C}\langle u_{3}\rangle _{\infty }\approx (\text{d}P/\text{d}x_{3})t$, which controls the additional spanwise shear,
 $\unicode[STIX]{x2202}\langle u_{3}\rangle /\unicode[STIX]{x2202}x_{2}\sim \langle u_{3}\rangle _{\infty }/\unicode[STIX]{x1D6FF}_{3}\sim (\text{d}P/\text{d}x_{3})/(\unicode[STIX]{x1D70C}u_{\unicode[STIX]{x1D70F}})$. In summary, the sudden imposition of
 $\text{d}P/\text{d}x_{3}$ results in the emergence of a spanwise boundary layer diffusing upwards from the wall linearly in time,
 $\unicode[STIX]{x1D6FF}_{3}\sim u_{\unicode[STIX]{x1D70F}}t$, accompanied by an additional mean shear proportional to
 $\text{d}P/\text{d}x_{3}$.
Mean velocity profile in (a) the streamwise direction and (b) the spanwise direction for  $t^{+}=12$, 72, 132, 192, 252, 312, 372 and 432. Colours indicate time from
 $t^{+}=0$ (black) to
 $t^{+}=432$ (red). The vertical dotted lines are the boundary layer thickness
 $\unicode[STIX]{x1D6FF}_{3}$ defined by the wall-normal distance at which
 $\langle u_{3}\rangle =0.99\langle u_{3}\rangle _{\infty }=0.99\langle u_{3}\rangle (h,t)$, and the vertical dashed lines are the estimated boundary layer thickness given by
 $\unicode[STIX]{x1D6FF}_{3}^{+}=0.445t^{+}$.

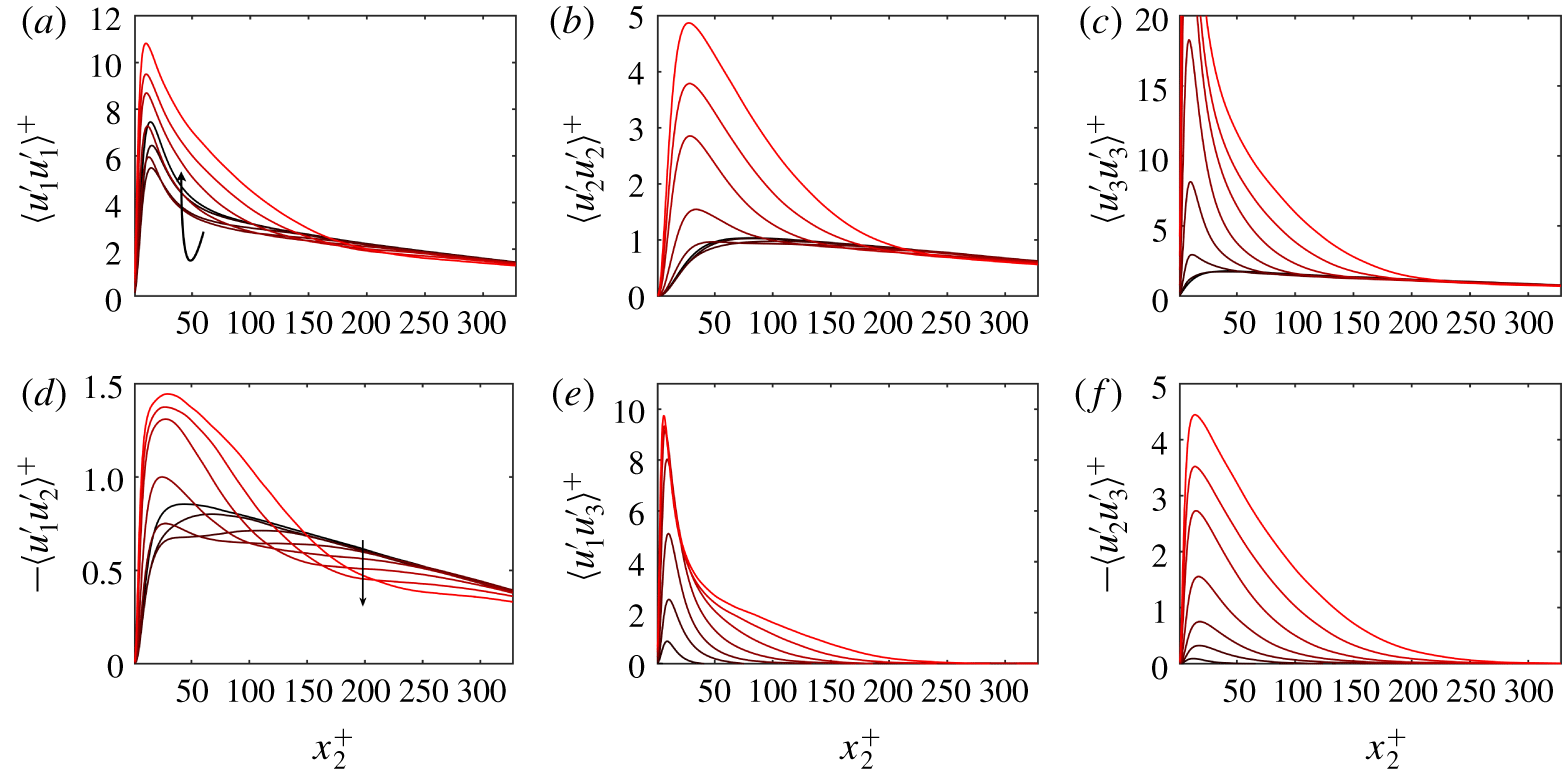
Mean Reynolds stress for  $\unicode[STIX]{x1D6F1}=60$ at
 $Re_{\unicode[STIX]{x1D70F}}\approx 500$. Different lines correspond to different times
 $t^{+}=12$, 72, 132, 192, 252, 312, 372 and 432. Colours indicate time from
 $t^{+}=0$ (black) to
 $t^{+}=432$ (red). The arrows indicate the direction of time.

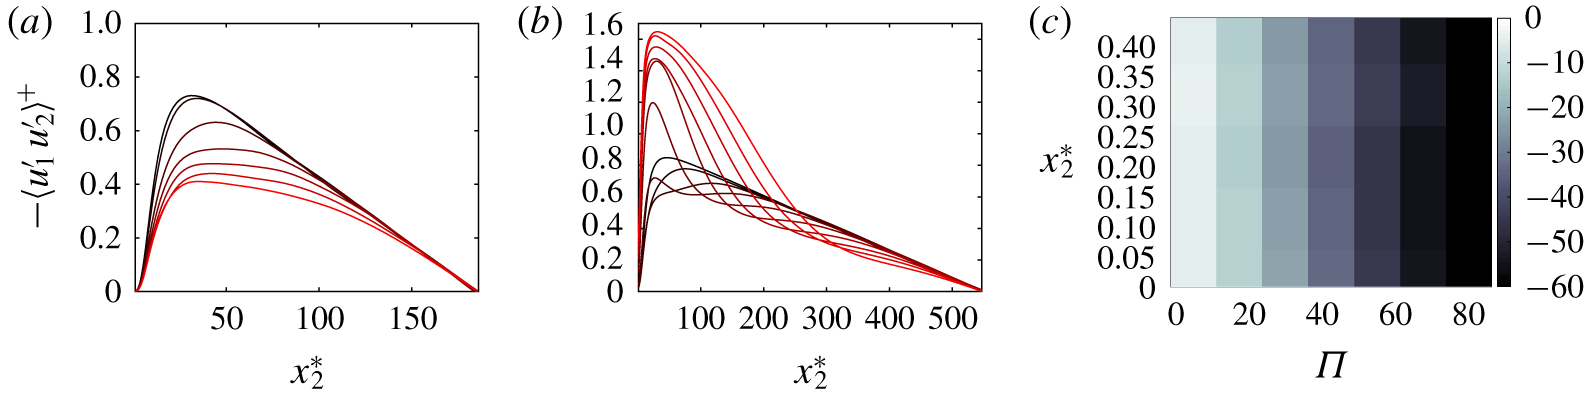
The evolution of the mean Reynolds stresses is shown in figure 4. Considering that the flow is subjected to the additional strain  $\unicode[STIX]{x2202}\langle u_{3}\rangle /\unicode[STIX]{x2202}x_{2}$, the classic theory anticipates an increase of the Reynolds stresses under the equilibrium assumption
 $-\langle u_{i}^{\prime }u_{j}^{\prime }\rangle +(1/3)\langle u_{k}^{\prime }u_{k}^{\prime }\rangle \unicode[STIX]{x1D6FF}_{ij}\propto \unicode[STIX]{x1D708}_{e}\langle \unicode[STIX]{x1D64E}_{ij}\rangle$, where
 $\unicode[STIX]{x1D64E}_{ij}$ is the rate-of-strain tensor and
 $\unicode[STIX]{x1D6FF}_{ij}$ is the Kronecker delta. Figure 4 shows that the behaviour of
 $\langle u_{i}^{\prime }u_{j}^{\prime }\rangle$ is consistent with the equilibrium prediction for large times. However, during the first stages of the transient,
 $\langle u_{1}^{\prime }u_{1}^{\prime }\rangle$ and
 $-\langle u_{1}^{\prime }u_{2}^{\prime }\rangle$ experience a vigorous depletion, whereas
 $\langle u_{2}^{\prime }u_{2}^{\prime }\rangle$ and
 $\langle u_{3}^{\prime }u_{3}^{\prime }\rangle$ remain roughly constant. Thus, the initial transient exhibits a counter-intuitive behaviour of Reynolds stresses, inconsistent with the equilibrium assumption. The reduction in magnitude of those stresses comprising
 $u_{1}^{\prime }$ hints at a deficiency in the streak generation cycle triggered during the transient; the structural origin of such a deficiency is discussed in § 3.4. A similar equilibrium argument applies to the angle of Reynolds stress direction,
 $\unicode[STIX]{x1D6FE}_{\unicode[STIX]{x1D70F}}=\text{atan}[\langle u_{2}^{\prime }u_{3}^{\prime }\rangle /\langle u_{1}^{\prime }u_{2}^{\prime }\rangle ]$, and mean shear direction,
 $\unicode[STIX]{x1D6FE}_{S}=\text{atan}[(\unicode[STIX]{x2202}\langle u_{3}\rangle /\unicode[STIX]{x2202}x_{2})/(\unicode[STIX]{x2202}\langle u_{1}\rangle /\unicode[STIX]{x2202}x_{2})]$, which are expected to satisfy
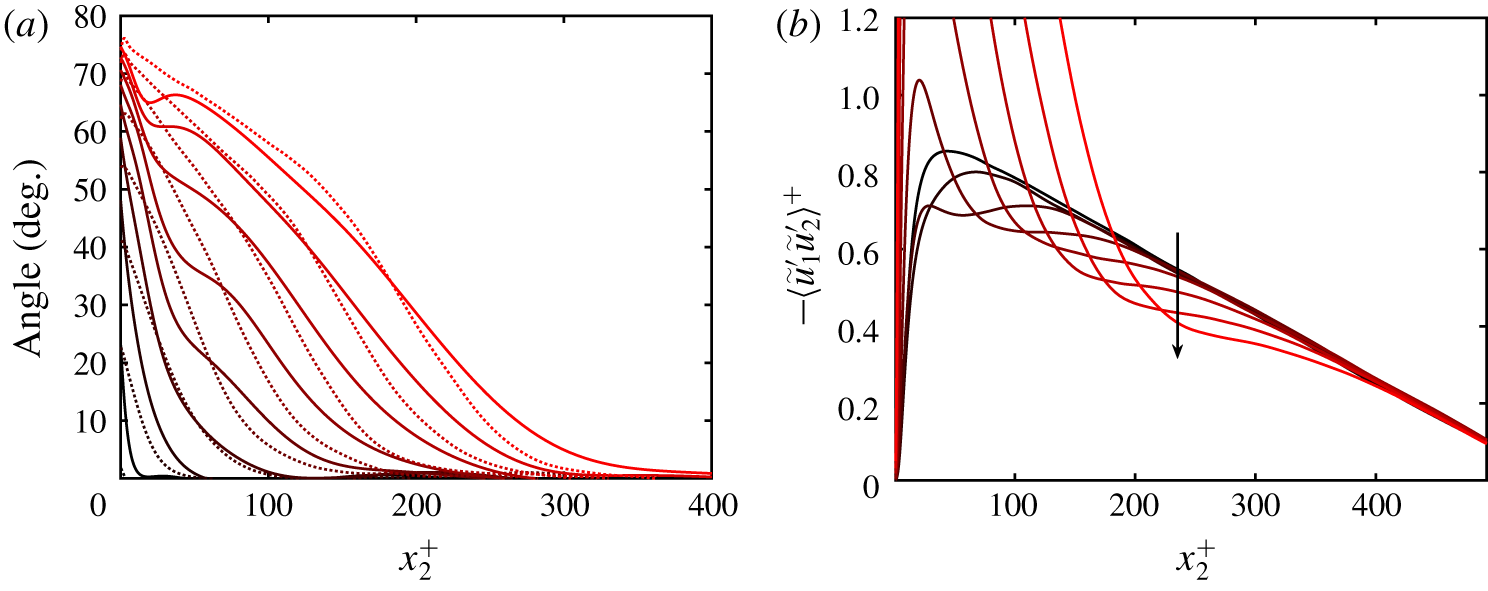
 $\unicode[STIX]{x1D6FE}_{\unicode[STIX]{x1D70F}}\approx \unicode[STIX]{x1D6FE}_{S}$ in an equilibrium 2DTBL. As seen from figure 5(a), the equilibrium condition is not met for the angles; the Reynolds stress direction lags behind the mean direction closer to the wall and leads further away. We will focus most of our attention on the tangential Reynolds stress,
 $-\langle u_{1}^{\prime }u_{2}^{\prime }\rangle$, because the initial non-equilibrium response is most vividly manifested on that component, although other coordinate-dependent metrics can be defined to measure non-equilibrium effects. In particular, it was assessed that the conclusions drawn below are also valid when non-equilibrium effects are quantified in terms of the classic Townsend (Reference Townsend1976) structure parameter as shown in appendix C.
It could be argued that the drop in  $-\langle u_{1}^{\prime }u_{2}^{\prime }\rangle$ in figure 4(d) is an artefact of the static frame of reference
 ${\mathcal{F}}:(x_{1},x_{2},x_{3})$. The direction given by
 ${\mathcal{F}}$ is no longer coplanar with the mean shear vector, which is the primal source responsible for the injection of kinetic energy into the turbulence intensities. To show that the depletion of
 $-\langle u_{1}^{\prime }u_{2}^{\prime }\rangle$ is not the consequence of observing the flow from the point of view of
 ${\mathcal{F}}$, we define the wall-normal and time-dependent frame of reference
 $\tilde{{\mathcal{F}}}:(\tilde{x}_{1},x_{2},\tilde{x}_{3})$ such that
 $\tilde{x}_{1}$ points in the direction of the local mean shear vector
 $(\unicode[STIX]{x2202}\langle u_{1}\rangle /\unicode[STIX]{x2202}x_{2},0,\unicode[STIX]{x2202}\langle u_{3}\rangle /\unicode[STIX]{x2202}x_{2})$ at each wall-normal location and time instant. The angle between
 $\tilde{x}_{1}$ and
 $x_{1}$ is given by
 $\unicode[STIX]{x1D6FE}_{S}$ (figure 5a). The velocity components in the frame of reference
 $\tilde{{\mathcal{F}}}$ are denoted by
 $\tilde{u} _{1}$,
 $\tilde{u} _{2}~(\equiv u_{2})$ and
 $\tilde{u} _{3}$. Figure 5(b) demonstrates that the shear-aligned tangential Reynolds stress,
 $-\langle \tilde{u} _{1}^{\prime }\tilde{u} _{2}^{\prime }\rangle$, also experiences a strong reduction in magnitude. An alternative frame of reference is that aligned with the principal Reynolds stress direction defined by the angle
 $\unicode[STIX]{x1D6FE}_{\unicode[STIX]{x1D70F}}$ (Moin et al. Reference Moin, Squires, Cabot and Lee1991). The difference between
 $\unicode[STIX]{x1D6FE}_{S}$ and
 $\unicode[STIX]{x1D6FE}_{\unicode[STIX]{x1D70F}}$ is small (figure 5a), and the history of the Reynolds stresses in the frame of reference of the principal Reynolds stress direction (not shown) is similar to the results from figure 5(b).
(a) Angle of the mean Reynolds stress direction  $\unicode[STIX]{x1D6FE}_{\unicode[STIX]{x1D70F}}$ (solid) and mean shear direction
 $\unicode[STIX]{x1D6FE}_{S}$ (dotted) with respect to
 $x_{1}$. (b) Mean tangential Reynolds stress in the wall-normal and time-dependent frame of reference
 $\tilde{{\mathcal{F}}}$ aligned with the mean shear direction
 $\unicode[STIX]{x1D6FE}_{S}$. The arrow in panel (b) indicates the direction of time. Different lines correspond to different times
 $t^{+}=12$, 72, 132, 192, 252, 312, 372 and 432. In both panels, the colours denote time from
 $t^{+}=0$ (black) to
 $t^{+}=432$ (red). The data are for
 $\unicode[STIX]{x1D6F1}=60$ at
 $Re_{\unicode[STIX]{x1D70F}}\approx 500$.

3.2 Flow regimes
We quantify the flow regimes of the transient response of the momentum-carrying eddies (responsible for  $-\langle u_{1}^{\prime }u_{2}^{\prime }\rangle$) subjected to non-equilibrium effects. It is assumed that the Reynolds number of the channel flow is sufficiently high to develop a multi-scale collection of randomly distributed momentum-carrying motions with their roots attached to the wall, as first conjectured by Townsend (Reference Townsend1976) and currently supported by a growing number of studies (e.g. Davidson, Nickels & Krogstad Reference Davidson, Nickels and Krogstad2006; Lozano-Durán et al. Reference Lozano-Durán, Flores and Jiménez2012; Hwang Reference Hwang2015; Hellström, Marusic & Smits Reference Hellström, Marusic and Smits2016; Hwang & Bengana Reference Hwang and Bengana2016; Baars, Hutchins & Marusic Reference Baars, Hutchins and Marusic2017; Dong et al. Reference Dong, Lozano-Durán, Sekimoto and Jiménez2017; Hwang & Sung Reference Hwang and Sung2018; Cheng et al. Reference Cheng, Li, Lozano-Durán and Liu2019; Yang, Willis & Hwang Reference Yang, Willis and Hwang2019). We can anticipate that, for low values of
 $\unicode[STIX]{x1D6F1}$, the perturbation introduced by the lateral forcing is very gentle and eddies evolve in a quasi-equilibrium state irrespective of their size and lifespan. Conversely, large values of
 $\unicode[STIX]{x1D6F1}$ are expected to drive the entire population of eddies at all scales across the boundary out of equilibrium. The non-dimensional parameters governing these flow regimes are
 $Re_{\unicode[STIX]{x1D70F}}$ and
 $\unicode[STIX]{x1D6F1}$.
The level of non-equilibrium endured by the momentum-carrying eddies can be estimated by assuming that, prior to the application of  $\unicode[STIX]{x1D6F1}$, the boundary layer is populated by a collection of wall-attached self-similar eddies with sizes
 $l_{e}$ proportional to the distance to the wall,
 $l_{e}\sim x_{2}$, and characteristic velocity
 $u_{\unicode[STIX]{x1D70F}}$ (Townsend Reference Townsend1976). Consequently, the characteristic lifetime of eddies of size
 $l_{e}$ is
 $t_{e}\sim x_{2}/u_{\unicode[STIX]{x1D70F}}$. The smallest momentum-carrying eddies are found close to the wall at
 $x_{2}\sim \unicode[STIX]{x1D708}/u_{\unicode[STIX]{x1D70F}}$ due to the limiting effect of viscosity, and their lifetimes reduce to
 $t_{e}\sim \unicode[STIX]{x1D708}/u_{\unicode[STIX]{x1D70F}}^{2}$. The largest eddies are constrained by the channel height
 $x_{2}\sim h$, with lifetimes
 $t_{e}\sim h/u_{\unicode[STIX]{x1D70F}}$. The lateral mean pressure gradient introduces an additional time scale associated with the spanwise acceleration of the flow,
 $t_{p}\sim \unicode[STIX]{x1D70C}u_{\unicode[STIX]{x1D70F}}/(\text{d}P/\text{d}x_{3})$. The condition for non-equilibrium is
 $t_{p}<t_{e}$, i.e. the characteristic time to accelerate the flow in the spanwise direction is shorter than the lifetime of the momentum-carrying eddies in order to shove the latter out of the equilibrium state. A similar conclusion is drawn by reasoning in terms of the minimum strength of the lateral shear layer
 $\unicode[STIX]{x2202}\langle u_{3}\rangle /\unicode[STIX]{x2202}x_{2}$ necessary to disturb the local-in-
 $x_{2}$ mean shear of the wall-attached eddies
 $\unicode[STIX]{x2202}\langle u_{1}\rangle /\unicode[STIX]{x2202}x_{2}$. The former was shown to be
 $\unicode[STIX]{x2202}\langle u_{3}\rangle /\unicode[STIX]{x2202}x_{2}\sim (\text{d}P/\text{d}x_{3})/(\unicode[STIX]{x1D70C}u_{\unicode[STIX]{x1D70F}})$ in § 3.1, while the latter can be approximated by assuming a logarithmic mean velocity profile of the form
 $\langle u_{1}\rangle \sim (u_{\unicode[STIX]{x1D70F}}/\unicode[STIX]{x1D705})\log (x_{2}^{+})$ such that
 $\unicode[STIX]{x2202}\langle u_{1}\rangle /\unicode[STIX]{x2202}x_{2}\sim u_{\unicode[STIX]{x1D70F}}/x_{2}$. Then, the lateral mean shear required to overcome the mean streamwise shear is
 $u_{\unicode[STIX]{x1D70F}}/x_{2}<(\text{d}P/\text{d}x_{3})/(\unicode[STIX]{x1D70C}u_{\unicode[STIX]{x1D70F}})$, which is equivalent to time-scale argument,
 $t_{p}<t_{e}$, discussed above.
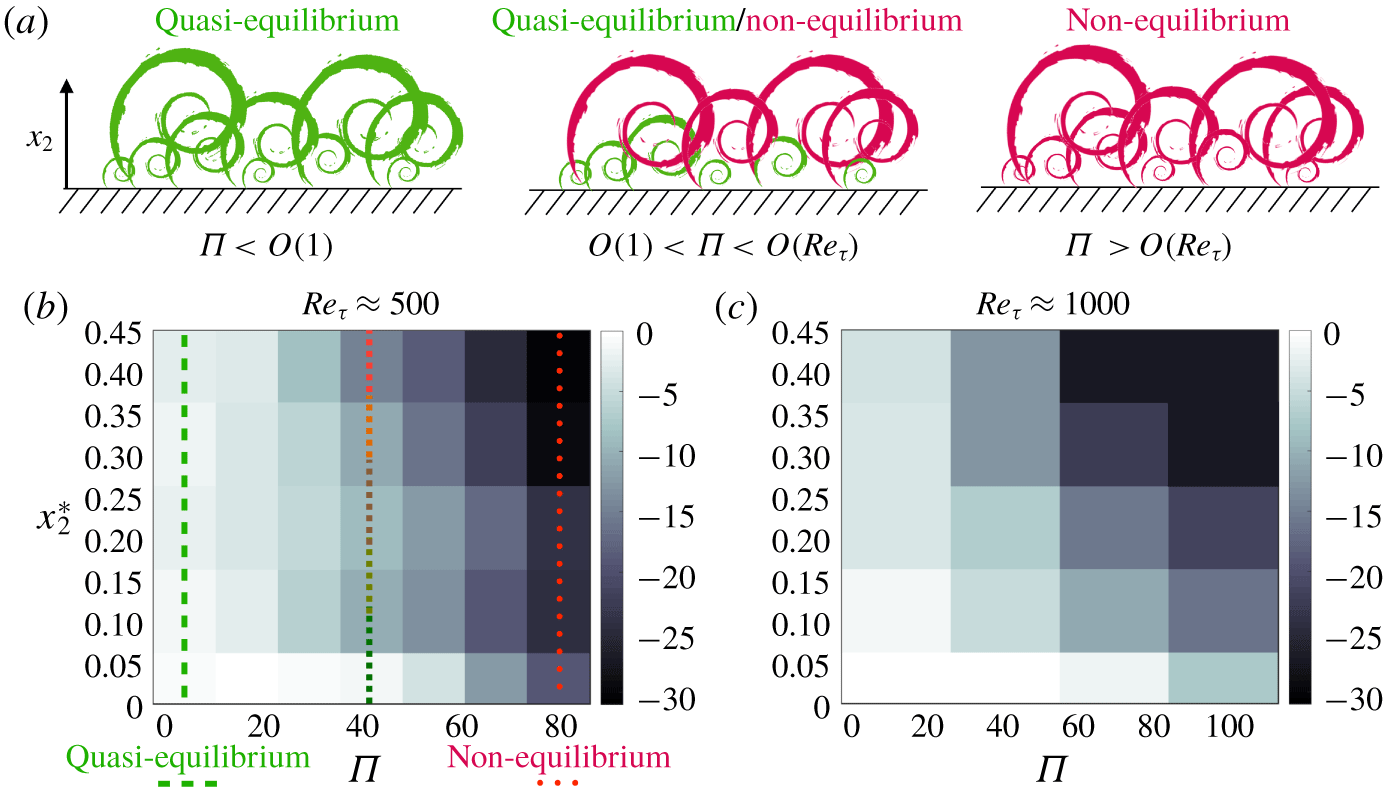
Based on the flow scales discussed above, we differentiate three flow regimes as sketched in figure 6(a). For  $\unicode[STIX]{x1D6F1}<O(1)$ (
 $t_{p}>t_{e}$), the spanwise pressure gradient is categorised as weak, and all flow scales relax instantly to a quasi-equilibrium state during the transient period. Conversely, for
 $\unicode[STIX]{x1D6F1}>O(Re_{\unicode[STIX]{x1D70F}})$ (
 $t_{p}<t_{e}$), the momentum-carrying eddies are unable to adjust to the prompt imposition of the shear regardless of their size. For intermediate values of
 $\unicode[STIX]{x1D6F1}$, eddies coexist in both quasi-equilibrium and non-equilibrium states, the former being the eddies located in the region closer to the wall.
(a) Schematic of self-similar, wall-attached, momentum-carrying eddies, and different flow regimes as a function of the spanwise-to-streamwise mean pressure gradient ratio  $\unicode[STIX]{x1D6F1}$. The eddies coloured in green are in a quasi-equilibrium state, whereas the eddies coloured in red are out of equilibrium. (b,c) The percentage drop of tangential Reynolds stress,
 $\min _{t}\{D_{\unicode[STIX]{x1D70F}}\}$, in the frame of reference of the mean shear
 $\tilde{{\mathcal{F}}}$ as a function of the spanwise-to-streamwise mean pressure gradient ratio
 $\unicode[STIX]{x1D6F1}$ and wall-normal distance
 $x_{2}^{\ast }$ for (b)
 $Re_{\unicode[STIX]{x1D70F}}\approx 500$ and (c)
 $Re_{\unicode[STIX]{x1D70F}}\approx 1000$. The vertical lines in panel (b) represent flow states ranging from the equilibrium regime (green) to non-equilibrium regime (red).

The analysis above is corroborated in figure 6(b,c), which shows the maximum percentage drop of the tangential Reynolds stress during the transient period after the imposition of the lateral mean pressure gradient,  $\min _{t}\{D_{\unicode[STIX]{x1D70F}}(x_{2},t)\}$, where
 $D_{\unicode[STIX]{x1D70F}}$ is defined as
 $$\begin{eqnarray}D_{\unicode[STIX]{x1D70F}}(x_{2},t)=\frac{\langle \tilde{u} _{1}\tilde{u} _{2}\rangle (x_{2},t)-\langle \tilde{u} _{1}\tilde{u} _{2}\rangle (x_{2},0)}{\langle \tilde{u} _{1}\tilde{u} _{2}\rangle (x_{2},0)}\times 100.\end{eqnarray}$$
Note that the Reynolds stress in (3.1) is referred to the frame of reference  $\tilde{{\mathcal{F}}}$ aligned with the mean shear. Similar conclusions are drawn when the stress is referred to
 ${\mathcal{F}}$. The results in figure 6(b) reveal that the relative reduction in the Reynolds stress attains up to 30 %, and that the drop accentuates for increasing
 $\unicode[STIX]{x1D6F1}$ and
 $x_{2}^{\ast }$. Figure 6(c) confirms that the trend holds at higher
 $Re_{\unicode[STIX]{x1D70F}}$.
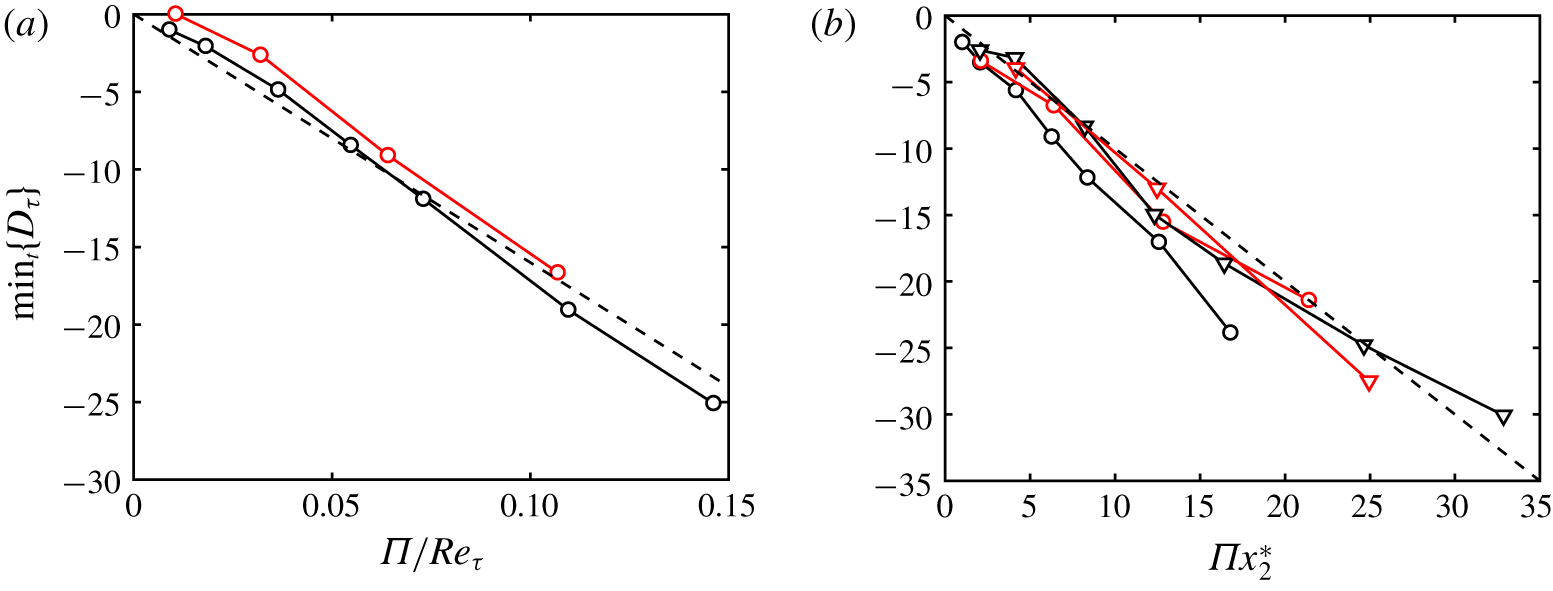
Maximum percentage drop of the tangential Reynolds stress  $\min _{t}\{D_{\unicode[STIX]{x1D70F}}\}$ in the frame of reference of the mean shear. Colours are black for cases at
 $Re_{\unicode[STIX]{x1D70F}}\approx 500$ and red for cases at
 $Re_{\unicode[STIX]{x1D70F}}\approx 1000$. In panel (a), solid lines with circles are
 $\min _{t}\{D_{\unicode[STIX]{x1D70F}}\}$ at
 $x_{2}^{+}=30$, and the dashed line is
 $\min _{t}\{D_{\unicode[STIX]{x1D70F}}\}\approx -160\unicode[STIX]{x1D6F1}/Re_{\unicode[STIX]{x1D70F}}$. In panel (b), lines with symbols are
 $\min _{t}\{D_{\unicode[STIX]{x1D70F}}\}$ at
 $x_{2}^{\ast }=0.2$ (○) and
 $x_{2}^{\ast }=0.4$ (▿), and the dashed line corresponds to
 $\min _{t}\{D_{\unicode[STIX]{x1D70F}}\}\approx -\unicode[STIX]{x1D6F1}x_{2}^{\ast }$.

The scaling of  $\min _{t}\{D_{\unicode[STIX]{x1D70F}}\}$ is inspected in figure 7, which contains various cuts of the
 $(\unicode[STIX]{x1D6F1},x_{2}^{\ast })$ maps shown in figure 6(b,c). Within the buffer region (figure 7a), the response of the flow is controlled by the viscous scales. The momentum equation in inner units is given by
 $$\begin{eqnarray}\frac{{\mathcal{D}}u_{i}^{+}}{{\mathcal{D}}t^{+}}=-\frac{\unicode[STIX]{x2202}p^{\prime +}}{\unicode[STIX]{x2202}x_{i}^{+}}-\frac{\text{d}P^{+}}{\text{d}x_{i}^{+}}\unicode[STIX]{x1D6FF}_{i3}+\frac{\unicode[STIX]{x2202}^{2}u_{i}^{+}}{\unicode[STIX]{x2202}x_{k}^{+}\unicode[STIX]{x2202}x_{k}^{+}},\end{eqnarray}$$
where  ${\mathcal{D}}$ denotes material derivative and
 $\text{d}P^{+}/\text{d}x_{1}^{+}=O(1/Re_{\unicode[STIX]{x1D70F}})$ has been neglected. From (3.2), we conclude that a similar reduction in the Reynolds stress is obtained across different
 $Re_{\unicode[STIX]{x1D70F}}$ for identical values of
 $\text{d}P^{+}/\text{d}x_{3}^{+}=\unicode[STIX]{x1D6F1}/Re_{\unicode[STIX]{x1D70F}}$, which is the relevant spanwise-to-streamwise mean pressure gradient for the buffer region.
For the logarithmic layer, for which the high- $Re_{\unicode[STIX]{x1D70F}}$ analysis holds (figure 7b), wall-attached eddies of a given size
 $l_{e}\sim x_{2}$ experience a similar drop in the Reynolds stress when the mean spanwise pressure gradient is normalised by the characteristic scales,
 $x_{2}$ and
 $u_{\unicode[STIX]{x1D70F}}$, controlling the eddies. Analysis of the non-dimensional equations obtained by introducing the similarity variable
 $\unicode[STIX]{x1D702}=t/t_{e}=tu_{\unicode[STIX]{x1D70F}}/x_{2}$ reveals that the condition for self-similar Reynolds stress depletion at a given wall-normal distance is obtained by a common value of the compensated spanwise-to-streamwise mean pressure gradient ratio,
 $\unicode[STIX]{x1D6F1}x_{2}^{\ast }$, consistent with the results from figure 7(b).
From the scaling analysis above and the numerical results in figure 7, the quantitative drop in Reynolds stress for the flow motions free of viscous effects at a given  $x_{2}$ location is well approximated by
 $$\begin{eqnarray}\min _{t}\{D_{\unicode[STIX]{x1D70F}}\}\approx -\unicode[STIX]{x1D6F1}x_{2}^{\ast }.\end{eqnarray}$$
If we further assume that the self-similar scaling of the flow motions with  $x_{2}$ does not hold below
 $x_{2}^{+}\approx 160$, the inner-layer scaling law for the Reynolds stress decrease implied by (3.3) is
 $$\begin{eqnarray}\min _{t}\{D_{\unicode[STIX]{x1D70F}}\}\approx -160\frac{\unicode[STIX]{x1D6F1}}{Re_{\unicode[STIX]{x1D70F}}},\end{eqnarray}$$
which is valid for the buffer region and serves as an approximation to the trends observed in figure 7(a).
Finally, a tentative relation delimiting the necessary spanwise forcing to achieve the fully non-equilibrium regime (eddies out of equilibrium across almost the entire boundary layer), arbitrarily delimited by  $\min _{t}\{D_{\unicode[STIX]{x1D70F}}\}<-5\,\%$, is given by
 $$\begin{eqnarray}\unicode[STIX]{x1D6F1}>0.03Re_{\unicode[STIX]{x1D70F}}.\end{eqnarray}$$
Equation (3.5) shows that the lateral mean pressure gradient required to attain the fully non-equilibrium regime increases proportionally to the Reynolds number. Note that (3.5) is a non-equilibrium condition for  $x_{2}^{+}>30$. Prescribing a lower wall-normal limit would result in an even more stringent condition than (3.5). The meaning of
 $\unicode[STIX]{x1D6F1}$ in this particular flow cannot be unambiguously extrapolated to more general flow configurations. Nonetheless, the time-scale argument used to derive (3.5) suggests that, in external aerodynamic applications, the inner layer is most likely to be found in a quasi-equilibrium state given the high Reynolds numbers typically encountered in these situations.
3.3 Evolution of the tangential Reynolds stress
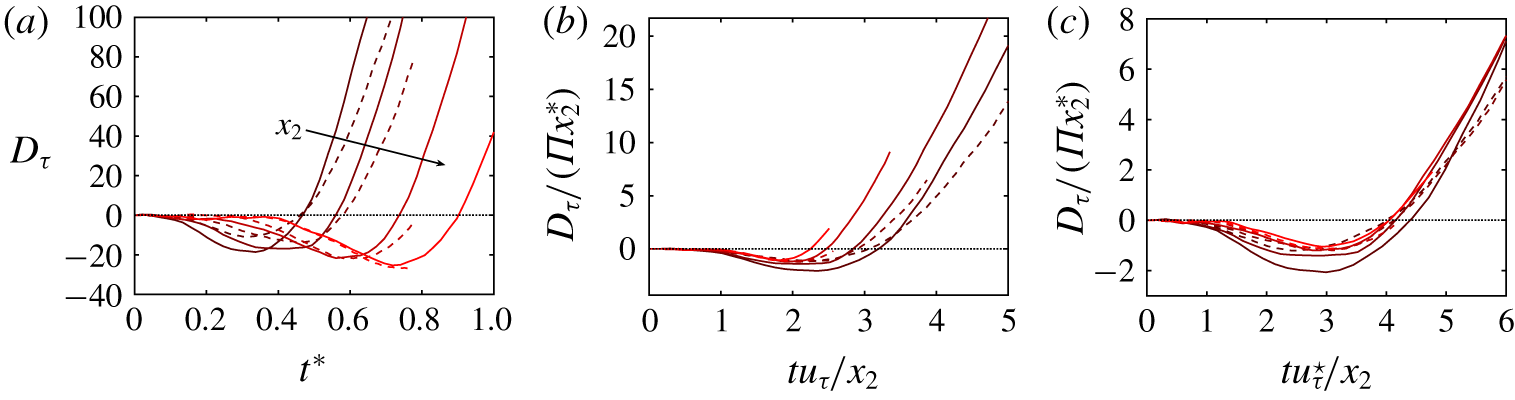
In the previous subsection we were concerned with the maximum drop in the tangential Reynolds stress without consideration of its time response. Here, we discuss the scaling of the evolution of  $D_{\unicode[STIX]{x1D70F}}$ for 3-D channels in the fully non-equilibrium regime, i.e.
 $\unicode[STIX]{x1D6F1}>0.03Re_{\unicode[STIX]{x1D70F}}$, which is the most intriguing case from the physical viewpoint. As in § 3.2, we perform the analysis separately for the buffer region and logarithmic layer, although the former can be thought of as the near-wall limit of the latter.
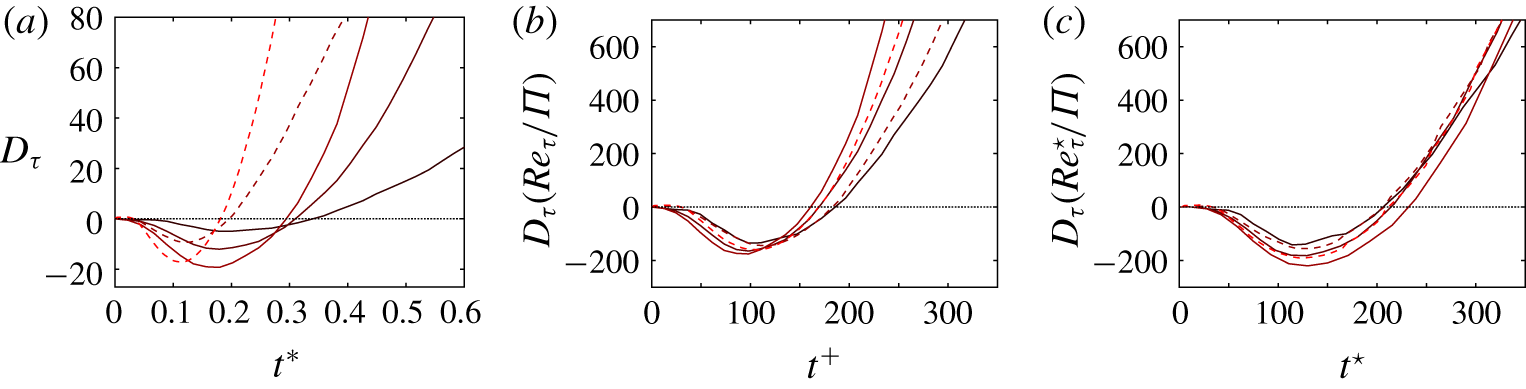
The evolution of  $D_{\unicode[STIX]{x1D70F}}$ in the buffer layer is plotted in figure 8 for various pairs of
 $(Re_{\unicode[STIX]{x1D70F}},\unicode[STIX]{x1D6F1})$. Three scalings are inspected. Figure 8(a) shows the evolution of
 $D_{\unicode[STIX]{x1D70F}}$ as a function of time normalised in outer units. Unsurprisingly, both the intensity of
 $D_{\unicode[STIX]{x1D70F}}$ and the time instant for the maximum drop vary considerably among distinct combinations of
 $(Re_{\unicode[STIX]{x1D70F}},\unicode[STIX]{x1D6F1})$. Inasmuch as the near-wall eddies do not scale in outer units, the results in figure 8(a) are included only to expose the lack of collapse among cases under an inadequate normalisation. The time scaling using wall units is tested in figure 8(b). It was argued in § 3.2 that the depletion of Reynolds stress within the inner layer is proportional to
 $\unicode[STIX]{x1D6F1}/Re_{\unicode[STIX]{x1D70F}}$. Consequently, the results in figure 8(b) are plotted against the compensated Reynolds stress drop,
 $D_{\unicode[STIX]{x1D70F}}Re_{\unicode[STIX]{x1D70F}}/\unicode[STIX]{x1D6F1}$. The new scaling improves the collapse of the results, especially for
 $t^{+}<150$, above which the evolution of
 $D_{\unicode[STIX]{x1D70F}}Re_{\unicode[STIX]{x1D70F}}/\unicode[STIX]{x1D6F1}$ diverges among cases. The absence of collapse for
 $t^{+}>150$ coincides with the typical lifetime of the momentum-carrying eddies in the buffer layer (Lozano-Durán & Jiménez Reference Lozano-Durán and Jiménez2014b). Thus,
 $u_{\unicode[STIX]{x1D70F}}$ (defined at
 $t=0$) is representative of the originally-in-equilibrium near-wall eddies until the generation cycle is restarted and newborn eddies emerge under different flow conditions. Following the previous reasoning, the collapse can be further improved under the assumption that the length and time scales of the newly created eddies are controlled by the local-in-time friction velocity
 $$\begin{eqnarray}u_{\unicode[STIX]{x1D70F}}^{\star \,2}(t)=\left.\sqrt{\left(\unicode[STIX]{x1D708}\frac{\unicode[STIX]{x2202}\langle u_{1}\rangle }{\unicode[STIX]{x2202}x_{2}}\right)^{2}+\left(\unicode[STIX]{x1D708}\frac{\unicode[STIX]{x2202}\langle u_{3}\rangle }{\unicode[STIX]{x2202}x_{2}}\right)^{2}}\right|_{x_{2}=0}.\end{eqnarray}$$
The local wall units, denoted by  $(\cdot )^{\star }$, are analogously defined in terms of
 $\unicode[STIX]{x1D708}$ and
 $u_{\unicode[STIX]{x1D70F}}^{\star }(t)$, and the local friction Reynolds number is
 $Re_{\unicode[STIX]{x1D70F}}^{\star }(t)=u_{\unicode[STIX]{x1D70F}}^{\star }(t)h/\unicode[STIX]{x1D708}$. The results in figure 8(c) confirm that the local scaling (
 $t^{\star }$ versus
 $D_{\unicode[STIX]{x1D70F}}Re_{\unicode[STIX]{x1D70F}}^{\star }/\unicode[STIX]{x1D6F1}$) holds for longer times.
Evolution of the percentage change of tangential Reynolds stress  $D_{\unicode[STIX]{x1D70F}}$ in the buffer layer for
 $x_{2}^{+}=30$ in panels (a) and (b), and for
 $x_{2}^{\star }=30$ in panel (c). The lines are for
 $Re_{\unicode[STIX]{x1D70F}}\approx 500$ (——) and for
 $Re_{\unicode[STIX]{x1D70F}}\approx 1000$ (– – –). For cases at
 $Re_{\unicode[STIX]{x1D70F}}\approx 500$, colours are
 $\unicode[STIX]{x1D6F1}=20$, 40 and 60 from dark red to light red. For cases at
 $Re_{\unicode[STIX]{x1D70F}}\approx 1000$, colours are dark red for
 $\unicode[STIX]{x1D6F1}=60$ and light red for
 $\unicode[STIX]{x1D6F1}=100$.

The evolution of  $D_{\unicode[STIX]{x1D70F}}$ for the momentum-carrying eddies across the logarithmic layer is shown in figure 9, where three scaling laws are investigated. The evolution of
 $D_{\unicode[STIX]{x1D70F}}$ in outer units is included in figure 9(a). Wall-attached eddies follow an ordered response in time after the sudden imposition of the transverse pressure gradient: eddies closer to the wall react earlier and are the least perturbed, while larger eddies experience a more acute Reynolds stress reduction at later times. The preceding analysis for the buffer region is extended to the logarithmic layer by taking into consideration that the lifetimes of the wall-attached eddies scale as
 ${\sim}x_{2}/u_{\unicode[STIX]{x1D70F}}$, with a consistent drop in the Reynolds stress proportional to
 $\unicode[STIX]{x1D6F1}x_{2}^{\ast }$. The self-similar response of wall-attached eddies under the lateral force is evidenced by the improved collapse in figure 8(b), at least for
 $tu_{\unicode[STIX]{x1D70F}}/x_{2}\lesssim 1$. Analogously to the inner layer,
 $u_{\unicode[STIX]{x1D70F}}$ stands as the characteristic velocity scale of the original eddies in the equilibrium state, but does not hold as such for times longer than the lifespan of individual wall-attached eddies,
 $tu_{\unicode[STIX]{x1D70F}}/x_{2}\approx 1$ (Lozano-Durán & Jiménez Reference Lozano-Durán and Jiménez2014b). The collapse among cases is perfected by using the local time scale
 $tu_{\unicode[STIX]{x1D70F}}^{\star }/x_{2}$ (figure 8c), which accounts for variations in the momentum transfer controlling the eddies during the transient. We close this subsection by highlighting that the scaling properties of the flow studied above are conspicuous only at moderate to high Reynolds numbers. The response of the flow at lower Reynolds numbers is discussed in appendix A, where it is shown that 3-D channels at
 $Re_{\unicode[STIX]{x1D70F}}\approx 180$ lack the necessary scale separation to exhibit a multiscale depletion of the Reynolds stress.
Evolution of the percentage change of tangential Reynolds stress  $D_{\unicode[STIX]{x1D70F}}$ in the logarithmic layer for
 $x_{2}^{\ast }=0.15$, 0.2, 0.3 and 0.4 represented by lines coloured from dark red to light red. The lines are for cases at
 $Re_{\unicode[STIX]{x1D70F}}\approx 500$ (——) and at
 $Re_{\unicode[STIX]{x1D70F}}\approx 1000$ (– – –), both for
 $\unicode[STIX]{x1D6F1}=60$. The arrow in panel (a) indicates increasing wall-normal distance.

3.4 Structural changes in the conditionally averaged flow field
We examine the structural evolution of the flow in the surroundings of the momentum-carrying eddies. To that end, we identify 3-D structures of the intense momentum transfer using the methodology introduced by Lozano-Durán et al. (Reference Lozano-Durán, Flores and Jiménez2012) (see also Lozano-Durán & Jiménez Reference Lozano-Durán and Jiménez2014b; Lozano-Durán & Borrell Reference Lozano-Durán and Borrell2016). An individual structure (or object) of intense momentum transfer at time  $t$ is defined as a spatially connected region in the flow satisfying
 $$\begin{eqnarray}-u_{1}^{\prime }(x_{1},x_{2},x_{3},t)u_{2}^{\prime }(x_{1},x_{2},x_{3},t)>H\langle u_{1}^{\prime \,2}\rangle ^{1/2}(x_{2},t)\langle u_{2}^{\prime \,2}\rangle ^{1/2}(x_{2},t),\end{eqnarray}$$
where  $H$ is a thresholding parameter (hyperbolic hole size (Bogard & Tiederman Reference Bogard and Tiederman1986)) equal to 1.75 obtained following the analysis by Moisy & Jiménez (Reference Moisy and Jiménez2004). It was tested that varying
 $H$ within the range
 $0.5<H<3$ does not change the conclusions below. The original frame of reference defined by
 ${\mathcal{F}}$ is preferred to
 $\tilde{{\mathcal{F}}}$ in order to avoid artificial distortions in the flow due to the time and space variations in
 $\tilde{{\mathcal{F}}}$. Hereafter, we refer to individual structures of intense
 $-u_{1}^{\prime }u_{2}^{\prime }$ events as
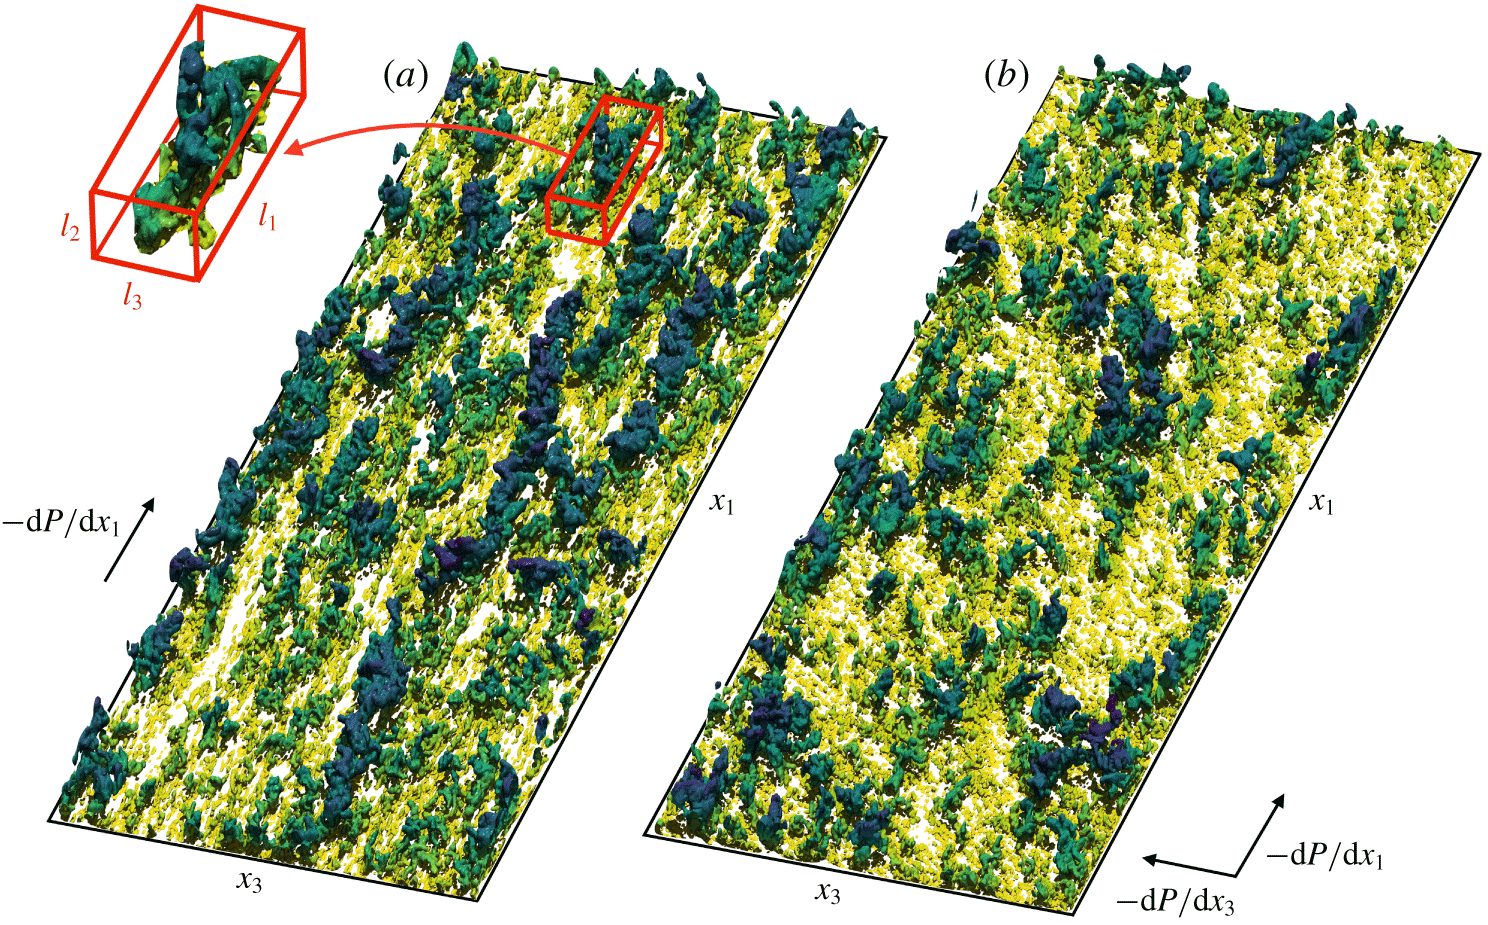
 $-u_{1}^{\prime }u_{2}^{\prime }$ structures. Numerically, 3-D structures are constructed by connecting neighbouring grid points fulfilling (3.7) and using the 6-connectivity criteria (Rosenfeld & Kak Reference Rosenfeld and Kak1982). Figure 10 shows the wall-attached
 $-u_{1}^{\prime }u_{2}^{\prime }$ structures identified before and after the imposition of the spanwise pressure gradient. Figure 10 also includes one individual
 $-u_{1}^{\prime }u_{2}^{\prime }$ structure highlighted by the box with red edges.
Instantaneous  $-u_{1}^{\prime }u_{2}^{\prime }$ structures defined by (3.7) for
 $\unicode[STIX]{x1D6F1}=60$ and
 $Re_{\unicode[STIX]{x1D70F}}\approx 1000$ at (a)
 $t^{\ast }=0$ and (b)
 $t^{\ast }=0.5$. Only
 $-u_{1}^{\prime }u_{2}^{\prime }$ structures attached to the bottom wall are shown. The colours represent the distance to the wall, from yellow (closer to the wall) to blue (farther from the wall). The box with edges coloured in red is the bounding box of one individual
 $-u_{1}^{\prime }u_{2}^{\prime }$ structure with streamwise, wall-normal and spanwise sizes equal to
 $l_{1}$,
 $l_{2}$ and
 $l_{3}$, respectively.

We focus our attention on the channel at  $Re_{\unicode[STIX]{x1D70F}}\approx 1000$ and
 $\unicode[STIX]{x1D6F1}=60$, but similar results are obtained consistently across different
 $Re_{\unicode[STIX]{x1D70F}}$ and
 $\unicode[STIX]{x1D6F1}$, provided that the latter is large enough to attain the fully non-equilibrium regime. We select three time instants to assess the structural changes in the flow, namely,
 $t^{\ast }=0$,
 $t^{\ast }=0.25$ and
 $t^{\ast }=0.50$. The evolution of
 $D_{\unicode[STIX]{x1D70F}}$ is plotted in figure 11(a), which shows that the maximum drop in the tangential Reynolds stress occurs at
 $t^{\ast }\approx 0.50$.
(a) Evolution of the percentage change of tangential Reynolds stress  $D_{\unicode[STIX]{x1D70F}}$ at
 $x_{2}^{\ast }=0.25$. The vertical lines are the times selected to study the flow structure in addition to
 $t^{\ast }=0$, namely
 $t^{\ast }=0.25$ (– – –) and
 $t^{\ast }=0.5$ (
 $\cdots \cdots$). (b) Joint p.d.f.s of the logarithms of the streamwise
 $l_{1}$ and wall-normal
 $l_{2}$ sizes of wall-attached
 $-u_{1}^{\prime }u_{2}^{\prime }$ structures,
 $p(l_{1}^{+},l_{2}^{+})$. The contours plotted contain 50 % and 99.8 % of the probability. The lines are for
 $t^{\ast }=0$ (

 $t^{\ast }=0.25$ (

 $t^{\ast }=0.5$ (

 $l_{1}^{+}=3l_{2}^{+}$ and the arrow indicates the direction of time. The results are for
 $Re_{\unicode[STIX]{x1D70F}}\approx 1000$ and
 $\unicode[STIX]{x1D6F1}=60$.

The identification procedure above yields approximately  $10^{5}$ structures at each time instant after discarding those objects with volumes smaller than
 $30^{3}$ wall units. The sizes of the objects are measured by circumscribing each structure within a box aligned to the Cartesian axes, whose streamwise, wall-normal and spanwise sizes are denoted by
 $l_{1}$,
 $l_{2}$ and
 $l_{3}$, respectively. The minimum and maximum distances of each object to the closest wall are
 $x_{2,min}$ and
 $x_{2,max}$, respectively, and such that
 $l_{2}=x_{2,max}-x_{2,min}$. An example of an individual
 $-u_{1}^{\prime }u_{2}^{\prime }$ structure and its bounding box is included in figure 10(a). The bounding boxes of the structures are aligned with the original flow direction. At
 $t^{\ast }=0.5$, the mean shear at the centre of gravity of a
 $-u_{1}^{\prime }u_{2}^{\prime }$ structure of size
 $x_{2}^{\ast }\approx 0.4$ is rotated by
 $\unicode[STIX]{x1D6FE}_{S}\approx 15^{\circ }$ (see also figure 10b). This low turning angle justifies the selection of
 ${\mathcal{F}}$ to study the flow for short times, as is the case here, but the investigation of structural changes for longer times would require a properly chosen rotating frame of reference. We centre our attention on wall-attached
 $-u_{1}^{\prime }u_{2}^{\prime }$ structures, defined as those with
 $x_{2,min}^{+}<25$ (del Álamo et al. Reference del Álamo, Jiménez, Zandonade and Moser2006). For the value of
 $H$ selected, wall-attached structures are responsible for more than 60 % of the tangential Reynolds stress at all three times considered. Figure 11(b) shows the joint probability density function (p.d.f.) of the sizes of the wall-attached structures,
 $p(l_{1}^{+},l_{2}^{+})$. At
 $t^{\ast }=0$, the distribution of sizes is consistent with a geometrically self-similar population of structures akin to the wall-attached eddies envisioned by Townsend (Reference Townsend1976) at high Reynolds numbers. The mode of the p.d.f. follows a reasonably well-defined linear law,
 $l_{1}\sim 3l_{2}$, consistent with previous studies (Lozano-Durán et al. Reference Lozano-Durán, Flores and Jiménez2012). From
 $t^{\ast }=0$ to
 $t^{\ast }=0.50$, the most pronounced modification in the geometry of the structures is a gradual shortening of their streamwise length, while their wall-normal heights are barely affected.
Each  $-u_{1}^{\prime }u_{2}^{\prime }$ structure can be classified either as an ejection, when the average wall-normal velocity within its enclosed volume is positive, or as a sweep otherwise. Sweeps and ejections are known to be spatially organised in pairs side-by-side along the spanwise direction (Ganapathisubramani Reference Ganapathisubramani2008; Lozano-Durán et al. Reference Lozano-Durán, Flores and Jiménez2012; Wallace Reference Wallace2016; Osawa & Jiménez Reference Osawa and Jiménez2018). This sweep–ejection group, representative of a streamwise roll, is the predominant logarithmic-layer flow structure responsible for the generation of tangential Reynolds stress. Consequently, we are interested in examining the modification of the flow around sweep–ejection pairs during the transient period. We denote the centre of gravity of the bounding boxes of the
 $n$th sweep and its paring ejection as
 $\boldsymbol{x}_{s}^{n}$ and
 $\boldsymbol{x}_{e}^{n}$, respectively. The wall-normal size of the sweep is
 $l_{2,s}^{n}$ and that of the ejection is
 $l_{2,e}^{n}$. The averaged flow field conditioned to the presence of a sweep–ejection pair is computed by averaging the velocity vector in a rectangular domain along different
 $n$th pairs, whose centre coincides with
 $\boldsymbol{x}_{p}^{n}=(\boldsymbol{x}_{e}^{n}+\boldsymbol{x}_{s}^{n})/2$, and it edges are
 $\boldsymbol{r}$ times the average wall-normal height
 $l_{p}^{n}=(l_{2,e}^{n}+l_{2,s}^{n})/2$. Then, the conditionally averaged flow around sweep–ejection pairs is given by
 $$\begin{eqnarray}\{u_{i}^{\prime }\}(\boldsymbol{r})=\mathop{\sum }_{n=1}^{N}\frac{u_{i}^{\prime }(\boldsymbol{x}_{p}^{n}+l_{p}^{n}\boldsymbol{r})}{N},\end{eqnarray}$$
where  $n=1,\ldots ,N$ is the set of sweep–ejection pairs selected to perform the conditional average, and
 $\boldsymbol{r}=(r_{1},r_{2},r_{3})$. We also take advantage of the spanwise symmetry of the flow, and
 $r_{3}$ is always chosen to be positive towards the sweep. The reader is referred to Lozano-Durán et al. (Reference Lozano-Durán, Flores and Jiménez2012) and Dong et al. (Reference Dong, Lozano-Durán, Sekimoto and Jiménez2017) for additional details on the procedure to obtain conditional flow fields.
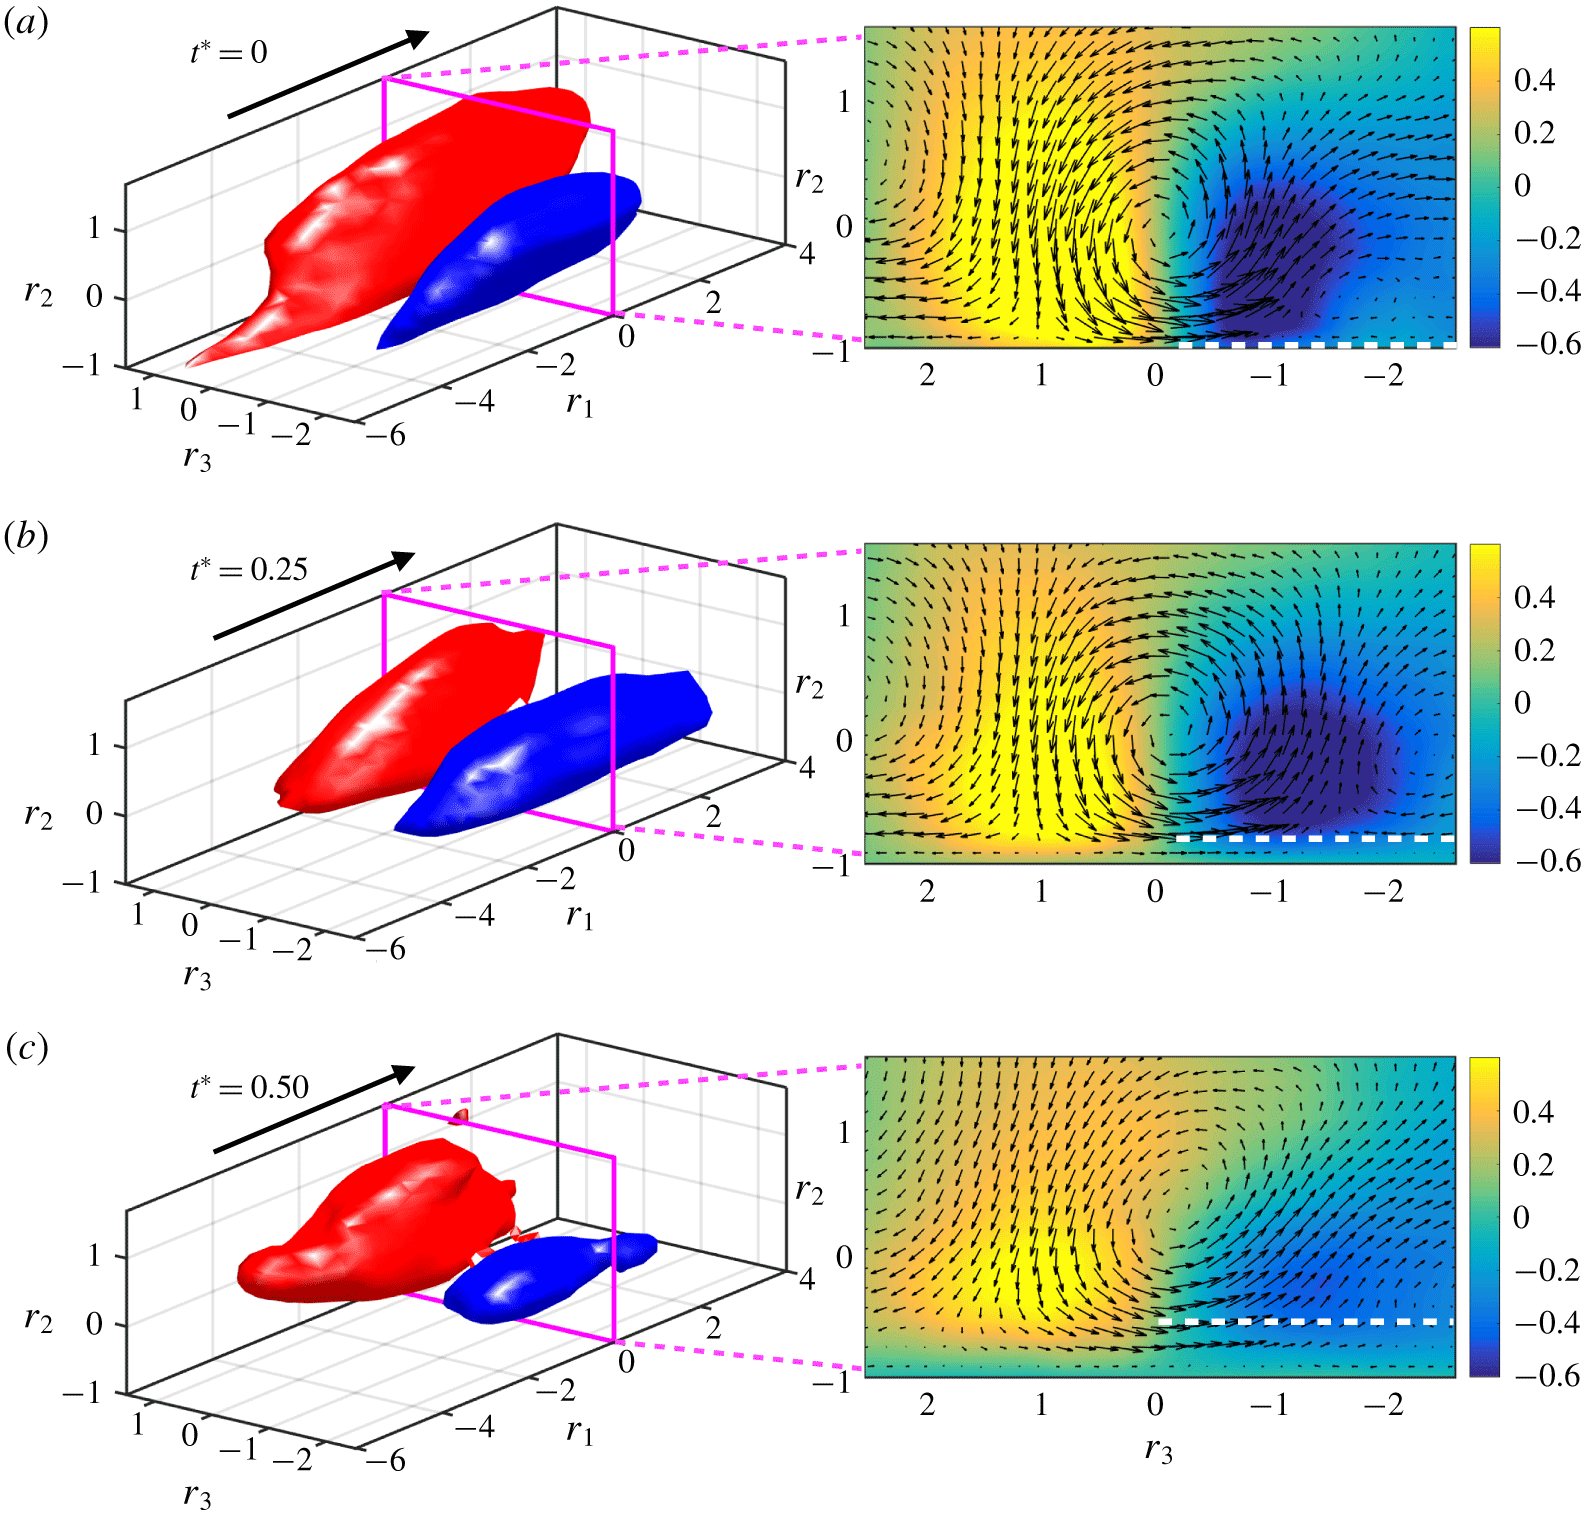
Averaged flow fields conditioned to wall-attached pairs of sweeps and ejections with wall-normal sizes in the range  $0.2<l_{p}^{n\ast }<0.3$ at (a)
 $t^{\ast }=0$, (b)
 $t^{\ast }=0.25$ and (c)
 $t^{\ast }=0.50$. The panels on the left contain isosurfaces of the low-velocity (blue) and high-velocity (red) streaks defined by
 $\pm \unicode[STIX]{x1D6FC}$ of the maximum positive and negative, respectively, fluctuating streamwise velocity of the average flow with (a)
 $\unicode[STIX]{x1D6FC}=0.6$, (b)
 $\unicode[STIX]{x1D6FC}=0.55$ and (c)
 $\unicode[STIX]{x1D6FC}=0.43$. The arrows indicate the mean flow direction. The panels on the right display the cross-flow velocity vector field
 $(\{u_{2}^{\prime }\},\{u_{3}^{\prime }\})$ (arrows) and the fluctuating velocity
 $\{u_{1}^{\prime }\}$ (colours). The dashed white line shows the wall-normal extension from the wall of the incoherent streamwise velocity field represented by low values of
 $\{u_{1}^{\prime }\}$ in green. Velocities are normalised by
 $u_{\unicode[STIX]{x1D70F}}$. Results are for
 $\unicode[STIX]{x1D6F1}=60$ at
 $Re_{\unicode[STIX]{x1D70F}}\approx 1000$.

The averaged flow field conditioned to sweep–ejection pairs with  $0.2<l_{p}^{n\,\ast }<0.3$ is plotted in figure 12. At
 $t^{\ast }=0$ (figure 12a), the characteristic flow structure consistent with the statistically-in-equilibrium flow state is a streamwise roll flanked by one low-velocity streak and one high-velocity streak. At succeeding times (figure 12b,c), the roll persists, while the intensity and size of the low-velocity streak have already decreased at
 $t^{\ast }=0.5$. The high-velocity streak and roll are also weakened, but the variations are less pronounced. Another observation is the loss of coherence in a developing layer underneath the low-velocity streak. This effect is demonstrated by the low values of
 $\{u_{1}^{\prime }\}$ represented by the green regions below the white dashed lines in figure 12 (right panels). The nearly zero averaged streamwise velocity for
 $t^{\ast }>0$ is an indication that, from the viewpoint of the larger rolls, the fluid motions below cancel out and are perceived as incoherent. During the transient, both low- and high-velocity streaks shorten in the streamwise direction in accordance with the geometric analysis in figure 11(b). Although not shown, the results above are also applicable to sweep–ejection pairs across different ranges of
 $l_{p}^{n}$ when the times are appropriately scaled by
 $l_{p}^{n}/u_{\unicode[STIX]{x1D70F}}^{\star }$, implying that the modifications in the flow are self-similar in space and time.
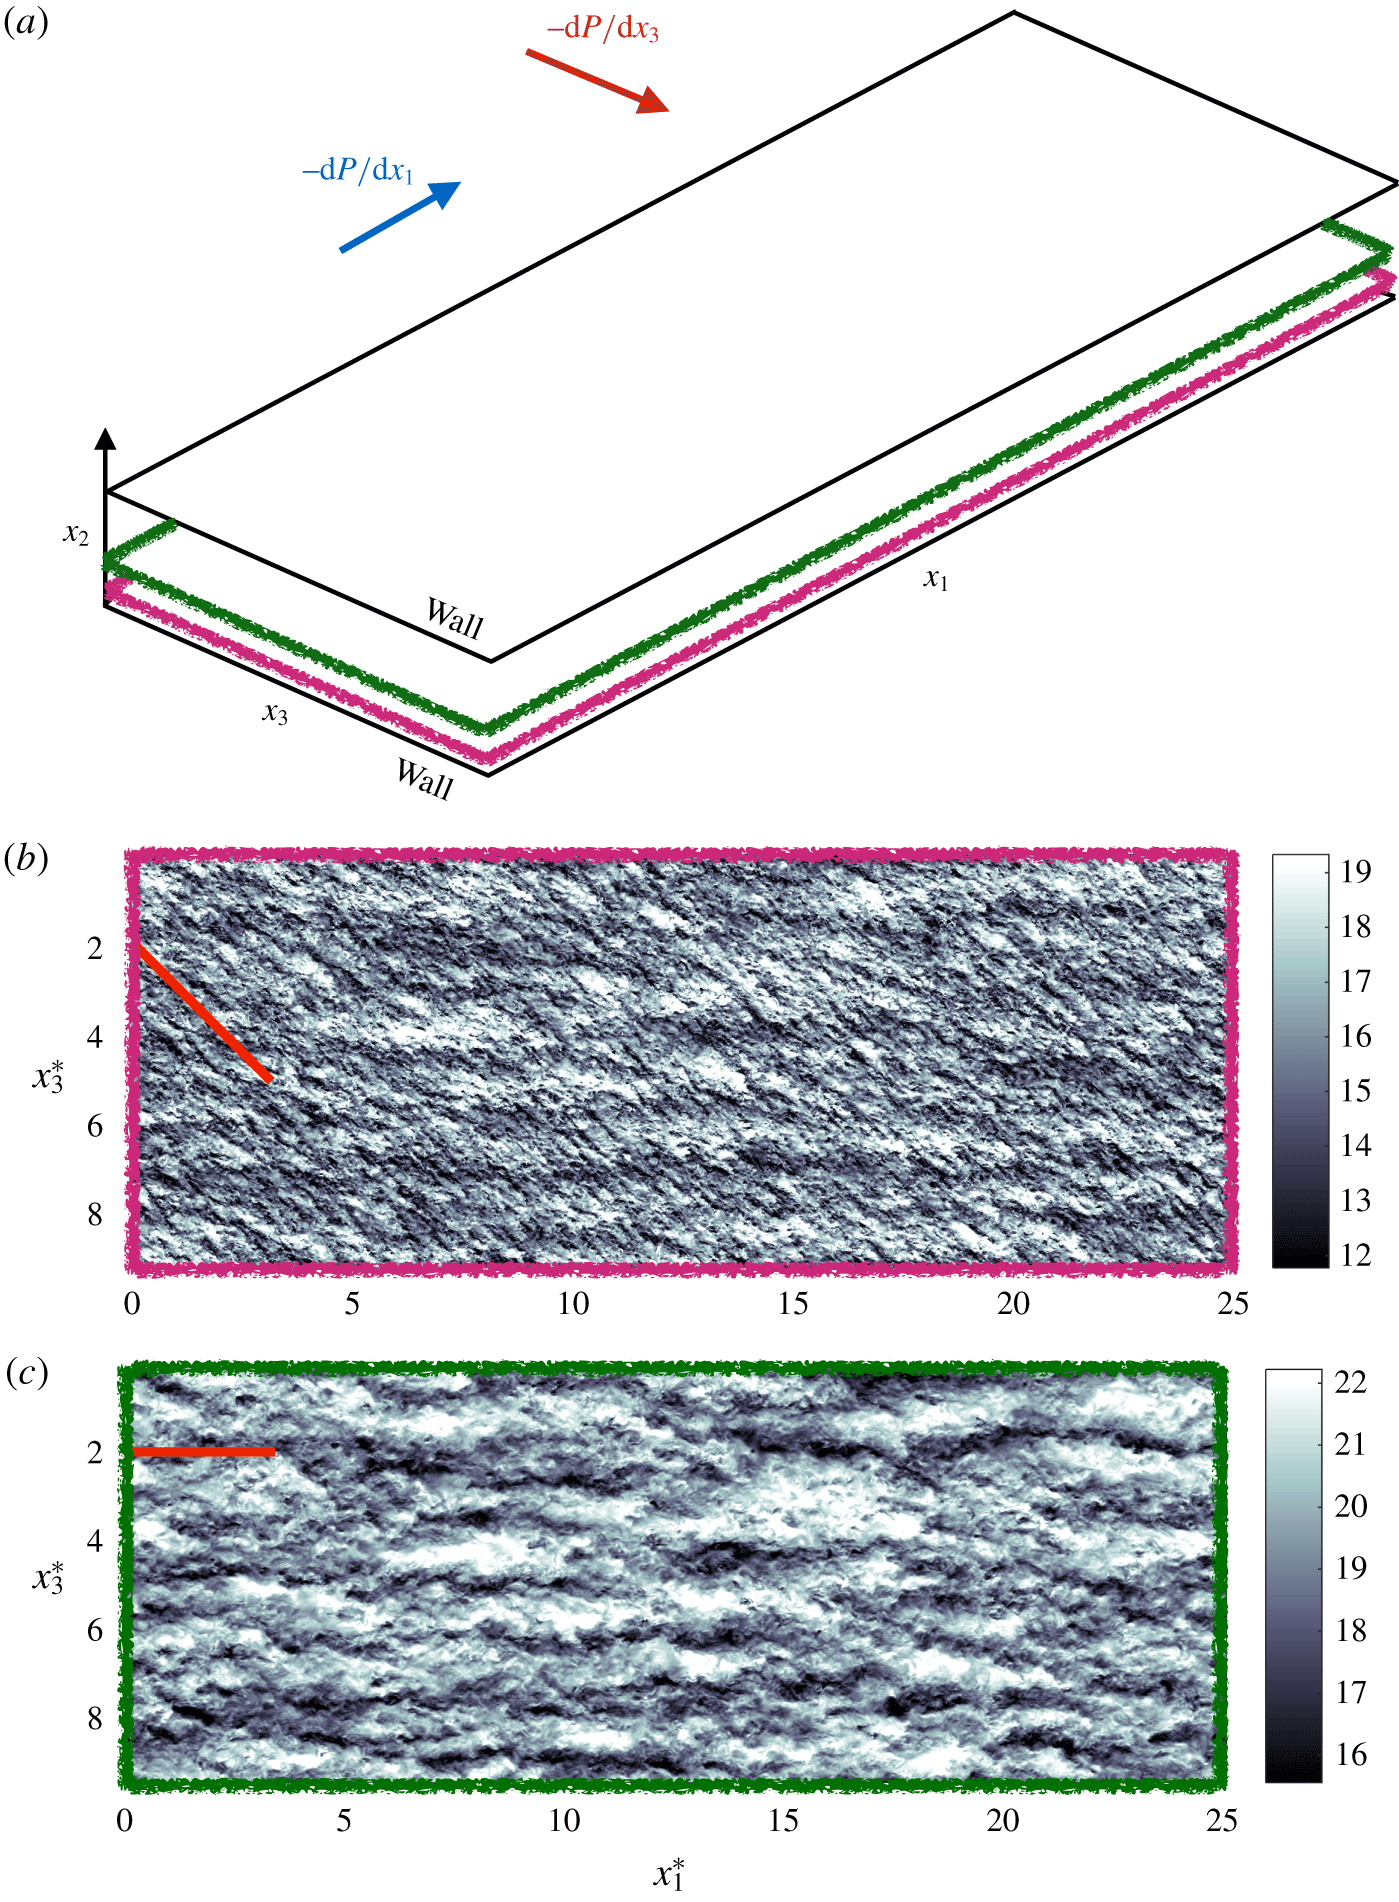
The message from figure 13 is that the main structural alteration during the transient is the weakening of the low-velocity streaks, which is in turn associated with the loss of coherence of the flow within a growing layer underneath the streamwise rolls. The aforementioned loss of coherence may be attributed to (i) the relative displacement of wall-parallel layers at different heights and (ii) the additional mean spanwise shear which enhances the generation of smaller-scale momentum-carrying eddies (as shown by Mizuno & Jiménez (Reference Mizuno and Jiménez2011), Jiménez (Reference Jiménez2018) and Lozano-Durán & Bae (Reference Lozano-Durán and Bae2019)). This is illustrated in figure 13, which contains the instantaneous streamwise velocity at two wall-normal distances: one closer to the wall at  $x_{2}^{\ast }=0.1$ influenced by the additional shear from the lateral boundary layer, and another farther from the wall at
 $x_{2}^{\ast }=0.3$ still unaffected.
(a) Schematic of the channel flow domain with the wall-normal planes shown in panels (b) and (c). Panels (b) and (c) contain the streamwise velocity at (b)  $x_{2}^{\ast }=0.1$ and (c)
 $x_{2}^{\ast }=0.3$ at the same time instant
 $t^{\ast }=0.5$ for
 $\unicode[STIX]{x1D6F1}=60$ at
 $Re_{\unicode[STIX]{x1D70F}}\approx 1000$. The red straight lines in (b) and (c) indicate the mean flow direction. Velocities are normalised by
 $u_{\unicode[STIX]{x1D70F}}$.

3.5 Structural model
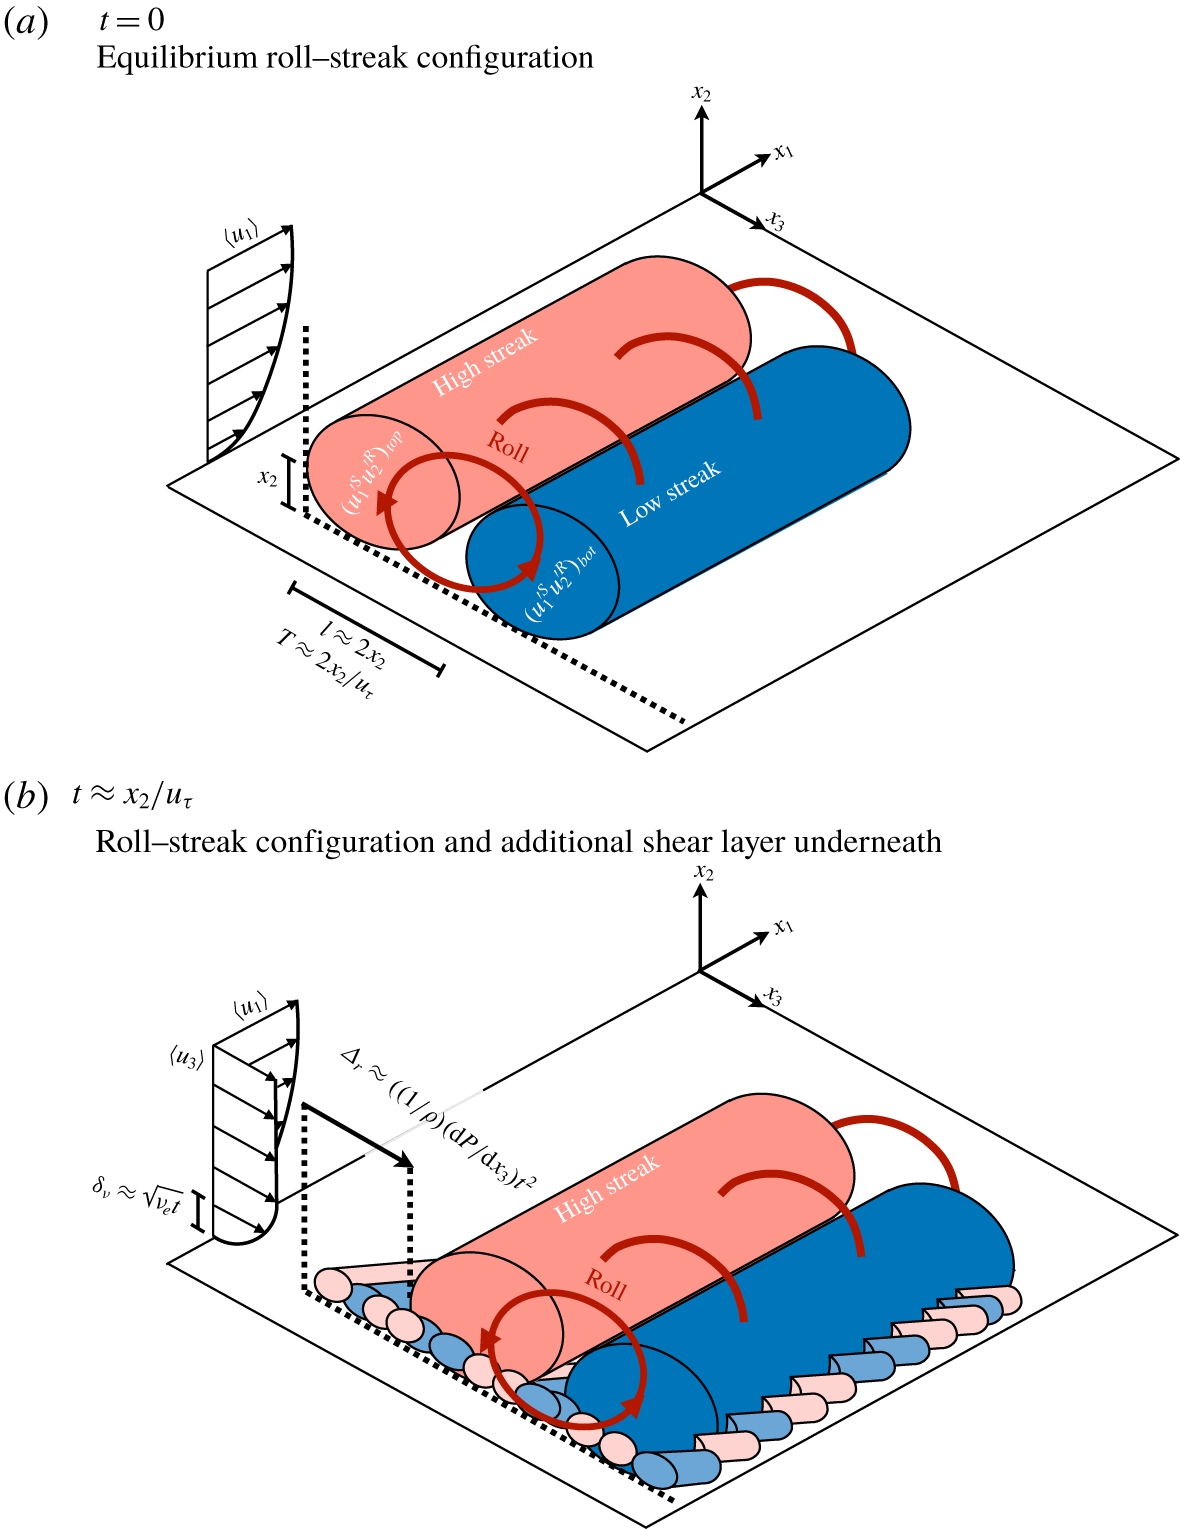
On the basis of the above observations, we propose a conceptual model that accounts for the changes undergone by the flow. The model is sketched in figure 14. The key elements are the low- and high-velocity streaks and their relative alignment with respect to the streamwise roll. Although the flow can be conceptually divided into streaks and rolls, both are interdependent flow entities that interact in a self-sustaining cycle (Waleffe Reference Waleffe1997; Jiménez & Pinelli Reference Jiménez and Pinelli1999; Hwang & Cossu Reference Hwang and Cossu2011; Cossu & Hwang Reference Cossu and Hwang2017; Lozano-Durán, Bae & Encinar Reference Lozano-Durán, Bae and Encinar2020). At a given wall-normal distance  $x_{2}$ and
 $t=0$, the flow is configured in an equilibrium array of rolls and streaks with their centres at
 $x_{2}$, sizes
 $2x_{2}$ and lifetimes
 $2x_{2}/u_{\unicode[STIX]{x1D70F}}$ (Lozano-Durán & Jiménez Reference Lozano-Durán and Jiménez2014b). The tangential Reynolds stress
 $\langle u_{1}^{\prime }u_{2}^{\prime }\rangle$ at
 $x_{2}$ is the result of the wall-normal momentum transport conducted by the rolls and the arrangement of streaks in the equilibrium state. The momentum transfer at
 $t=0$ can be modelled as the sum of two contributions,
 $$\begin{eqnarray}\displaystyle \langle u_{1}^{\prime }u_{2}^{\prime }\rangle (x_{2},t=0)^{model} & {\approx} & \displaystyle (u_{1}^{\prime S}u_{2}^{\prime R})_{top}+(u_{1}^{\prime S}u_{2}^{\prime R})_{bot}\end{eqnarray}$$
 $$\begin{eqnarray}\displaystyle & {\approx} & \displaystyle (u_{\unicode[STIX]{x1D70F}})(-u_{\unicode[STIX]{x1D70F}}/2)+(-u_{\unicode[STIX]{x1D70F}})(u_{\unicode[STIX]{x1D70F}}/2)\approx -u_{\unicode[STIX]{x1D70F}}^{2},\end{eqnarray}$$
where  $(u_{1}^{\prime S}u_{2}^{\prime R})_{top}$ represents the wall-normal transport of the high-velocity streak,
 $u_{1}^{\prime S}\approx u_{\unicode[STIX]{x1D70F}}$, by the downward motion of the roll,
 $u_{2}^{\prime R}\approx -u_{\unicode[STIX]{x1D70F}}/2$, above
 $x_{2}$. Conversely,
 $(u_{1}^{\prime S}u_{2}^{\prime R})_{bot}$ is the wall-normal transport of the low-velocity streak,
 $u_{1}^{\prime R}\approx -u_{\unicode[STIX]{x1D70F}}/2$, by the upward motion of the roll,
 $u_{2}^{\prime R}\approx u_{\unicode[STIX]{x1D70F}}$, below
 $x_{2}$. The intensities of
 $u_{1}^{\prime S}$ and
 $u_{2}^{\prime R}$ are adjusted to produce a total momentum transfer equal to
 $-u_{\unicode[STIX]{x1D70F}}^{2}$, although the discussion is extensive to other values.
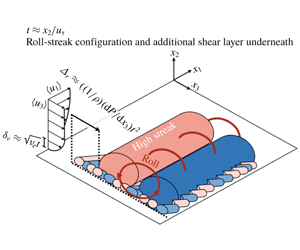
Structural model of self-similar wall-attached eddies subjected to a sudden mean spanwise pressure gradient. The figure shows one building block structure that comprises a streamwise roll flanked by one low-velocity streak and one high-velocity streak. Note that the complete flow field consists of the superposition of multiple building block structures of different sizes. (a) Statistically-in-equilibrium wall-attached momentum-carrying eddies of size  $2x_{2}$ at
 $t=0$ generating a momentum transfer
 ${\approx}-u_{\unicode[STIX]{x1D70F}}^{2}$. (b) Non-equilibrium wall-attached momentum-carrying eddies at
 $t=x_{2}/u_{\unicode[STIX]{x1D70F}}$ after the imposition of a transverse mean pressure gradient generating a momentum transfer
 ${\approx}-u_{\unicode[STIX]{x1D70F}}^{2}/2(1+\unicode[STIX]{x1D706})$. In panel (a),
 $(u_{1}^{\prime S}u_{2}^{\prime R})_{top}$ and
 $(u_{1}^{\prime S}u_{2}^{\prime R})_{bot}$ represent the downward and upward, respectively, wall-normal momentum transfer by the streamwise roll. In panel (b),
 $\unicode[STIX]{x1D6FF}_{\unicode[STIX]{x1D708}}$ is the spanwise boundary layer thickness and
 $\unicode[STIX]{x1D6E5}_{r}$ is the lateral displacement of the flow above
 $\unicode[STIX]{x1D6FF}_{\unicode[STIX]{x1D708}}$ due to the uniform acceleration
 $(1/\unicode[STIX]{x1D70C})\,\text{d}P/\text{d}x_{3}$ imposed by the mean spanwise pressure gradient. The smaller-scale low- and high-velocity streaks underneath the larger roll in panel (b) represent the incoherent fluid motions discussed in § 3.4 (figure 12b,c) and visualised in figure 13(b). At
 $t=0$, the flow also contains smaller streamwise streaks underneath the larger roll; although in this case they are aligned with the
 $x_{1}$ direction. However, smaller streaks are not represented in panel (a), as they do not contribute to the destruction of the near-wall coherence of the rolls above (figure 12a).

At half the lifespan of the eddies  $t\approx x_{2}/u_{\unicode[STIX]{x1D70F}}$, the spanwise boundary layer extends up to
 $\unicode[STIX]{x1D6FF}_{\unicode[STIX]{x1D708}}\approx 0.445x_{2}$, based on the estimations in § 3.1, and remains below the centre of the rolls located at
 $x_{2}$. Simultaneously, the upper flow is laterally displaced by
 $\unicode[STIX]{x1D6E5}_{r}\approx (1/\unicode[STIX]{x1D70C})(\text{d}P/\text{d}x_{3})(x_{2}/u_{\unicode[STIX]{x1D70F}})^{2}$. For values of
 $\unicode[STIX]{x1D6E5}_{r}$ larger than the spanwise coherence of the roll–streak structure, namely
 $\unicode[STIX]{x1D6E5}_{r}>2x_{2}$, the centre of the rolls is misaligned with the underneath streaks within the lateral boundary layer. The latter streaks are also altered by
 $\unicode[STIX]{x2202}\langle u_{3}\rangle /\unicode[STIX]{x2202}x_{2}$, which increases the local Reynolds number and triggers the emergence of smaller scales (as discussed in § 3.4, figure 13). These changes originate a new flow configuration that is less efficient in producing
 $-\langle u_{1}^{\prime }u_{2}^{\prime }\rangle$ compared to the equilibrium state. The rationale behind such a reduction is a loss of flow coherence underneath the rolls, as supported by figure 12, which weakens the vertical momentum transported by the rolls from the layers closer to the wall. The new momentum transfer at
 $t\approx x_{2}/u_{\unicode[STIX]{x1D70F}}$ can be modelled similarly to (3.10) by assuming that
 $(u_{1}^{\prime S}u_{2}^{\prime R})_{top}$ is barely affected, whereas
 $(u_{1}^{\prime S}u_{2}^{\prime R})_{bot}$ provides a deficient momentum transfer such that
 $$\begin{eqnarray}\displaystyle \langle u_{1}^{\prime }u_{2}^{\prime }\rangle (x_{2},t=x_{2}/u_{\unicode[STIX]{x1D70F}})^{model} & {\approx} & \displaystyle (u_{1}^{\prime S}u_{2}^{\prime R})_{top}+(u_{1}^{\prime S}u_{2}^{\prime R})_{bot}\end{eqnarray}$$
 $$\begin{eqnarray}\displaystyle & {\approx} & \displaystyle (u_{\unicode[STIX]{x1D70F}})(-u_{\unicode[STIX]{x1D70F}}/2)+(-u_{\unicode[STIX]{x1D70F}}\unicode[STIX]{x1D706})(u_{\unicode[STIX]{x1D70F}}/2)\approx -\frac{u_{\unicode[STIX]{x1D70F}}^{2}}{2}(1+\unicode[STIX]{x1D706}),\qquad\end{eqnarray}$$
where  $\unicode[STIX]{x1D706}$ is a damping factor accounting for the reduction in the Reynolds stress generation due to the loss of streak coherence within the lateral boundary layer. The functional form of
 $\unicode[STIX]{x1D706}$ is modelled by assuming that the loss of streak coherence is, in first-order approximation, linearly proportional to the relative spanwise mean shear,
 $$\begin{eqnarray}\unicode[STIX]{x1D706}=1-\frac{\unicode[STIX]{x2202}\langle u_{3}\rangle /\unicode[STIX]{x2202}x_{2}}{\unicode[STIX]{x2202}\langle u_{1}\rangle /\unicode[STIX]{x2202}x_{2}},\end{eqnarray}$$
such that  $\langle u_{1}^{\prime }u_{2}^{\prime }\rangle =-u_{\unicode[STIX]{x1D70F}}^{2}$ for
 $\unicode[STIX]{x2202}\langle u_{3}\rangle /\unicode[STIX]{x2202}x_{2}=0$. If we consider the approximations
 $\unicode[STIX]{x2202}\langle u_{3}\rangle /\unicode[STIX]{x2202}x_{2}\approx (\text{d}P/\text{d}x_{3})/(\unicode[STIX]{x1D70C}u_{\unicode[STIX]{x1D70F}})$ and
 $\unicode[STIX]{x2202}\langle u_{1}\rangle /\unicode[STIX]{x2202}x_{2}\approx u_{\unicode[STIX]{x1D70F}}/(2x_{2})$ (see § 3.1), then
 $$\begin{eqnarray}\langle u_{1}^{\prime }u_{2}^{\prime }\rangle (x_{2},t=x_{2}/u_{\unicode[STIX]{x1D70F}})^{model}\approx -u_{\unicode[STIX]{x1D70F}}^{2}\left(1-\frac{x_{2}\,\text{d}P/\text{d}x_{3}}{\unicode[STIX]{x1D70C}u_{\unicode[STIX]{x1D70F}}^{2}}\right).\end{eqnarray}$$
Equation (3.14) can be rearranged as  $\min _{t}\{D_{\unicode[STIX]{x1D70F}}^{model}\}\approx -\unicode[STIX]{x1D6F1}x_{2}^{\ast }$, which coincides with the maximum Reynolds stress depletion from (3.3).
Additionally, the model above predicts that the condition for non-equilibrium of flow structures at height  $x_{2}$ is given by
 $\unicode[STIX]{x1D6E5}_{r}>2x_{2}$, which in non-dimensional form yields
 $\unicode[STIX]{x1D6F1}x_{2}^{\ast }>2$. In order to disturb the wall-parallel layers at all heights across the boundary layer,
 $x_{2}^{\ast }$ should be fixed in wall units and such that
 $\unicode[STIX]{x1D6F1}>O(Re_{\unicode[STIX]{x1D70F}})$, also consistent with the estimation of
 $\unicode[STIX]{x1D6F1}>0.03Re_{\unicode[STIX]{x1D70F}}$ provided in § 3.2.
The scenario promoted above is self-similar: the continuous depletion in time of the Reynolds stress in figure 5(b) is the result of the time-ordered disruption of streaks and rolls from their natural equilibrium by the growth of the spanwise boundary layer. The present model complements and generalises previous studies formulated in terms of single-scale near-wall streaks and quasi-streamwise vortices to the analogous log-layer streaks and rolls of arbitrary size  $x_{2}$. The mechanism above also shares some similarities with the physical arguments pertaining to the modification of near-wall turbulence in the presence of oscillating walls characteristic of drag reduction studies (Jung et al. Reference Jung, Mangiavacchi and Akhavan1992; Laadhari, Skandaji & Morel Reference Laadhari, Skandaji and Morel1994; Choi & Clayton Reference Choi and Clayton2001; Choi, Xu & Sung Reference Choi, Xu and Sung2002; Ricco & Quadrio Reference Ricco and Quadrio2008), although our model is tailored for multiscale flows and uniform accelerations.
It is worth noting that the reduction of the Reynolds stress has been mainly modelled on the basis of non-equilibrium effects rather than on the three-dimensionality of the mean flow and, therefore, is not constrained to the application of additional mean pressure gradients only in the spanwise direction. Accordingly, the model also predicts that a sudden forcing in the streamwise direction would encompass a decrease of the Reynolds stress as long as the relative shift between wall-parallel layers is capable of misaligning the cores of the roll and the streaks underneath. As it is well known that streaks are longer than wider across the logarithmic layer by a factor of 3–6, we can anticipate that suddenly imposed streamwise mean pressure gradients are less efficient in decreasing the Reynolds stress than their spanwise counterparts. This view is supported by the studies by He & Seddighi (Reference He and Seddighi2013, Reference He and Seddighi2015), Seddighi et al. (Reference Seddighi, He, Pokrajac, ODonoghue and Vardy2015) and Mathur et al. (Reference Mathur, Gorji, He, Seddighi, Vardy, ODonoghue and Pokrajac2018), who showed that channel flows subjected to streamwise mean pressure gradients exhibit a similar, but less exacerbated, counter-intuitive response of flow consistent with the model presented here.
To conclude, we comment on the similarities and differences of the present structural model with respect to previous models in the literature. We should stress first that our model relies on the multiscale organisation of the flow, while past models are usually formulated under the assumption of a single-scale flow at low Reynolds number. From figure 13, it was argued that the flow structures produced under the additional mean shear are smaller in size, and that this contributes to the loss of coherence from the viewpoint of the upper flow layers. The generation of smaller eddies is supported by the work of Lozano-Durán & Bae (Reference Lozano-Durán and Bae2019), who showed that the characteristic length scale of the flow structures decreases proportionally to the mean shear. Our model is also consistent with the generation of smaller flow features postulated by Lohmann (Reference Lohmann1976) and corroborated experimentally by Kiesow & Plesniak (Reference Kiesow and Plesniak2002) for the near-wall region. Bradshaw & Pontikos (Reference Bradshaw and Pontikos1985) suggested that the mechanism responsible for the reduction in the Reynolds stress is the tilting about the streamwise direction of pre-existing flow structures caused by the ‘instant’ introduction of  $\unicode[STIX]{x2202}\langle u_{3}\rangle /\unicode[STIX]{x2202}x_{2}$ by inviscid skewing. In the present flow configuration,
 $\unicode[STIX]{x2202}\langle u_{3}\rangle /\unicode[STIX]{x2202}x_{2}$ diffuses upwards from the wall in a finite time. Yet, the aforementioned tilting mechanism is not completely incompatible with the model depicted in figure 14, as the relative displacement between wall-parallel flow layers still entails some degree of inclination of the eddies in the
 $x_{1}$–
 $x_{2}$ plane. Coleman et al. (Reference Coleman, Kim and Spalart1996b) noted that the toppling of eddies dominates when the three-dimensionality is introduced by inviscid skewing, but its role might be secondary in cases with uniform lateral acceleration as in the present study. Comparisons with previous models framed in terms of the evolution of streaks, ejections and sweeps are complicated due to the lack of interaction between flow structures at different scales. Eaton (Reference Eaton1991) and Kannepalli & Piomelli (Reference Kannepalli and Piomelli2000) hypothesised that the cross-flow could inhibit the intensity of the low-velocity streaks and, consequently, the associated Reynolds stress from the streak breakdown. Other works advocate for an asymmetric distribution of sweeps and ejections as a key requirement for the Reynolds stress reduction (Anderson & Eaton Reference Anderson and Eaton1989; Sendstad Reference Sendstad1992; Littell & Eaton Reference Littell and Eaton1994; Eaton Reference Eaton1995; Chiang & Eaton Reference Chiang and Eaton1996; Wu & Squires Reference Wu and Squires1997). Although the weakening of the streaks and the asymmetry of sweeps and ejections are not necessarily incompatible with our model, they are not essential components to attain a Reynolds stress reduction.
3.6 Evolution of the tangential Reynolds stress budget
We examine the reduction of  $-\langle u_{1}^{\prime }u_{2}^{\prime }\rangle$ from the Reynolds stress budget viewpoint to complement the physical insight gained from the structural analysis in § 3.4. We use the static frame of reference
 ${\mathcal{F}}$ to avoid the complexity of additional terms of the form
 $\unicode[STIX]{x2202}/\unicode[STIX]{x2202}t$ in the budget equation. Following Mansour, Kim & Moin (Reference Mansour, Kim and Moin1988), the dynamic equation for the component
 $\langle u_{i}^{\prime }u_{j}^{\prime }\rangle$ is given by
 $$\begin{eqnarray}\frac{{\mathcal{D}}\langle u_{i}^{\prime }u_{j}^{\prime }\rangle }{{\mathcal{D}}t}=P_{ij}+\unicode[STIX]{x1D700}_{ij}+T_{ij}+PS_{ij}+PD_{ij}+V_{ij},\end{eqnarray}$$
where the terms on the right-hand side are the Reynolds stress production ( $P_{ij}$), dissipation (
 $\unicode[STIX]{x1D700}_{ij}$), turbulent diffusion (
 $T_{ij}$), pressure strain (
 $PS_{ij}$), pressure diffusion (
 $PD_{ij}$) and viscous diffusion (
 $V_{ij}$) defined as
 $$\begin{eqnarray}\displaystyle \displaystyle P_{ij} & = & \displaystyle -\langle u_{i}^{\prime }u_{k}^{\prime }\rangle \left\langle \frac{\unicode[STIX]{x2202}u_{j}}{\unicode[STIX]{x2202}x_{k}}\right\rangle -\langle u_{j}^{\prime }u_{k}^{\prime }\rangle \left\langle \frac{\unicode[STIX]{x2202}u_{i}}{\unicode[STIX]{x2202}x_{k}}\right\rangle ,\end{eqnarray}$$
 $$\begin{eqnarray}\displaystyle \displaystyle \unicode[STIX]{x1D700}_{ij} & = & \displaystyle -2\unicode[STIX]{x1D708}\left\langle \frac{\unicode[STIX]{x2202}u_{i}^{\prime }}{\unicode[STIX]{x2202}x_{k}}\frac{\unicode[STIX]{x2202}u_{j}^{\prime }}{\unicode[STIX]{x2202}x_{k}}\right\rangle ,\end{eqnarray}$$
 $$\begin{eqnarray}\displaystyle \displaystyle T_{ij} & = & \displaystyle -\left\langle \frac{\unicode[STIX]{x2202}u_{i}^{\prime }u_{j}^{\prime }u_{k}^{\prime }}{\unicode[STIX]{x2202}x_{k}}\right\rangle ,\end{eqnarray}$$
 $$\begin{eqnarray}\displaystyle \displaystyle PS_{ij} & = & \displaystyle -\left\langle u_{i}^{\prime }\frac{\unicode[STIX]{x2202}p^{\prime }}{\unicode[STIX]{x2202}x_{j}}+u_{j}^{\prime }\frac{\unicode[STIX]{x2202}p^{\prime }}{\unicode[STIX]{x2202}x_{i}}\right\rangle ,\end{eqnarray}$$
 $$\begin{eqnarray}\displaystyle \displaystyle PD_{ij} & = & \displaystyle -\frac{\unicode[STIX]{x2202}}{\unicode[STIX]{x2202}x_{k}}\left\langle p^{\prime }u_{i}^{\prime }\unicode[STIX]{x1D6FF}_{jk}+p^{\prime }u_{j}^{\prime }\unicode[STIX]{x1D6FF}_{ik}\right\rangle ,\end{eqnarray}$$
 $$\begin{eqnarray}\displaystyle \displaystyle V_{ij} & = & \displaystyle \left\langle \frac{\unicode[STIX]{x2202}^{2}u_{i}^{\prime }u_{j}^{\prime }}{\unicode[STIX]{x2202}x_{k}\unicode[STIX]{x2202}x_{k}}\right\rangle .\end{eqnarray}$$
In order to obtain quantities that are only a function of time, we introduce the average along  $x_{2}$ bands, which is indicated by
 $\overline{(\cdot )}$. The wall-normal bands inspected are
 $x_{2}^{+}\in [5,50]$ and
 $x_{2}^{\ast }\in [0.2,0.3]$, which lie within the buffer region and logarithmic layer, respectively. The gains produced by the budget components
 $\bar{\unicode[STIX]{x1D719}}_{ij}$ for
 $(i,j)=(1,2)$,
 $(1,1)$ and
 $(2,2)$ are defined as
 $$\begin{eqnarray}\displaystyle & \displaystyle \text{Gain}_{-12}=\frac{-\bar{\unicode[STIX]{x1D719}}_{12}(t)+\bar{\unicode[STIX]{x1D719}}_{12}(0)}{-\overline{P}_{12}(0)}, & \displaystyle\end{eqnarray}$$
 $$\begin{eqnarray}\displaystyle & \displaystyle \text{Gain}_{11}=\frac{\bar{\unicode[STIX]{x1D719}}_{11}(t)-\bar{\unicode[STIX]{x1D719}}_{11}(0)}{\overline{P}_{11}(0)}, & \displaystyle\end{eqnarray}$$
 $$\begin{eqnarray}\displaystyle & \displaystyle \text{Gain}_{22}=\frac{\bar{\unicode[STIX]{x1D719}}_{22}(t)-\bar{\unicode[STIX]{x1D719}}_{22}(0)}{\overline{PS}_{22}(0)}, & \displaystyle\end{eqnarray}$$
where  $\text{Gain}_{-12}$,
 $\text{Gain}_{11}$ and
 $\text{Gain}_{22}$ represent the gain in the Reynolds stress budget equation for
 $-\overline{\langle u_{1}^{\prime }u_{2}^{\prime }\rangle }$,
 $\overline{\langle u_{1}^{\prime }u_{1}^{\prime }\rangle }$ and
 $\overline{\langle u_{2}^{\prime }u_{2}^{\prime }\rangle }$, respectively. Note that
 $\text{Gain}_{-12}$ is defined such that
 $-\overline{P}_{12}>0$ contributes to increasing the magnitude of
 $-\overline{\langle u_{1}^{\prime }u_{2}^{\prime }\rangle }$. We analyse the channel flow at
 $Re_{\unicode[STIX]{x1D70F}}\approx 500$ and
 $\unicode[STIX]{x1D6F1}=60$, in which case the maximum drop in
 $-\overline{\langle u_{1}^{\prime }u_{2}^{\prime }\rangle }$ occurs at
 $t^{+}\approx 170$ and
 $t^{\ast }\approx 0.7$ for the bands in the buffer region and logarithmic layer, respectively.
Evolution of the gain produced by the different terms of the Reynolds stress budget for (a,b)  $-\overline{\langle u_{1}^{\prime }u_{2}^{\prime }\rangle }$, (c,d)
 $\overline{\langle u_{2}^{\prime }u_{2}^{\prime }\rangle }$ and (e,f)
 $\overline{\langle u_{1}^{\prime }u_{1}^{\prime }\rangle }$. Panels (a), (c) and (e) are for
 $x_{2}^{+}\in [5,50]$, and panels (b), (d) and (f) are for
 $x_{2}^{\ast }\in [0.2,0.3]$. The results are for
 $\unicode[STIX]{x1D6F1}=60$ at
 $Re_{\unicode[STIX]{x1D70F}}\approx 500$. Zero gain is represented by the horizontal dotted line.

The gains are reported in figure 15 as a function of time. We discuss first the results for the buffer layer region  $x_{2}^{+}\in [5,50]$. Figure 15(a) shows the evolution of
 $-\overline{P}_{12}$,
 $-\overline{T}_{12}$ and
 $-\overline{PS}_{12}$. The remaining terms are not significant in magnitude, nor do they play any relevant role in the discussion below, and so they are omitted for the sake of simplicity. The main contributor to the destruction of
 $-\overline{\langle u_{1}^{\prime }u_{2}^{\prime }\rangle }$ is the drop in production
 $-\overline{P}_{12}$, which can be traced back to a deficit on the pressure–strain correlation in the budget equation for
 $\overline{\langle u_{2}^{\prime }u_{2}^{\prime }\rangle }$ (figure 15c). Similarly, the decline of the streaks is the consequence of a lower production
 $\overline{P}_{11}$ (figure 15e), also caused by the drop in
 $-\overline{\langle u_{1}^{\prime }u_{2}^{\prime }\rangle }$.
The sequence of events is similar farther away from the wall, as seen in figure 15(b,d,f) for  $x_{2}^{\ast }\in [0.2,0.3]$. The main sink of tangential Reynolds stress arises from the turbulent production
 $-\overline{P}_{12}$. The reduction in
 $-\overline{P}_{12}$ is connected to the lower pressure–strain correlation
 $\overline{PS}_{22}$ in the budget equation of
 $\overline{\langle u_{2}^{\prime }u_{2}^{\prime }\rangle }$ akin to the situation described for the buffer region. The decay of the streaks is similarly governed by the drop in the production of streamwise Reynolds stress
 $\overline{P}_{11}$, with some additional contribution by the turbulent diffusion
 $\overline{T}_{11}$.
The process of Reynolds stress reduction is then sequentially described by (i) the growth of the spanwise boundary layer  $\unicode[STIX]{x2202}\langle u_{3}\rangle /\unicode[STIX]{x2202}x_{2}$, which (ii) inhibits the redistribution of energy to
 $\langle u_{2}^{\prime }u_{2}^{\prime }\rangle$ via pressure–strain correlation, followed by (iii) the weakening of the production of tangential Reynolds stress, which (iv) eventually causes the drop in
 $-\langle u_{1}^{\prime }u_{2}^{\prime }\rangle$. The terms involved at each step of the process are summarised in figure 16. A similar effect has been observed in transitional boundary layer flows subjected to spanwise wall oscillations (Hack & Zaki Reference Hack and Zaki2015). Our findings are consistent with the previous theory on transversely strained boundary layer flows by Moin et al. (Reference Moin, Shih, Driver and Mansour1990) and Coleman et al. (Reference Coleman, Kim and Le1996a) and extends the results to the outer layer of wall-bounded turbulence. The leading role of
 $\unicode[STIX]{x2202}\langle u_{3}\rangle /\unicode[STIX]{x2202}x_{2}$ in the drop of
 $-\langle u_{1}^{\prime }u_{2}^{\prime }\rangle$ is also consistent with the structural model promoted in § 3.4, where it was argued that the deficient transport of momentum by the streamwise rolls has its origin in the displacement among fluid layers induced by
 $\unicode[STIX]{x2202}\langle u_{3}\rangle /\unicode[STIX]{x2202}x_{2}$.
Summary of the sequential process of Reynolds stress reduction from the sudden imposition of a spanwise pressure gradient up to the final decrease in tangential Reynolds stress. Time goes from left to right. See text for details.

4 Applications to wall-modelled large-eddy simulations
We study the predictive capabilities of WMLES in non-equilibrium 3-D channel flows at  $Re_{\unicode[STIX]{x1D70F}}\approx 1000$. As discussed in previous sections, this relatively simple flow set-up entails fundamental features of 3DTBL that may challenge the available model formulations. The rapid temporal and wall-normal variations in the strain and vorticity, as illustrated in figure 17, have the potential of rendering turbulence closure models calibrated to equilibrium turbulence of limited utility. Additionally, the accurate prediction of the wall-shear angle and Reynolds stress magnitude is also of paramount importance in external flows over wings or bluff bodies, as it can directly affect the force exerted on the bodies through modification of circulation, downwash effects, pressure redistribution and strength of separation.
(a) Sketch of a typical grid for WMLES of a turbulent boundary layer. The background colours represent the streamwise velocity from zero velocity (dark blue) to the free-stream value (dark red). (b) First grid cell of size  $\unicode[STIX]{x1D6E5}$ at the wall, and (c) comparison with the potential directional changes in the mean velocity profile along the wall-normal coordinate in 3DTBL.

Recent studies of WMLES in transient 3-D channel flows include the works by Bae et al. (Reference Bae, Lozano-Durán, Bose and Moin2018a), Carton de Wiart, Larsson & Murman (Reference Carton de Wiart, Larsson and Murman2018) and Yang et al. (Reference Yang, Willis and Hwang2019). Carton de Wiart et al. (Reference Carton de Wiart, Larsson and Murman2018) investigated the performance of WMLES in an ample set of cases including acceleration in the streamwise direction, and showed that WMLES is capable of predicting the wall stress with a reasonable degree of accuracy. Yang et al. (Reference Yang, Willis and Hwang2019) also attained good results using wall modelling via physics-informed neural networks, while Bae et al. (Reference Bae, Lozano-Durán, Bose and Moin2018a) employed a novel parameter-free dynamic wall model to predict the wall stress in a flow configuration similar to the present set-up.
4.1 Wall models
At the coarse near-wall grid resolutions of WMLES, the usual no-slip condition ceases to produce an accurate estimate of the momentum drain at the wall. Hence, wall models are responsible for estimating the wall-shear stress. The LES equations are integrated in time using the wall-shear stress provided by the wall model as a Neumann boundary condition instead of the no-slip condition. The kinematic no-penetration condition is maintained for the impermeable walls of the channel. Three wall models are investigated in the present work: the equilibrium wall model by Kawai & Larsson (Reference Kawai and Larsson2012), and the non-equilibrium wall models by Park & Moin (Reference Park and Moin2014) and Yang et al. (Reference Yang, Sadique, Mittal and Meneveau2015). We briefly summarise the main characteristics of each model and the modifications performed in the present work with respect to their original formulations.
The model by Yang et al. (Reference Yang, Sadique, Mittal and Meneveau2015) accounts for non-equilibrium effects while retaining a moderate complexity. This model assumes a parametric velocity profile in the near-wall region, where the coefficients are determined by enforcing a set of physical constraints. These include the continuity of the profile, the LES matching condition at a specified wall distance, and the compliance with the vertically integrated momentum equation, among others. The model is usually referred to as the integral wall model (IWM), since the momentum integral constraint is crucial in accounting for non-equilibrium effects. In the original formulation, the wall-model input is averaged in time to regularise the wall-shear stress, which otherwise was found to cause numerical instabilities. In the present study, given the statistically unsteady nature of the flow, the time averaging is replaced by spatial averaging along wall-parallel planes. To comply with the outer LES equations, we modify the original formulation by Yang et al. (Reference Yang, Sadique, Mittal and Meneveau2015) to account for the spanwise pressure forcing.
The non-equilibrium wall model by Park & Moin (Reference Park and Moin2014, Reference Park and Moin2016) solves the full Reynolds-averaged Navier–Stokes equations on a separate near-wall mesh with a mixing-length-type eddy-viscosity closure that dynamically accounts for the resolved portion of the turbulence in the wall-model domain. This formulation is the most comprehensive amongst the considered wall-stress models, and accounts for non-equilibrium effects embedded into the original Navier–Stokes equations. Herein, this model is termed NEQWM. In order to avoid an overprediction of the skin friction, the resolved turbulent stress is evaluated on the fly, and it is then subtracted from the modelled stress. Similarly to the IWM, the formulation by Park & Moin (Reference Park and Moin2014) was adjusted to account for the spanwise pressure forcing. This turned out to be particularly important in order to provide the required dominant balance in the momentum conservation equation for the initial times of the transient.
Lastly, the equilibrium wall model (EQWM) of Kawai & Larsson (Reference Kawai and Larsson2012) is derived from the NEQWM by retaining only the wall-normal diffusion terms. The model involves a simple ordinary differential equation, which is solved along the wall-normal direction on each wall face (Wang & Moin Reference Wang and Moin2002). Consistent with the one-dimensional nature of the model, the spanwise mean pressure gradient vector was projected to the local flow direction at the matching location, and this was added to the EQWM equation as a momentum source term. A similar term was added to the energy equation for consistency.
4.2 Numerical set-up
The codes used for wall-modelled calculations are different from the solver presented for DNS, mainly because the wall models were conveniently available in other well-validated LES codes. The calculations using the NEQWM and EQWM are conducted using the code CharLES, which is an unstructured-grid finite-volume LES code for compressible flows developed at the Center for Turbulence Research and currently maintained by Cascade Technologies, Inc. The nominal spatial accuracy of the code is second order, but the reconstruction scheme upgrades to a fourth-order accuracy on uniform Cartesian grids (Herrmann Reference Herrmann2010; Khalighi et al. Reference Khalighi, Ham, Nichols, Lele and Moin2011). The dynamic Smagorinsky model (Moin et al. Reference Moin, Squires, Cabot and Lee1991; Lilly Reference Lilly1992) is used as subgrid-scale (SGS) model in the filtered conservation equations. The bulk Mach number is fixed at 0.2 for comparison with the incompressible DNS solution.
For the IWM, we use the LESGO solver (LESGO 2019). The code solves the incompressible filtered Navier–Stokes equations in a half-channel with a staggered grid, using a pseudo-spectral approach in the wall-parallel directions and a second-order central finite-difference scheme in the wall-normal direction. The scale-dependent Lagrangian-dynamic Smagorinsky model is used as SGS model (Bou-Zeid, Meneveau & Parlange Reference Bou-Zeid, Meneveau and Parlange2005). One of the most important impediments of the wall models considered above is that they rely explicitly or implicitly on a Reynolds-averaged parametrisation of the flow, usually through an eddy viscosity, and their coefficients are adjusted by assuming fully developed turbulence that is statistically in equilibrium. By construction of these models, the imposition of additional mean shear is accompanied by an increment in the magnitude of the Reynolds stresses (see the reviews by Piomelli & Balaras (Reference Piomelli and Balaras2002) and Bose & Park (Reference Bose and Park2018)), which might not be case under non-equilibrium conditions.
The LES grid resolution is uniform in the three spatial directions and equal to  $(\unicode[STIX]{x1D6E5}_{1}^{+},\unicode[STIX]{x1D6E5}_{2}^{+},\unicode[STIX]{x1D6E5}_{3}^{+})=(180,60,133)$ or
 $(\unicode[STIX]{x1D6E5}_{1}^{\ast },\unicode[STIX]{x1D6E5}_{2}^{\ast },\unicode[STIX]{x1D6E5}_{3}^{\ast })=(0.2,0.06,0.14)$. The size of the computational domain is
 $(L_{1}^{\ast },L_{2}^{\ast },L_{3}^{\ast })=(8\unicode[STIX]{x03C0},2,3\unicode[STIX]{x03C0})$, which yields a total of 265 980 grid cells distributed as
 $(N_{1},N_{2},N_{3})=(130,31,66)$, in the streamwise, wall-normal and spanwise directions, respectively. The internal grids for EQWM and NEQWM have 30–40 cells stretched along the wall-normal direction. Additionally, the NEQWM shares the same wall-parallel resolution as the LES grid. The wall-normal exchange between the wall model and the LES is located at the centroids of the third grid cell away from the wall,
 $x_{2}^{\ast }\approx 0.16$.
The calculations are initialised with a 2-D channel flow in a statistically steady state at  $Re_{\unicode[STIX]{x1D70F}}\approx 1000$. Then, a spanwise pressure gradient of
 $\unicode[STIX]{x1D6F1}=10$ is applied to induce a cross-stream shear layer, as in § 2. The transverse mean pressure gradient selected is relatively low in order to mimic the fact that, at high Reynolds numbers, the near-wall layer is in a quasi-equilibrium state, as discussed in § 3.2. The simulations are run for one eddy turnover time based on the streamwise friction velocity and channel half-height,
 $t^{\ast }\approx 1$. The results are averaged in the homogeneous directions and among runs starting from 10 uncorrelated initial conditions.
4.3 Results and discussion
Figure 18 shows the evolution of the streamwise and spanwise mean wall-stress components denoted by  $\langle \unicode[STIX]{x1D70F}_{1}\rangle$ and
 $\langle \unicode[STIX]{x1D70F}_{3}\rangle$, respectively. We discuss first the predictions for
 $\langle \unicode[STIX]{x1D70F}_{3}\rangle$. A general observation from figure 18(a) is that the NEQWM produces a fairly accurate prediction of
 $\langle \unicode[STIX]{x1D70F}_{3}\rangle$ throughout the transient. For short times (
 $t^{\ast }<0.1$), the NEQWM predictions are closely followed by those from IWM, while the EQWM results in 50 % to 25 % underprediction of
 $\langle \unicode[STIX]{x1D70F}_{3}\rangle$ throughout the initial transient. The EQWM and the IWM still capture correctly the growth rate of
 $\langle \unicode[STIX]{x1D70F}_{3}\rangle$ for
 $t^{\ast }\gtrsim 0.1$. For
 $t^{\ast }\approx 1$, the errors by NEQWM and IWM are roughly 2 %, whereas the error for the EQWM is 10 %. As a reference, the laminar response of the flow is also included in figure 18(a), which shows that the spanwise wall stress agrees with the laminar solution for
 $t^{\ast }<0.1$.
Evolution of (a) the mean spanwise wall stress  $\langle \unicode[STIX]{x1D70F}_{3}\rangle$ and (b) the mean streamwise wall stress
 $\langle \unicode[STIX]{x1D70F}_{1}\rangle$ for WMLES and DNS. The stresses are normalised by the value of the initial 2-D streamwise wall stress
 $\langle \unicode[STIX]{x1D70F}_{1}\rangle _{,2D}$. The lines and symbols are:

 $\langle \unicode[STIX]{x1D70F}_{1}\rangle _{,2D}$, while those in panel (b) are only up to 15 %.

The evolution of  $\langle \unicode[STIX]{x1D70F}_{1}\rangle$ is plotted in figure 18(b). Note that the variations in
 $\langle \unicode[STIX]{x1D70F}_{1}\rangle$ are only up to 10 % and well below the changes undergone by
 $\langle \unicode[STIX]{x1D70F}_{3}\rangle$, which are up to 70 %. The EQWM and the IWM predict the wall stress throughout the transient within 5 % and 2 % error, respectively. The NEQWM predicts a relatively faster variation in
 $\langle \unicode[STIX]{x1D70F}_{1}\rangle$ for
 $t^{\ast }\lesssim 0.4$ compared to IWM and EQWM, with deviations from the DNS up to 7 %. In all cases, the errors decay as time advances. As expected, none of the wall models is able to reproduce the initial reduction in
 $\langle \unicode[STIX]{x1D70F}_{1}\rangle$ for
 $t^{\ast }\lesssim 0.4$. Such a decrease in the streamwise wall-stress component is the result of the complex flow dynamics discussed in § 3. The wall models investigated are based on the eddy-viscosity assumption; increasing shear rates in the flow result in additional strain rates. Hence, it comes as no surprise that WMLES consistently exhibits an approximately monotonic increase in
 $\langle \unicode[STIX]{x1D70F}_{1}\rangle$ after the sudden spanwise pressure gradient is applied due to the additional transverse straining of the flow in the near-wall region.
Evolution of the wall-shear angle, defined as  $\unicode[STIX]{x1D6FE}_{w}=\tan ^{-1}(\langle \unicode[STIX]{x1D70F}_{3}\rangle /\langle \unicode[STIX]{x1D70F}_{1}\rangle )$, is shown in figure 19(a). The performance of the wall models resembles the trends reported for
 $\langle \unicode[STIX]{x1D70F}_{3}\rangle$. This similarity is easily understood by noting that the relative time variations in
 $\langle \unicode[STIX]{x1D70F}_{1}\rangle$ are modest compared to the variations in
 $\langle \unicode[STIX]{x1D70F}_{3}\rangle$. The development of the mean spanwise velocity over one eddy turnover time is shown in figure 19(b). All the WMLES considered provide an excellent prediction of the boundary layer growth. The spanwise velocity profile develops its own logarithmic region for
 $t^{\ast }>0.6$, although the slope is substantially smaller than that of equilibrium channel flows. The agreement in the spanwise profile is observed in the turbulent flow region, where contributions from the SGS models and the wall models are expected to play a role in the mean spanwise momentum balance. These findings highlight the capability of current WMLES and SGS models to predict the mean spanwise velocity profile that arises in response to mild transverse pressure perturbations. Although not shown, the mean streamwise velocity undergoes only minor changes in time from its initial 2-D state, and good agreement is also found between DNS and WMLES.
(a) Evolution of the wall shear-stress angle,  $\unicode[STIX]{x1D6FE}_{w}=\text{tan}^{-1}(\langle \unicode[STIX]{x1D70F}_{3}\rangle /\langle \unicode[STIX]{x1D70F}_{1}\rangle )$. (b) Mean spanwise velocity at
 $t^{\ast }=0$, 0.21, 0.405, 0.615, 0.825 and 1.02 (from bottom to top). The lines and symbols are:

 $\langle u_{3}\rangle ^{+}=(1/0.41)\ln (x_{2}^{+})+5.2$.

In summary, our results show that the expected errors in WMLES under moderate non-equilibrium 3-D effects are reduced for increasing degree of modelling complexity. However, factors such as intricacy in model implementation or computational cost can favour the adoption of the simplest wall models for some flow configurations. Future efforts should be devoted to enhance the capabilities of wall models to accurately capture the flow physics in the presence of strong non-equilibrium effects.
5 Conclusions
In the present work, we have investigated the transient response of the tangential Reynolds stress in a turbulent boundary layer with 3-D mean velocity under non-equilibrium conditions. We have focused our analysis on the multiscale response of the self-similar momentum-carrying eddies in the flow, which is the scenario expected at the Reynolds numbers encountered in real-world applications.
We have performed a series of DNS of fully developed incompressible turbulent channel flow subjected to a sudden spanwise mean pressure gradient. A variety of spanwise-to-streamwise mean pressure ratios have been considered ranging from  $\unicode[STIX]{x1D6F1}=1$ to 100. The sudden imposition of the forcing is followed by a continuous change of the mean-flow magnitude and direction, in which 3-D non-equilibrium effects prevail. The present set-up is one of the simplest flows enabling the study of 3-D non-equilibrium wall turbulence, while maintaining homogeneity in the streamwise and spanwise directions. We have considered two moderately high Reynolds numbers, namely
 $Re_{\unicode[STIX]{x1D70F}}\approx 500$ and
 $Re_{\unicode[STIX]{x1D70F}}\approx 1000$, to uncover the scaling properties of realistic 3DTBL.
Non-equilibrium effects are observed both in the original frame of reference as well as in the time- and wall-normal-dependent frame of reference aligned with the mean shear. The non-equilibrium response of the flow is controlled by the two non-dimensional parameters of the problem, namely  $Re_{\unicode[STIX]{x1D70F}}$ and
 $\unicode[STIX]{x1D6F1}$. By assuming that wall turbulence can be comprehended as a multiscale collection of wall-attached momentum-carrying eddies with sizes and lifetimes proportional to
 $x_{2}$ and
 $x_{2}/u_{\unicode[STIX]{x1D70F}}$, respectively, we have established that the maximum depletion of the tangential Reynolds stress is proportional to
 $\unicode[STIX]{x1D6F1}x_{2}^{\ast }$. Therefore, larger eddies are more prone to experience non-equilibrium effects than the smaller eddies closer to the wall. Accordingly, the flow can be classified into three distinctive flow regimes. For
 $\unicode[STIX]{x1D6F1}<O(1)$, the sudden spanwise pressure gradient is too modest to alter the statistical equilibrium of the momentum carrying eddies. Conversely, for
 $\unicode[STIX]{x1D6F1}>0.03Re_{\unicode[STIX]{x1D70F}}$, the imposed mean spanwise pressure gradient is strong enough to leave out-of-equilibrium eddies at all the scales across the boundary layer, i.e. from the smallest buffer-layer eddies up to the very large-scale motions populating the outer region. For
 $O(1)<\unicode[STIX]{x1D6F1}<0.03Re_{\unicode[STIX]{x1D70F}}$, the boundary layer attains an intermediate state in which eddies closer to the wall evolve in quasi-equilibrium, whereas eddies further from the wall are influenced by the non-equilibrium effects.
We have examined the history of the tangential Reynolds stress for cases in the fully non-equilibrium regime. The momentum-carrying eddies undergo an ordered response in time: first, the smallest eddies (closer to the wall) reduced their Reynolds stress contribution, followed by the larger eddies (farther from the wall), and so forth. During the initial transient, the results collapse across several wall-normal distances and Reynolds numbers when the Reynolds stress drop and time are scaled by  $\unicode[STIX]{x1D6F1}x_{2}^{\ast }$ and
 $x_{2}/u_{\unicode[STIX]{x1D70F}}$, respectively, consistent with the multiscale population of eddies discussed above. The collapse is further improved for longer times by noting that the characteristic equilibrium velocity and time scales (
 $u_{\unicode[STIX]{x1D70F}}$ and
 $x_{2}/u_{\unicode[STIX]{x1D70F}}$, respectively) are no longer representative of eddies in a non-equilibrium state, which are instead controlled by the local-in-time scales
 $u_{\unicode[STIX]{x1D70F}}^{\star }(t)$ and
 $x_{2}/u_{\unicode[STIX]{x1D70F}}^{\star }(t)$. Our results unveil for the first time the self-similar response of non-equilibrium 3DTBL at moderately high Reynolds numbers and provide the appropriate scaling framework for future flow comparisons.
We have proposed a structural model for non-equilibrium 3DTBL rooted in the insight obtained from the physical analysis of the flow. The model comprises streamwise rolls and streaks at different scales, which are initially in statistical equilibrium. The imposition of the mean spanwise pressure gradient results in the misalignment between the core of rolls and the flow underneath, which leads to a less efficient configuration of the Reynolds stress production. The formulation of the model is consistent with the self-similar nature of the eddy response, and describes in a comprehensive manner the findings reported above. The scenario promoted here is supported by DNS results of the averaged velocity field conditioned to regions of intense Reynolds stress, which corroborate the loss of coherence of the layer underneath the core of the rolls. The new structural representation of the flow entails a quantitative advance of the previous theories on transversely strained boundary layers by providing specific scaling laws for the time scale and magnitude reduction of the Reynolds stress at multiple scales. The model also offers a theoretical ground for the different regimes observed in the flow from the quasi-equilibrium state to the fully non-equilibrium response. Inspection of the Reynolds stress budget reveals that the effect of pressure–strain correlation is key in the reduction of Reynolds stress within the additional spanwise shear layer, and that this is the case for all wall-normal heights.
Finally, the predictive capabilities of three state-of-the-art LES wall-modelling techniques have been assessed for 3-D channel flows at  $Re_{\unicode[STIX]{x1D70F}}\approx 1000$ and
 $\unicode[STIX]{x1D6F1}=10$. The models investigated are the equilibrium wall model by Kawai & Larsson (Reference Kawai and Larsson2012) (EQWM), and the non-equilibrium wall models by Park & Moin (Reference Park and Moin2014) (NEQWM) and Yang et al. (Reference Yang, Sadique, Mittal and Meneveau2015) (IWM). As expected, wall models with a higher degree of complexity yield more accurate predictions of the mean wall shear, although the overall performance of the three models is similar. For short times, the NEQWM yields the best prediction of the magnitude of the spanwise wall shear and the angle of the mean wall-stress vector. The predictions by IWM and EQWM follow in accuracy those by NEQWM. The larger deviations between wall models are obtained during the early times of the transient (
 $t^{\ast }<0.1$), while the three models are in relatively good agreement with the DNS results for longer times (
 $t^{\ast }>1$). None of the wall models considered is able to account for the initial reduction of the Reynolds shear stress and drag, presumably due to their eddy-viscosity formulations. We have argued that the near-wall layer remains in a quasi-equilibrium state at high Reynolds numbers, which explains the fair performance of WMLES based on equilibrium assumptions in transient 3-D boundary layers.
Acknowledgements
This investigation was funded by the Office of Naval Research (ONR), grant N000141712310. The authors acknowledge the assistance of Professor X. I. A. Yang in performing the wall-modelled simulations with IWM.
Appendix A. Response of non-equilibrium 3DTBL at low Reynolds number
For completeness, we present the results for turbulent channels with a sudden imposition of a mean spanwise pressure gradient at  $Re_{\unicode[STIX]{x1D70F}}\approx 180$. The discussion is relevant, as a large body of the previous numerical studies have been carried out at this low Reynolds number. The channels are computed using the same numerical set-up as in § 2 and the cases are listed in table 2.
Geometry and parameters of the additional DNS runs to assess the effect of low Reynolds number. The parameters are defined as in table 1.

Our numerical set-up is first validated in figure 20 against the original results by Moin et al. (Reference Moin, Shih, Driver and Mansour1990) at  $Re_{\unicode[STIX]{x1D70F}}\approx 180$ and
 $\unicode[STIX]{x1D6F1}=10$. The differences in the mean velocity profiles and Reynolds stresses are below 0.5 %, which provides confidence in our results. The time response of the tangential Reynolds stress for
 $Re_{\unicode[STIX]{x1D70F}}\approx 180$ and
 $\unicode[STIX]{x1D6F1}=30$ is shown in figure 21(a), which should be compared with the response for
 $Re_{\unicode[STIX]{x1D70F}}\approx 500$ and
 $\unicode[STIX]{x1D6F1}=80$ from figure 21(b). In spite of the marginal change in
 $Re_{\unicode[STIX]{x1D70F}}$, the evolution of the tangential Reynolds stress is substantially different from
 $Re_{\unicode[STIX]{x1D70F}}\approx 500$ to
 $Re_{\unicode[STIX]{x1D70F}}\approx 180$. In the former, the drop in
 $-\langle u_{1}u_{2}\rangle$ occurs almost simultaneously across the channel height, while at higher
 $Re_{\unicode[STIX]{x1D70F}}$ the stress follows a self-similar response in time as discussed in § 3.3. Figure 21(c) shows the percentage drop of
 $\min _{t}\{D_{\unicode[STIX]{x1D70F}}\}$ as a function of
 $\unicode[STIX]{x1D6F1}$ and
 $x_{2}^{\ast }$ for
 $Re_{\unicode[STIX]{x1D70F}}\approx 180$, which is analogous to figure 6(b,c). In contrast to the results obtained for the moderate Reynolds numbers considered in § 3.2, the Reynolds stress depletion at
 $Re_{\unicode[STIX]{x1D70F}}\approx 180$ exhibits a very weak dependence on
 $x_{2}$. Consequently, the higher Reynolds numbers investigated in the present work, although still moderate, enable the multiscale analysis of 3DTBL, whereas cases at
 $Re_{\unicode[STIX]{x1D70F}}\approx 180$ do not exhibit a multiscale response, precluding the elucidation of new potential scaling laws and physics relevant for high-Reynolds-number wall turbulence.
Validation case. Mean velocity profiles and Reynolds stresses for  $\unicode[STIX]{x1D6F1}=10$ at
 $Re_{\unicode[STIX]{x1D70F}}\approx 180$. Solid lines are for the present DNS results and the symbols from Moin et al. (Reference Moin, Shih, Driver and Mansour1990). The results are plotted for time intervals of
 $0.15h/u_{\unicode[STIX]{x1D70F}}$.

Evolution of the tangential Reynolds stress for (a)  $Re_{\unicode[STIX]{x1D70F}}\approx 180$ and
 $\unicode[STIX]{x1D6F1}=30$ and (b)
 $Re_{\unicode[STIX]{x1D70F}}\approx 550$ and
 $\unicode[STIX]{x1D6F1}=80$. Different lines correspond to different times with increasing time from black (
 $t^{\ast }=0$) to red (
 $t^{\ast }=1$). The time intervals are equally spaced. (c) The percentage drop of tangential Reynolds stress,
 $\min _{t}\{D_{\unicode[STIX]{x1D70F}}\}$, in the frame of reference of the mean shear
 $\tilde{{\mathcal{F}}}$ as a function of the spanwise-to-streamwise mean pressure gradient ratio
 $\unicode[STIX]{x1D6F1}$ and wall-normal distance
 $x_{2}^{\ast }$ for
 $Re_{\unicode[STIX]{x1D70F}}\approx 180$.

Appendix B. Sensitivity to the size of the computational domain and grid resolution
As the flow changes direction, the skin friction increases and the flow structures reorganise to be preferentially elongated in the spanwise direction. The former implies a reduction of the effective resolution of the simulations as time increases, whereas the latter could potentially yield spurious results due to the constraint imposed by the limited spanwise length of the domain. The most critical condition is attained at the latest time analysed, i.e.  $t^{\ast }\approx 1$, and the largest values of
 $\unicode[STIX]{x1D6F1}$. We have performed two additional simulations to assess the effect of the computational domain and grid resolution. We take as baseline case the channel at
 $Re_{\unicode[STIX]{x1D70F}}\approx 500$ and
 $\unicode[STIX]{x1D6F1}=80$ from table 1. The details of the two additional numerical set-ups are summarised in table 3.
Mean velocity profiles and Reynolds stresses for  $\unicode[STIX]{x1D6F1}=80$ at
 $Re_{\unicode[STIX]{x1D70F}}\approx 500$. Solid lines are for the baseline case. Dash-dotted lines (greenish) and dashed (bluish) are for cases Large500 and Finer500, respectively. Lines with different colour intensity correspond to different times
 $t^{+}=12$, 72, 132, 192, 252, 312, 372 and 432. Colours indicate time from
 $t^{+}=0$ (dark) to
 $t^{+}=432$ (light).

Geometry and parameters of the additional DNS runs to assess the effect of the computational domain and grid resolution. The parameters are defined as in table 1.

Simulation Large500 aims at evaluating whether the computational domain is large enough to avoid non-physical constraints on the flow structures. The parameters considered are  $Re_{\unicode[STIX]{x1D70F}}\approx 500$ and
 $\unicode[STIX]{x1D6F1}=80$. The size of the domain is quadrupled in the spanwise direction from
 $L_{3}^{\ast }=2\unicode[STIX]{x03C0}$ to
 $L_{3}^{\ast }=8\unicode[STIX]{x03C0}$. Figure 22 compares the one-point statistics of Large500 with the original domain from table 1. The results suggest that our analysis is barely influenced by the size of the computational domain. The effect of grid resolution is tested in case Finer500 by doubling the number of grid points in each spatial direction while maintaining the original size of the computational domain. The results, included in figure 22, show differences up to
 ${\sim}3\,\%$ at the latest times, but the grid resolution of the baseline case still suffices to capture the evolution of the mean velocity profiles and Reynolds stresses.
Appendix C. Three-dimensional non-equilibrium response in terms of Townsend’s structure parameter
(a) Magnitude of the Reynolds stress vector  $\unicode[STIX]{x1D70F}_{m}=\sqrt{\langle u_{1}^{\prime }u_{2}^{\prime }\rangle ^{2}+\langle u_{2}^{\prime }u_{3}^{\prime }\rangle ^{2}}$ and (b) Townsend’s structure parameter for
 $\unicode[STIX]{x1D6F1}=60$ at
 $Re_{\unicode[STIX]{x1D70F}}\approx 500$. Different lines correspond to different times
 $t^{+}=12$, 72, 132, 192, 252, 312, 372 and 432. Colours indicate time from
 $t^{+}=0$ (black) to
 $t^{+}=432$ (red). (c) Maximum percentage drop of Townsend’s structure parameter (
 $D_{s}$) as a function of the spanwise-to-streamwise mean pressure gradient ratio
 $\unicode[STIX]{x1D6F1}$ and wall-normal distance
 $x^{\ast }$.

An alternative marker to quantify 3-D non-equilibrium effects is the magnitude of the tangential Reynolds stress vector,  $\unicode[STIX]{x1D70F}_{m}=\sqrt{\langle u_{1}^{\prime }u_{2}^{\prime }\rangle ^{2}+\langle u_{2}^{\prime }u_{3}^{\prime }\rangle ^{2}}$, which is shown in figure 23(a). The stress undergoes first a depletion similarly to the trend observed for
 $\langle u_{1}^{\prime }u_{2}^{\prime }\rangle$. To account for the simultaneous growth of turbulent kinetic energy, the intensity of
 $\sqrt{\langle u_{1}^{\prime }u_{2}^{\prime }\rangle ^{2}+\langle u_{2}^{\prime }u_{3}^{\prime }\rangle ^{2}}$ is normally quantified by the Townsend (Reference Townsend1976) structure parameter,
 $$\begin{eqnarray}S_{p}(x_{2},t)=\frac{\sqrt{\langle u_{1}^{\prime }u_{2}^{\prime }\rangle ^{2}+\langle u_{2}^{\prime }u_{3}^{\prime }\rangle ^{2}}}{\langle u_{1}^{\prime }u_{1}^{\prime }\rangle +\langle u_{2}^{\prime }u_{2}^{\prime }\rangle +\langle u_{3}^{\prime }u_{3}^{\prime }\rangle },\end{eqnarray}$$
which measures the intensity of the Reynolds stress for a given amount of turbulent kinetic energy. The history of  $S_{p}$ also exhibits an initial drop followed by a rapid increase (figure 23b). The relative drop in
 $S_{p}$ can be measured analogously to
 $D_{\unicode[STIX]{x1D70F}}$ in (3.1) as
 $$\begin{eqnarray}D_{s}(x_{2},t)=\frac{S_{p}(x_{2},t)-S_{p}(x_{2},0)}{S_{p}(x_{2},0)}\times 100.\end{eqnarray}$$
The maximum reduction in time of  $D_{s}(x_{2},t)$, shown in figure 23(c), is consistent with the results in figure 6 using
 $D_{\unicode[STIX]{x1D70F}}$.