I. INTRODUCTION
Increasing the strength of metallic alloys is an unending pursuit for people, and continuous efforts have been made to cater the increasing requirement for load-bearing applications under various conditions. Pure metals without additional alloying elements typically exhibit low strength and thus are rarely used. During alloying development, a few strengthening mechanisms were proposed, including strain hardening, precipitation strengthening, grain size refinement strengthening, interface/grain boundary strengthening, and solid solution strengthening (SSS).
Among the multiple strengthening approaches, the SSS introduces foreign atoms (solute) into a matrix (solvent) lattice, which induces additional stress field from the lattice- and modulus-mismatch between solute and solvent with dislocations. The ductility of SSS alloys is similar with that of pure metals, but the increased strength is rather limited as evidenced by various SSS alloying systems (Al-, Cu-, and Ni-systems).Reference Avner1–Reference Liu5 Such a limitation is restricted by the limited solubility of solute atoms in the solvent matrix (i.e., restricted by the Hume-Rothery rules), and the localized stress field formed by solute–dislocation interactions. For practical engineering applications, solid solution alloys can be further strengthened by breaking down their single-phase microstructure through the introduction of additional dislocation-motion obstacles, i.e., phase boundaries, second-phase precipitates, and dispersed particles, and by the generation of pre-existing dislocations with higher densities. Successful applications of these strengthening mechanisms include gamma prime (γ′)-strengthened nickel superalloysReference Lund and Wagner6–Reference Reed8 and oxide particle-strengthened ODS steels.Reference Okuda and Fujiwara9–Reference Hsiung, Fluss, Tumey, William, Serruys, Willaime and Kimura11 However, the restriction of mobile dislocations from the additional strengthening approaches other than SSS can inevitably reduce materials’ ductility, generating the traditional strength-ductility-trade-off dilemma when engineers are selecting a material for a load-bearing application.Reference Avner1–Reference Liu5
Recently, solid solution alloys reignited metallurgists’ passion through a novel alloy design paradigm which involves the mixture of more than five elements in an equi- or near-equiatomic composition. This strategy deviates from the conventional ‘base element’ concept that uses one metallic element as the base alloy. Also, such alloys do not obey the traditional Hume-Rothery rules that increasing the number of alloying elements with varying crystal structures will simultaneously increase the probability for the formation of additional phases. Instead, single-phase solid solution alloys have been synthesized in many multicomponent alloys with equiatomic or near-equiatomic concentrations.Reference Wu, Troparevsky, Gao, Morris, Stocks and Bei12 One initially suggested contribution to this single-phase tendency, which is the high configurational entropy of the random mixing of elements, defined this class of alloys as ‘high-entropy alloy’ (HEA).Reference Yeh, Chen, Lin, Gan, Chin, Shun, Tsau and Chang13 The emergence of HEA has enabled the formation of solid solution alloys with an unexpected degree of solubility, for example, 80 at.% foreign atoms (20 at.% of Co, Cr, Fe, Mn) in Ni.Reference Cantor, Chang, Knight and Vincent14 In addition to the large solubility, the lattices of HEAs are expected to be highly and continuously distorted, enabling the development of solid solution alloys with higher strength than traditional single-phase alloys.Reference Tsai and Yeh15–Reference Ye, Wang, Lu, Liu and Yang17 To date, a large number of single-phase HEAs and medium-entropy alloys (MEAs) exhibiting better combination of strength and ductility than traditional alloys have been developed, including the quinary CoCrFeMnNi,Reference Gludovatz, Hohenwarter, Catoor, Chang, George and Ritchie18 quaternary CoCrFeNi,Reference Wu, Bei, Pharr and George19 and ternary CoCrNiReference Wu, Bei, Pharr and George19–Reference Miao, Slone, Smith, Niu, Bei, Ghazisaeidi, Pharr and Mills22 alloys which are all composed of elements with different crystal structures (BCC Fe and Cr and Mn, FCC Ni, and HCP Co), but solidify as single-phase FCC alloys.
HEAs are not a simple extension or extrapolation from the dilute solution limits but rather a distinct new state akin to a stoichiometric compound with fixed atomic ratios, albeit disordered. The absence of “solvent” and “solute” atoms results in a breakdown of the conventional picture of dislocations moving through a solvent lattice and encountering discrete solute obstacles and thus complicates the fundamental mechanisms of SSS in these compositionally complex alloys. Numerous studiesReference Gludovatz, Hohenwarter, Catoor, Chang, George and Ritchie18–Reference Wu, Liu, Wang, Ma, Stoica, Nieh, He and Lu26 have been conducted to assist the understanding of the strengthening mechanisms in HEAs. CoCrNi alloys exhibit extraordinary mechanical properties, including strength and ductility, superior to that of both conventional solid solution alloys and other HEAs with the same crystal structure.Reference Wu, Bei, Pharr and George19–Reference Miao, Slone, Smith, Niu, Bei, Ghazisaeidi, Pharr and Mills22 Twinning induced plasticity and potential phase transformation have been observed as the cause of additional strengthening.Reference Gludovatz, Hohenwarter, Thurston, Bei, Wu, George and Ritchie20–Reference Miao, Slone, Smith, Niu, Bei, Ghazisaeidi, Pharr and Mills22 It serves as a bridge linking between the conventional binary alloys and the relatively less understood HEAs, in addition to its compositional and microstructural simplicity. In the present study, CoCrNi was chosen as the matrix to be further strengthened by the doping of tungsten. Tungsten was selected in this study due to a large lattice and modulus mismatch with Co, Cr, and Ni. We first seek to push further the strength limit of single-phase solid solution alloys with the incorporation of traditional strengthening theory and the HEA concept. Predictive models for both mechanical properties and microstructure were used for alloy design, and experiments were conducted to verify the theoretical prediction. Moreover, the origin of additional strengthening was unveiled by electron backscatter diffraction (EBSD), atom probe tomography (APT), and transmission electron microscopy (TEM).
II. EXPERIMENTAL
A. Materials and methods
The base CoCrNi MEA alloy was designed to be doped with 3, 6, and 9 at.% W, respectively (named as CoCrNi–3W, 6W, and 9W alloys). The alloys were produced by arc melting the elements Co, Cr, Ni, and W (>99.9% pure) with designated compositions in a water-cooled copper hearth under Ar atmosphere. The arc-melted buttons were flipped and remelted at least five times to promote thorough mixing and then drop-cast into copper molds to produce rectangular ingots measuring 12.7 × 25.4 × 127 mm. The drop-cast ingots were homogenized for 24 h at 1473 K, followed by water quenching. The CoCrNi–3W alloy ingot then cold-rolled along the longitudinal ingot direction to a total thickness reduction of 90% without cross-rolling or intermediate annealing. Annealing studies were conducted on the rolled sheets to determine the temperatures and times that would yield fully recrystallized microstructures with desired grain sizes (∼1 μm).
B. Microstructural characterization
A 6500F JEOL FEG-SEM (JEOL, Tokyo, Japan) was used to characterize the microstructures of the homogenized, as-annealed, and tensile-fractured materials. The EBSD measurements were performed with the SEM equipped with a TSL EBSD system (EDAX, Mahwah, New Jersey) with an electron probe current of 3.0 nA, at an acceleration voltage of 20 kV, with a step size of 20 nm (high magnification). The qualification and analysis of the EBSD results were performed using TSL OIM V7™ software. EBSD maps are displayed as inverse pole figure (IPF) maps in the direction of the rolling direction (for the initial microstructure) or tensile axis (for the tensile-deformed microstructure). Data “cleaning” procedures were not used.
The cross-sectional TEM samples close to the fracture surface were first prepared by using a FEI Nova 200 dual-beam focused ion beam (FIB, ThermoFisher Scientific, Hillsboro, Oregon). The TEM lamellas were ion-milled by 30 kV beam and finally polished at 5 kV. After reaching a thickness of ∼100 nm, a FISCHION NanoMill (Model 1040, E.A. Fischione Instruments, Inc., Export, Pennsylvania) was used to further clean the FIB damaged surface at both sides following the sequence of 1500 eV for 30 min and 900 eV for 10 min using the Ar ion beam with a 190 μA current. Selected area diffraction, bright field TEM and high resolution TEM imaging were performed at 300 keV using a Hitachi HF3300 TEM Hitachi America, Schaumburg, Illinois.
C. Atom probe tomography
An FEI Nova 200 dual-beam FIB instrument was used to perform site-specific lift-outs of specimen regions-of-interest and annular milling to fabricate the needle-shaped APT specimens. A wedge lift-out geometry was used to mount multiple samples on a Si microtip coupon array to enable the fabrication of multiple APT needles from one wedge lift-out.Reference Moody, Stephenson, Ceguerra and Ringer27,Reference Guo, Garfinkel, Tucker, Haley, Young and Poplawsky28 APT was performed with a Cameca Instruments LEAP 4000X HR (Cameca Instruments, Inc. Madison, Wisconsin). During the data collection process, atoms from the surface of a cryogenically cooled needle-shaped specimen were field evaporated in an atom-by-atom fashion. The measurements were performed in the laser mode with a 30 pJ pulse energy at 30 K and a detection rate of 0.005 atoms per pulse. The collected dataset was reconstructed using Cameca IVAS 3.6.12 software.
D. Mechanical test
Flat dog-bone-type specimens of the CoCrNi–3W alloy with a gage length of 10 mm were cut from the cold-rolled sheets by electrical discharge machining with their longitudinal axes perpendicular to the rolling direction. The specimens were annealed at the desired temperatures and times, and all faces of their gage sections ground through 600-grit SiC paper. Nine Vickers microhardness indents spaced 1 mm apart were made along the specimen gage lengths using a LECO LM 100AT Vickers hardness tester with a force of 200 g. Uniform elongations to fracture were calculated by averaging the change in the distance between adjacent indents, excluding the two indents on either side of the fracture plane.
Tensile tests were performed with a screw-driven tensile testing machine (Instron, Norwood, Massachusetts) at an engineering strain rate of 10−3 s−1 and temperatures of 77 and 293 K. For the tests at 77 K, the specimens and grips were first fully immersed in a bath of liquid nitrogen (77 K tests) for about 15 min before starting the test. During the tests, the baths were topped off as needed to keep the specimen and grips fully immersed at all times. Room-temperature tests were performed in ordinary ambient air. Fracture surfaces were examined on a JEOL JCM-5000 microscope (JEOL, Tokyo, Japan) operated at 10 kV.
III. RESULTS AND DISCUSSION
A. Theoretical prediction of strength and phase stability
By treating the ternary CoCrNi alloy as the “average solvent”, we applied the Labusch model, which was shown by many studies to exhibit better agreement of experimental results among the numerous approachesReference Cizek, Kratochvíl and Smola29–Reference Gypen and Deruyttere32 to predict the SSS effects. WeReference Wu, Gao and Bei33 have recently successfully applied this model to multicomponent (including high entropy) alloys, predicting the strengthening effect of certain elements as “solute” in the CoCrNi alloy. In the Labusch model,Reference Toda-Caraballo, Wrobel, Dudarev, Nguyen-Manh and Rivera-Díaz-del-Castillo34–Reference Haasen39 the SSS ∆σ can be expressed as
 $$\Delta {\sigma _{{\rm{solute ‐ strengthening}}}} = fG{\left\{ {\left[ {{{\left( {{{{\eta _i}} \over {1 + {1 / 2}\left| {{\eta _i}} \right|}}} \right)}^2} + {\alpha ^2}\delta _i^2} \right]{x_i} + \left[ {{{\left( {{{{\eta _j}} \over {1 + {1 / 2}\left| {{\eta _j}} \right|}}} \right)}^2} + {\alpha ^2}\delta _j^2} \right]{x_j} + \cdots } \right\}^{{2 / 3}}}\quad ,$$
where f is a dimensionless parameter, G is the shear modulus, δ describes the lattice mismatch δ = (1/a)(da/dx i), η describes the modulus mismatch η = (1/G)(dG/dx i), x i is the concentration of element i, a is the lattice parameter of alloy, and α is a dimensionless parameter that describes the type of dislocations, which is ∼3–16 for screw dislocations, and >16 for edge dislocations. The absolute value of strengthening from the above equation relies on a dimensionless factor f, which is unknown for a specific alloy system. However, systematic studies have shown that a single fitting value of f can reasonably predict the strengthening values of most known single-phase concentrated solid solution alloys.
The Labusch model suggests that solute atoms with large lattice and modulus mismatch with the “solvent” could be the ideal intrinsic strengthener. The Seitz radius of Co, Cr, and Ni are 1.385, 1.423, and 1.377 Å,Reference King40 respectively; the shear modulus of Co, Cr, and Ni are 75, 76, and 115 GPa, respectively. Among the transitional metals, W exhibits both large lattice and modulus differences (1.549 ÅReference King40 and 161 GPa) from those of Co, Cr, and Ni and thus it becomes a natural and promising candidate to further strengthen the CoCrNi alloy. The incorporation of W into the already-distorted CoCrNi lattice would generate further significant lattice distortions. This leads to significant short-range bending/curving of the dislocations which consequently require an elevated stress to move these dislocations. It is noted that for HEAs, there are only limited TEM studies on dislocation cores. These cores are still very small similar to ordinary dislocations in metals. The introduction of a low percentage of W atoms will only affect the gliding resistance of the dislocations. It is unlikely that W atoms will lie directly in the dislocation core.
Current analysis of the strengthening effects of W to CoCrNi is based on the existing knowledge of the strength of CoNi and CoCrNi,Reference Wu, Gao and Bei33 and the assumption that the factor f remains roughly the same for strengthening from CoNi to CoCrNi (∆σCr) and from CoCrNi to CoCrNi–xW (∆σW). In this way, we can calculate the ratio of ∆σW to ∆σCr and predict the strength of NiCoCr–xW.
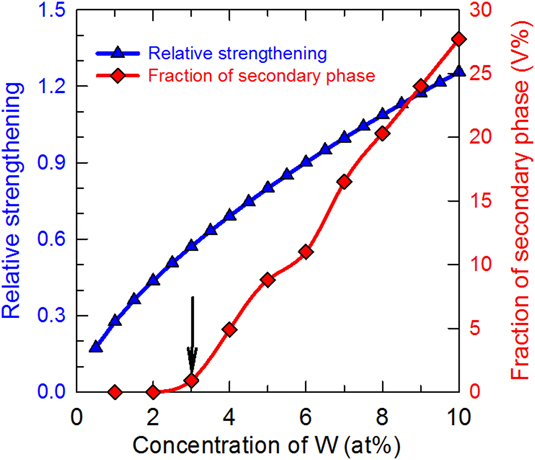
Based on the above equation, we first need to determine the lattice and modulus mismatch in both CoNi–Cr and CoCrNi–W systems. Similar to the quasi-binary treatment of the CoCrNi–xW system,Reference Wu, Gao and Bei33 we treated Cr and CoNi as the solute and solvent in CoCrNi. In addition, since the lattice parameter and shear modulus of CoCrNi–xW is unknown, we assumed Vegard’s law is valid; thus the mismatch is calculated as, ηW = (G W − G NiCoCr−xW)/[(1 − x)G NiCoCr−xW]. The alloys of interest here all have an FCC structure, while elemental Cr and W have a BCC structure. The effective interatomic spacing of W in the FCC structure was calculated from the elemental lattice parameter in its own crystal structure (e.g., S BCC = √3a BCC/2), and by applying a presumed translating factor between different crystal structures, e.g., 0.97, from BCC to FCC. This method has been applied in Toda-Craballo’s studiesReference Toda-Caraballo, Wrobel, Dudarev, Nguyen-Manh and Rivera-Díaz-del-Castillo34 in the interatomic spacing matrix analysis. The predicted relative strengthening effects (∆σW/∆σCr) are presented in Fig. 2 as a function of W content. The overall strengthening effects of W for the CoCrNi alloy is not as significant as that of Cr to CoNi alloy until the content of W reaches 7.5 at.%. For example, when 6 at.% W is added to the CoCrNi alloy, given that a random solid solution alloy is formed, the strengthening effects from CoCrNi to CoCrNi–6W is ∼90% of that from the equiatomic CoNi to equiatomic CoCrNi alloy.
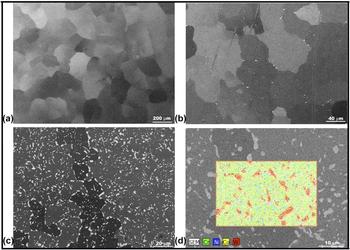
With the expected strengthening effects of W to the CoCrNi alloy, we next aim to determine the maximum solubility of W in the CoCrNi alloy since it is important to maximize the SSS effects without forming secondary phases that deteriorate the alloy’s ductility. The microstructure was predicted by Thermolcalc using the TCNI8 database and was experimentally validated. Presented in Fig. 1 is also the predicted volume fraction of the secondary equilibrium phase(s) at 900 °C as a function of W content. It can be seen that, as the arrow indicates, when the W content is 3 at.% or below, the resultant alloy remains single FCC phase. A significant amount (>5%) of secondary phase is formed when the W concentration reaches 4%. This microstructural model was experimentally validated. Figures 2(a)–2(c) depict the microstructures of the CoCrNi alloys with varied amount of W under homogenization condition (1200 °C, 24 h). As both the X-ray diffraction pattern and backscattered electron image show, the 3 at.% W sample is free of secondary phases [Fig. 2(a)], which is consistent with microstructural prediction. Both 6W- and 9W-containing alloys contain additional phases located mainly at grain boundaries [Figs. 2(b) and 2(c)]. The energy-dispersive X-ray spectroscopy analysis [Fig. 2(d)] of the CoCrNi–9W specimen shows that W is enriched in the observed secondary-phase, the presence of which is expected to reduce the ductility significantly due to the cavitation at these particles. To simplify our understanding of SSS in single-phase alloys, the W content was maintained at 3 at.% for further mechanical tests.
Relative strengthening effects predicted by Labusch model and volume fraction of secondary phase predicted by ThermoCalc as a function of W concentration.

The backscattered electron images of (a) CoCrNi–3W, (b) CoCrNi–6W, and (c) CoCrNi–9W alloys, all in homogenized condition; (d) EDS compositional mapping showing the bright phases is W-enriched.

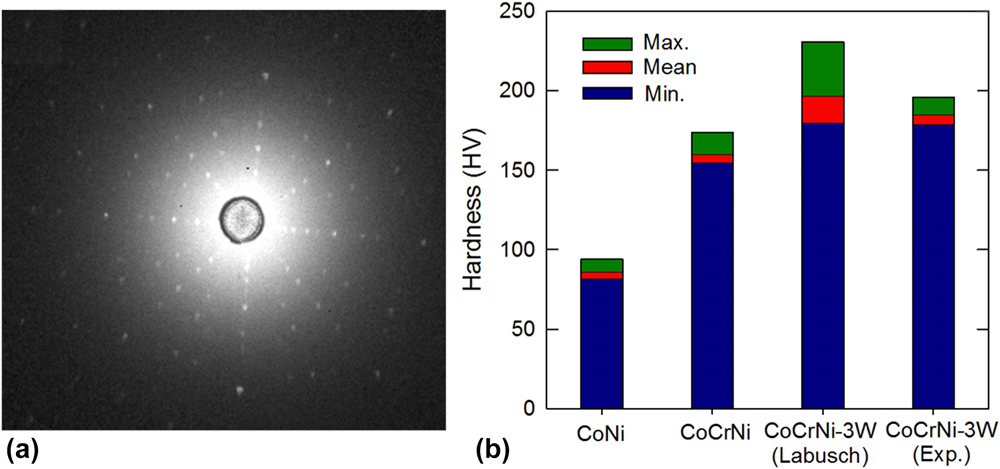
As the Labusch-type strengthening model only considers internal frictional stress without the external effects such as thermal processing, grain sizes, and grain boundaries, a mechanical test of single crystal structure would be ideal to unveil the upper limit of SSS by ruling out the external effects. Therefore, single crystal CoCrNi–3W alloys were fabricated using the floating zone method and tested by microindentation. Figure 3(a) shows the X-ray Laue backscattering pattern of NiCoCr–3W, which confirms its single crystalline nature via a high crystal quality and a {100} surface cut. Figure 3(b) shows the measured microhardness data of single crystals CoNi, CoCrNi, and CoCrNi–3W of its both experimental and theoretical values. It is shown that the microhardness of single crystal CoNi and CoCrNi are measured as 78–90 and 150–160 HV200 by previous studies.Reference Wu, Bei, Pharr and George19 An average ∼90% intrinsic hardness increase from CoNi to CoCrNi is due to the addition of Cr which has larger atomic size and modulus than both Co and Ni. The further addition of 3 at.% W for the CoCrNi–3W single crystalline alloy further increases the hardness to 179–190 HV200, which agrees well with the theoretical predicted value by the Labusch method (180–214 HV200). This is ∼20% higher than that of the CoCrNi alloy.
(a) Laue backscatter diffraction patterns shown as an example of single crystals of the CoCrNi alloy; (b) hardness comparisons between the experiments and Labusch model for single crystals of CoNi, CoCrNi, and CoCrNi–3W alloys, respectively.

B. Microstructural control and evaluation
Grain refinement can efficiently and frequently stop a microcrack by such effective barriers as grain boundaries and thus the crack is forced to reinitiate repeatedly, and considerable energy is expended as it alters the direction in search of the most likely propagation plane in the contiguous grains. Thus, grain refinement is the widely accepted way to simultaneously improve materials’ strength and toughness. It has been shown that materials with sub-micro-grain sizes could take advantage of unprecedented mechanical strengthening through the well-known Hall–Petch relationship that projects a continuous rise of strength with decreasing grain size and circumvent the large ductility reduction problem observed in nanocrystalline (<0.1 μm) materials.Reference Schiotz and Jacobsen41,Reference Meyers, Mishra and Benson42
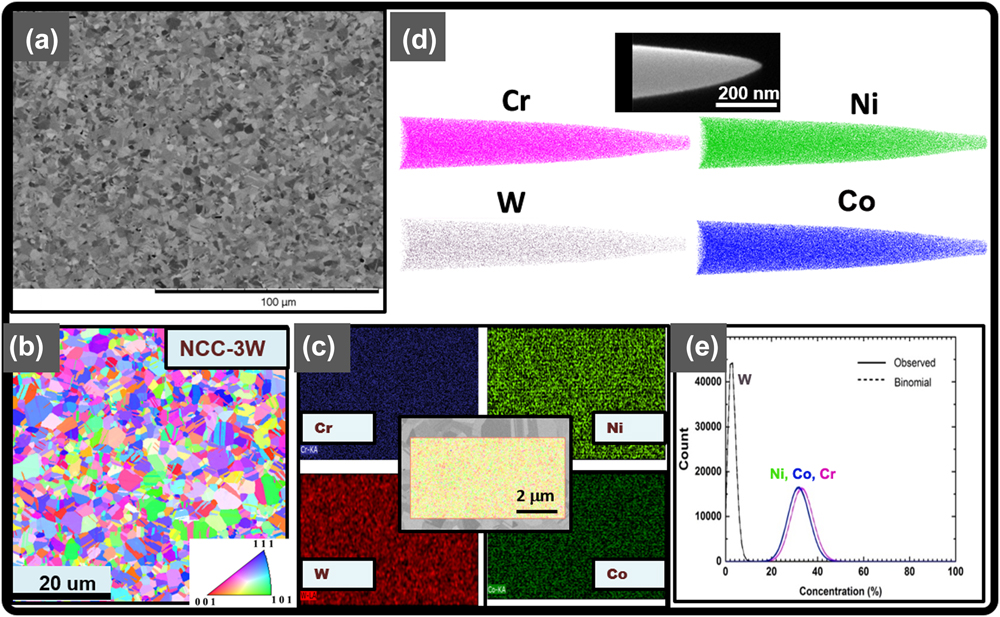
In this study, boundary-strengthening was also applied to further strengthen the CoCrNi–3W alloy. Appropriate thermomechanical processing was performed to tune the as-cast microstructure and to obtain materials with the desired range of grain sizes. The CoCrNi–3W alloy possesses great workability and can be cold-rolled down to a 90% thickness reduction without cracking. An EBSD IPF [Fig. 4(b)] reveals that after further 800 °C annealing for 1 h, a microstructure with an average grain size of ∼1 μm is achieved, which is within the range we expect to achieve an ideal strength and ductility combination. For the parent alloy, CoCrNi, an identical thermomechanical processing routine has yielded a microstructure with a much large grain size in average (∼5 μm).Reference Wu, Bei, Otto, Pharr and George43 The achievability of much finer grain sizes in the CoCrNi–3W alloy benefits from the incorporation of W as the solute element via the “solute-drag” effect.Reference Humphreys and Hatherly44 EDS analysis covers a 7.5 × 4 μm2 scan area and shows a rather uniform distribution of constituent elements at both grain interior and grain boundaries. [Fig. 4(c)].
Electron backscattered (a) and EBSD (b) images of the CoCrNi–3W alloy annealed at 800 °C for 1 h after cold rolling; (c) microscaled compositional mapping showing uniform distribution of each element; (d and e) atomic-scaled visualization of elemental distribution showing no indication of the presence of second-phase precipitates.

Atomic distributions of the W, Ni, Cr, and Co elements and nanoscale microstructures in the CrNiCo–3W alloy were characterized using APT. The three-dimensional (3D) APT elemental maps of the CoCrNi–3W HEA are shown in Fig. 4(d). Only 20% of the elements in the APT dataset are displayed for clarity. A frequency distribution analysis (FDA) is used to test the atomic distribution homogeneity within the APT dataset, displayed in Fig. 4(e). For the FDA, the data are sectioned into 100 ion bins, and the compositions of the bins (observed) are compared to a binomial distribution (binomial), which represents a random solid solution. The data presented in Fig. 4(c) show a good match between the observed concentrations and the binomial distribution indicating that there exists a solid solution of elements within the APT dataset. The µ-value, which is χ2 normalized to the sample size, is used to quantify the degree of fit between the binomial distribution and the observed data. Only the μ-value is reported in this case due to the very large sample size, which causes other χ2 statistical tests, such as the p-test, to be extremely sensitive to small variations between the observed data and binomial distribution. The μ-value ranges from 0 to 1, with 0 indicating a complete random solid solution and 1 representing a complete association of the elements. χ2 statistics applied to APT data, including the μ-value, are explained in more detail by Moody et al.Reference Moody, Stephenson, Ceguerra and Ringer27 and in pages 303–306 of the work of Miller and Forbes.Reference Miller and Forbes45 The μ values for Ni, Cr, Co, and W within the analyzed volume, 35 × 35 × 75 nm3, were found to be 0.026, 0.027, 0.028, and 0.011, respectively, which confirm that the Ni, Cr, Co, and W distributions are indeed homogenous without the existence clustering or nm-precipitates. Two other APT tips have been run and they both reveal the same results.
C. Mechanical properties
Quasi-static tensile stress–strain curves [Fig. 5(a)] were measured at room temperature (293 K) and liquid nitrogen temperature (77 K) using uniaxial, dog-bone-shaped tensile specimens cut from the as-rolled sheets followed by 1-h-annealing at 800 °C. Reducing the test temperature from 293 to 77 K caused a ∼25% increase in yield strength and UTS and, more interestingly, a slight increase in ductility. Presented in Fig. 5(a) are also the engineering plastic stress–strain curves of the parent alloy, CoCrNi, with a similar grain size (0.805 and 1.25 μm).Reference Suzuki and Barrett46 It can be seen that, at 293 K, the yield strength of the CoCrNi–3W alloy (∼1 GPa) is nearly doubled of the CoCrNi alloy (400–500 MPa). The UTS increases from 740 to 800 MPa for the CoCrNi alloy to ∼1.3 GPa for the CoCrNi–3W alloy. There are only minor ductility differences between these two alloys.
(a) Engineering stress–strain curves of the CoCrNi–3W alloy compared with the parent CoCrNi alloy; (b) EBSD image of the CoCrNi–3W alloy tested at 77 K to failure; TEM images of the CoCrNi–3W tested to failure at (c and e) 293 and (d and f) 77 K; fracture surfaces of the CoCrNi–3W tested to failure at (g) 293 K and (h) 77 K.
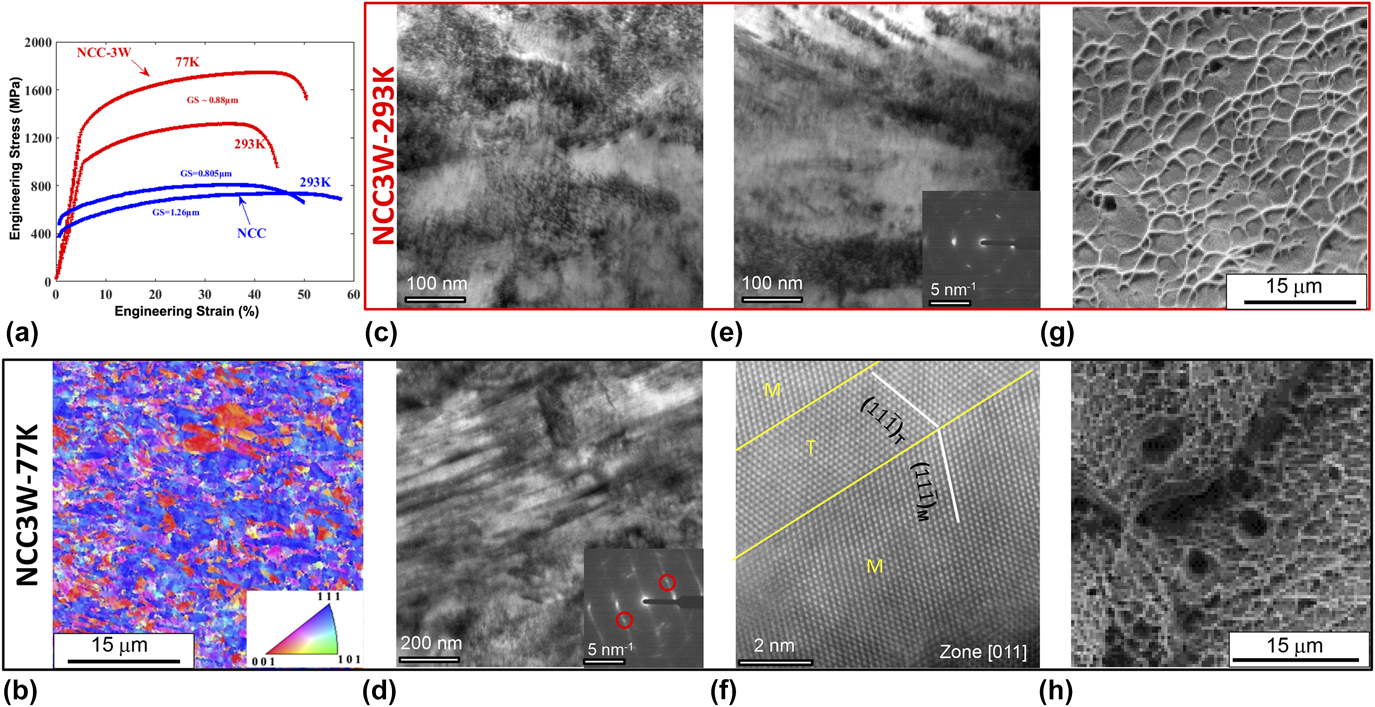
Compared to the initial material, shown in Fig. 4(a), which exhibits an equiaxed grain structure and homogeneous in-grain orientation, an EBSD IPF of the post-fracture microstructure [Fig. 5(b)] shows the presence of significant orientation fluctuations within individual elongated grains. These in-grain orientation variations were generated by the dislocation accumulation during deformation. Another feature is that, under tensile deformation, the highly distorted grains are also highly oriented, with their 〈1 1 1〉 or 〈1 0 0〉-crystallographic directions parallel to the tensile axis. In many low stacking fault energy (SFE) FCC metal and alloys, including Cu,Reference Yoshida, Bhattacharjee, Bai and Tsuji47 Ag–Au alloys,Reference Blewitt, Coltman and Redman48 and Fe–33Mn–3Al–3Si,Reference Yang, Xie, Meng, Ding and Tang49 Fe–31Mn–3Al–3Si,Reference Ueji, Tsuchida, Terada, Tsuji, Tanaka, Takemura and Kunishige50 and Fe–22Mn–0.6CReference Gutierrez-Urrutia, Zaefferer and Raabe51 TWIP steels and some HEAs, such as CoCrFeMnNi, CoCrFeNi, and CoCrNiMn, under low-temperature tension, microscaled twin-bands consisting of numerous nanotwins are often observed within the 〈111〉/TA oriented grains. However, the IPF shown in Fig. 5(b) did not reveal an extensive existence of deformation twins.
To examine the post-mortem substructures in more detail, the regions close to the fractured surfaces of CoCrNi–3W alloys were examined by TEM for tensile tested samples at both room temperature and cryogenic temperature. At room temperature [Figs. 5(c) and 5(e)], the deformation structures are mainly consisted of large number density of dislocation cell structures, which are resulted from multislip and cross-slip of dislocations. A few microbands can also be observed. However, in the current field of view, we do not observe much twinning while tilting the sample close to the 〈101〉 zone axis. At cryogenic temperature [Figs. 5(d) and 5(f)], a large number of banding structures with a thickness ranging from 5 to 30 nm have been found. A close look at the interface between the band and the matrix reveals that the bands are indeed nanotwins. The tendency of having nanotwins as the substructure for work hardening at cryogenic temperature shares the similar trend as the NiCoCr MEAs.Reference Laplanche, Kostka, Reinhart, Hunfeld, Eggeler and George21,Reference Miao, Slone, Smith, Niu, Bei, Ghazisaeidi, Pharr and Mills22 Considering the fact that extensive twinning has been observed previously in the parent alloy, CoCrNi, due to the significant reduction of stacking fault energy (SFE, from ∼150 ergs/cm2 for pure Ni to <20 ergs/cm2 for CoCrNi alloyReference Gallagher52), the observation of nanotwinning in the CoCrNi–3W alloy is not surprising since it has been reported that W is more effective than Cr and Co in reducing the SFE of Ni.Reference Gallagher52 Thus, it is expected that the SFE of the CoCrNi–3W alloy can be even lower than that of the CoCrNi alloy, resulting in more pronounced twinning activities. The fracture surfaces [Figs. 5(g) and 5(h)] show that the CoCrNi–3W alloy fracture at both 293 and 77 K takes place by the nucleation of microvoids followed by their growth and eventual coalescence to form cracks, resulting in a fracture surface consisting of numerous microsized “equiaxed dimples”. These are typical fracture surface appearances for ductile materials under a uniaxial loading condition. Another important finding is that the microvoids are almost not associated with any inclusions. This can further explain the observed improved ductility and support the absence of brittle precipitates in the materials.
IV. CONCLUSIONS
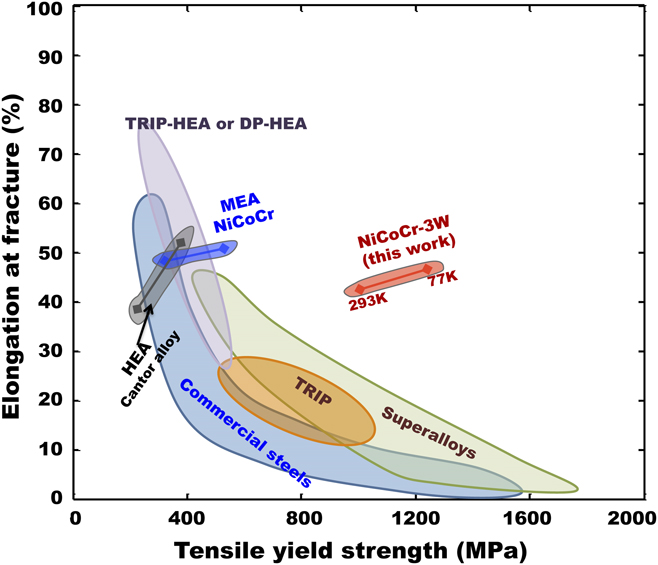
The current study demonstrates a new method to push the strength-limit of single-phase solid solution alloys while maintaining ductility through the combination of traditional SSS and HEA concepts. The incorporation of dilute atoms (W) with large mismatch (size and modulus) into the already-distorted strong-and-ductile HEA (CoCrNi) matrix leads to a remarkable intrinsic strength level that is superior to both traditional binary single-phase solid solution alloys, such as Ni–20Fe, as well as single-phase HEAs, such as CoCrFeNi and CoCrFeNiMn. “Solute-drag” effects of W in the CoCrNi matrix combined with the slow grain growth made the achievement of nano-to-micrograined microstructure possible through traditional thermomechanical processes. This extrinsic boundary strengthening further increased the strength while retaining the ductility level. The synergy effect of SSS, deformation induced nanotwinning, and grain size refinement places the CrCoNi alloys with both high ultimate tensile strength (1000 MPa) and ductility (50%). The current CoCrNi–3W alloy exhibits strength and ductility that deviates from the conventional strength-elongation contour (Fig. 6) that most conventional materials, such as TWIP steels, TRIP steels, and superalloys, follow to the top-right corner.
Strength versus ductility properties for the CoCrNi–3W alloy at both 77 and 293 K, compared with other HEAs and conventional alloys. Ashby map showing the deviation of the CoCrNi–3W alloy from the traditional strength-elongation trend.

ACKNOWLEDGMENTS
This research was supported by the U.S. Department of Energy, Office of Science, Basic Energy Sciences, Materials Sciences and Engineering Division. Atom probe tomography and TEM were performed at ORNL’s Center for Nanophase Materials Sciences (CNMS), which is DOE Office of Science User Facility.