INTRODUCTION
Large herbivores commonly experience considerable seasonal and annual variation in resources, particularly in arid and semi-arid tropical environments characterized by a high climatic variability. In these environments, alternating wet and dry seasons impose a cycle of plant growth and phenology that results in a cycle of food abundance and quality. Forage availability during the dry season has been found to be a major factor affecting large-herbivore populations (Owen-Smith Reference OWEN-SMITH2002). Additionally, most large herbivores require access to drinking water to complement forage consumption in the dry season when forage quality and water content is low. The regular need to access drinking water constrains the ability of herbivores to range far from water, and surface water sources constrain herbivore distribution in the dry season (Redfern et al. Reference REDFERN, GRANT, BIGGS and GETZ2003, Smit et al. Reference SMIT, GRANT and DEVEREUX2007, Thrash et al. Reference THRASH, THERON and BOTHMA1995, Valeix et al. Reference VALEIX, FRITZ, LOVERIDGE, DAVIDSON, HUNT, MURINDAGOMO and MACDONALD2009a, Reference VALEIX, LOVERIDGE, CHAMAILLÉ-JAMMES, DAVIDSON, MURINDAGOMO, FRITZ and MACDONALDb; Western Reference WESTERN1975). As the dry season progresses, rain-fed, non-permanent surface water sources become depleted, forcing most herbivores to concentrate in the immediate vicinity of the few remaining permanent sources of drinking water, resulting in high levels of animal aggregation near water sources at the peak of the dry season (Chamaillé-Jammes et al. Reference CHAMAILLÉ-JAMMES, VALEIX and FRITZ2007a, Reference CHAMAILLÉ-JAMMES, FRITZ, VALEIX, MURINDAGOMO and CLOBERT2008; Weir & Davison Reference WEIR and DAVISON1965). While aggregation of herbivores at water sources in the dry season is a well-known pattern in arid and semi-arid ecosystems, the temporal dynamics of herbivore aggregation at water sources has been poorly documented (but see Ayeni Reference AYENI1975).
Successful management of African savanna ecosystems and conservation of large African herbivores requires an understanding of the relationship between surface water and herbivore populations (Chamaillé-Jammes et al. Reference CHAMAILLÉ-JAMMES, VALEIX and FRITZ2007a, Reference CHAMAILLÉ-JAMMES, FRITZ and MURINDAGOMO2007b, Reference CHAMAILLÉ-JAMMES, FRITZ, VALEIX, MURINDAGOMO and CLOBERT2008; Owen-Smith Reference OWEN-SMITH1996, Redfern et al. Reference REDFERN, GRANT, GAYLARD and GETZ2005). Annual rainfall influences not only primary production (Coe et al. Reference COE, CUMMING and PHILLIPSON1976, Nemani et al. Reference NEMANI, KEELING, HASHIMOTO, JOLLY, PIPER, COMPTON, MYNENI and RUNNING2003) but also availability of surface water (Chamaillé-Jammes et al. Reference CHAMAILLÉ-JAMMES, FRITZ and MURINDAGOMO2007b, Redfern et al. Reference REDFERN, GRANT, GAYLARD and GETZ2005). Annual rainfall in semi-arid environments typically has a coefficient of variation greater than 25% (Walker Reference WALKER1987), with the result that droughts, which may cause high herbivore mortality (Dudley et al. Reference DUDLEY, CRAIG, GIBSON, HAYNES and KLIMOWICZ2001, Dunham Reference DUNHAM1994, Owen-Smith Reference OWEN-SMITH1990), regularly occur. Surprisingly, extremely little is known about the effect of variability in annual rainfall on the use of water sources by herbivores (but see Chamaillé-Jammes et al. Reference CHAMAILLÉ-JAMMES, FRITZ, VALEIX, MURINDAGOMO and CLOBERT2008, Valeix et al. Reference VALEIX, CHAMAILLÉ-JAMMES and FRITZ2007).
In this study I used data from water-hole monitoring undertaken during two contrasting years in terms of annual rainfall in Hwange National Park, Zimbabwe, to assess the influence of annual rainfall on use of water sources by large herbivores in a semi-arid savanna in the dry season. This comparative approach aims at investigating whether the temporal dynamics of use of water sources in the dry season was different between a year of average rainfall and a drought by testing the following hypotheses: (1) more herbivores visit water sources in a dry year and the intensive use of water sources starts earlier in the dry season; (2) because herbivores may use different temporal niches at water-holes (Valeix et al. Reference VALEIX, CHAMAILLÉ-JAMMES and FRITZ2007), I further tested whether the level of herbivore aggregation (number of herbivores occurring simultaneously) at water sources in the dry season is higher and increases earlier in a dry year; and (3) because of differences in water dependence, the influence of surface-water should not be equal among the different species of herbivores. Water dependence is mainly a function of the capacity of animals to conserve water, i.e. principally their physiological adaptations (Taylor Reference TAYLOR1968). The species studied here do not show particular physiological adaptation to conserve water. However, because leaves contain more water than grass in the dry season, grazers are commonly considered more water-dependent than browsers. Hence, grazers are expected to show stronger differences in use of water sources between the two years of the study.
METHODS
Study site
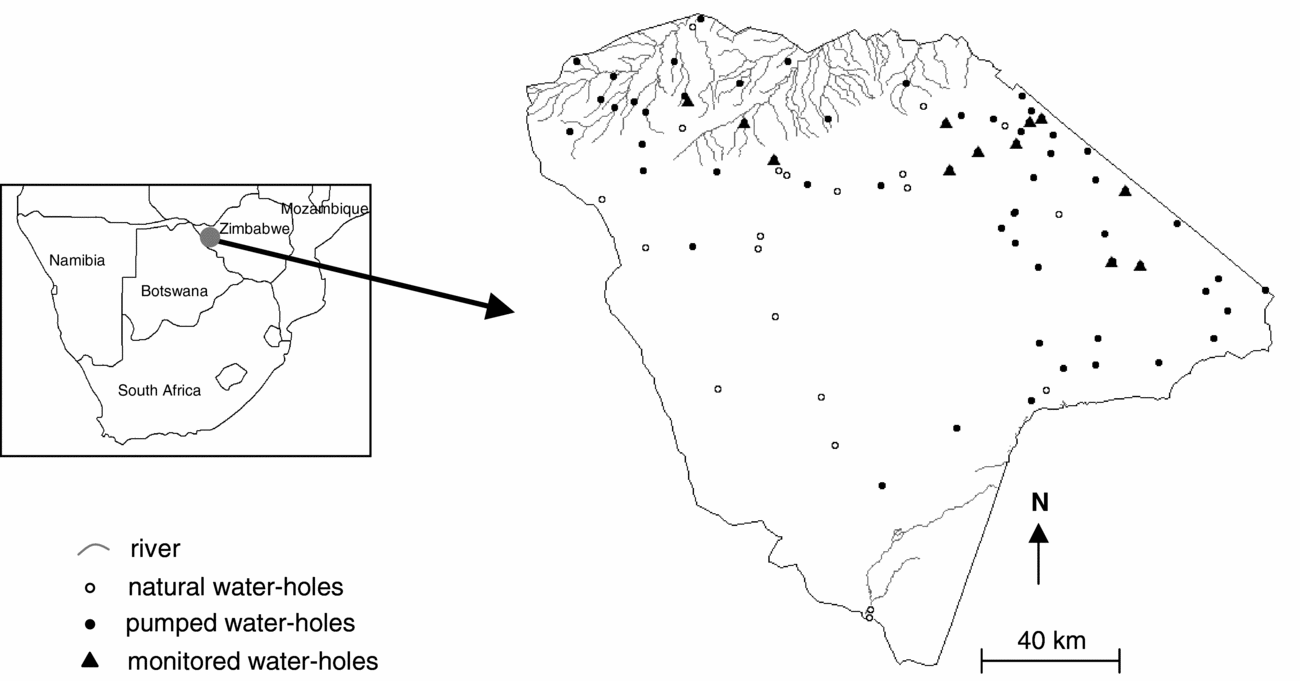
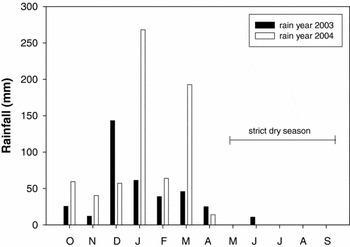
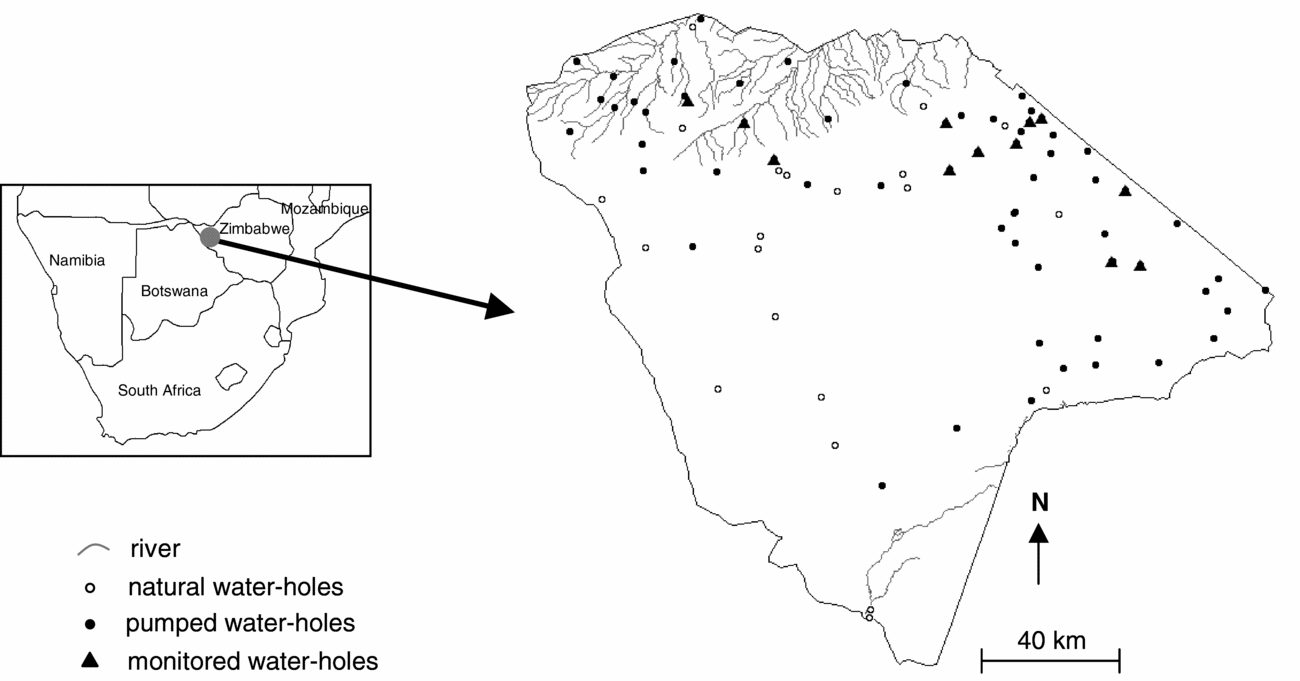
The study area covers ~7000 km2 of semi-arid dystrophic (nutrient-poor soil) savanna on Kalahari sands in the northern part of Hwange National Park (HNP), Zimbabwe (19°00′S, 26°30′E) (Figure 1). The vegetation is primarily woodland and bushland savanna, with plant communities dominated by Baikiaea plurijuga Harms, Terminalia sericea Burch. ex DC., Colophospermum mopane (Kirk ex Benth.) Léonard, Combretum spp. and Acacia spp. (Rogers Reference ROGERS1993). Rainfall data have been recorded daily since 1928 in three climatic stations located in the northern part of the park. Most rain falls between October and April so annual rainfall of year N was calculated as the rainfall that fell between October of year N-1 and September of year N. The long-term (1928–2005) mean annual rainfall is 606 mm but is highly variable (CV ≈ 30%). The study took place from May until the first rains in October–November of two years (2003 and 2004) contrasted in terms of annual rainfall: 2003 received only 362.6 mm (a value which is below the 10% percentile of annual rainfall distribution) whereas 2004 received 695.8 mm (a value within 1 SD of the long-term mean) (Figure 2). Hence, 2003 can be considered a drought and 2004 a year of average annual rainfall. The period from May to September will be considered as the strict dry season since it is exceptional that rain occurs during this period of the year (Figure 2). There is no perennial water in the study area, although rain-fed pans hold water for much of the year in an average rainfall year. Water is artificially supplied to some water-holes (~50 in the whole park) during the dry season (Figure 1).
Map of Hwange National Park, Zimbabwe, showing surface water sources. The river network and most of the natural water-holes dry up during the dry season.
Monthly rainfall (mm) averaged over the two climatic stations (Main Camp and Sinamatella) corresponding to the study area in the north of Hwange National Park, Zimbabwe, for the two study rain years (from October to September), 2003 and 2004.

Water-hole monitoring
This study is based on data collected at 12 water-holes in 2003 and nine in 2004 (average ± SD diameter of a water-hole: 85 ± 35 m) (Figure 1). The monitoring occurred every 2 wk throughout the dry season and during the few weeks of the beginning of the rainy season (May–November). Most herbivores visit water-holes during the daytime period (Valeix et al. Reference VALEIX, CHAMAILLÉ-JAMMES and FRITZ2007), hence this study is based on data collected between 6h00 and 18h00. This represents 1212 h and 1020 h of observations in 2003 and 2004 respectively. The use of water-holes was monitored for nine common large herbivores: elephant, average body mass 1725 kg, three browsers (giraffe Giraffa camelopardalis Linnaeus – 750 kg, greater kudu Tragelaphus strepsiceros (Pallas) – 135 kg, and impala Aepyceros melampus (Lichtenstein) – 45 kg; impala is a mixed-feeder that browses in the dry season), and five grazers (African buffalo Syncerus caffer (Sparrman) – 450 kg, roan antelope Hippotragus equinus Desmarest –220 kg, sable antelope Hippotragus niger Harris – 185 kg, warthog Phacochoerus africanus (Pallas) – 45 kg, and Burchell's zebra Equus quagga Boddaert – 200 kg). For each group of herbivores visiting a water-hole to drink, the group size and the time of arrival at the water-hole were recorded. Additionally, to assess the level of herbivore aggregation at water-holes, the number of species, groups and individuals present in the vicinity of the water-hole at the same time was recorded every 15 min.
Analyses
First, the number of groups and the number of individuals counted at a water-hole daily for each month were compared to test whether there were more herbivores visiting water-holes to drink in 2003 (drought) than in 2004 (year of average rainfall) and whether the intensive use of water-holes by herbivores started earlier in 2003. This approach was carried out globally (the total number of herbivores was considered) and at the species level. Second, aggregation data were used to test whether for each month the total number of herbivores simultaneously at a water-hole (aggregation level hereafter) was higher in 2003 and whether the increase in aggregation level started earlier in 2003. Preliminary tests for equality of variance between the two years were performed. The pooled t-statistics was used when there was equality of variance, and the Satterthwaite t-statistics was used when there was inequality of variance.
RESULTS
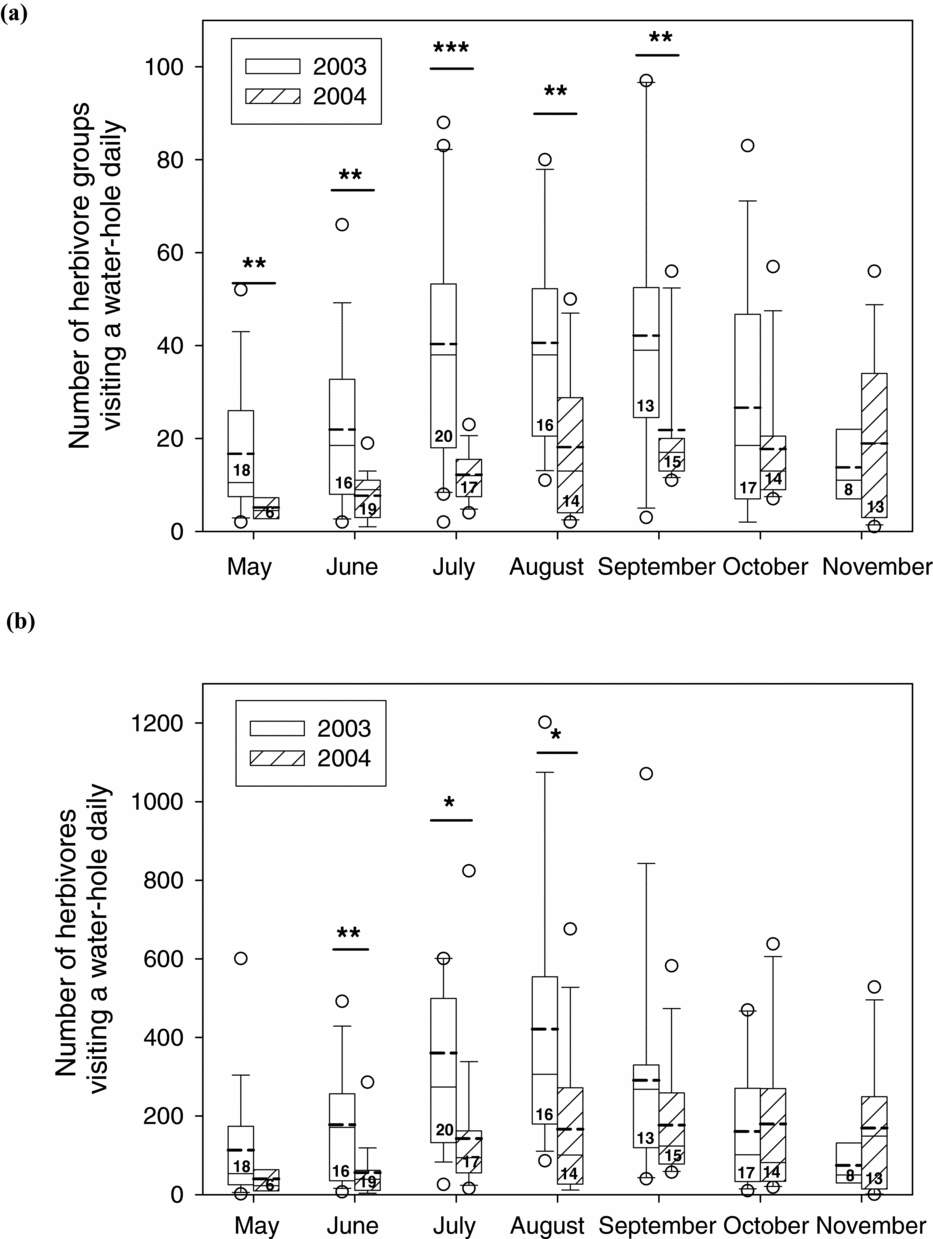
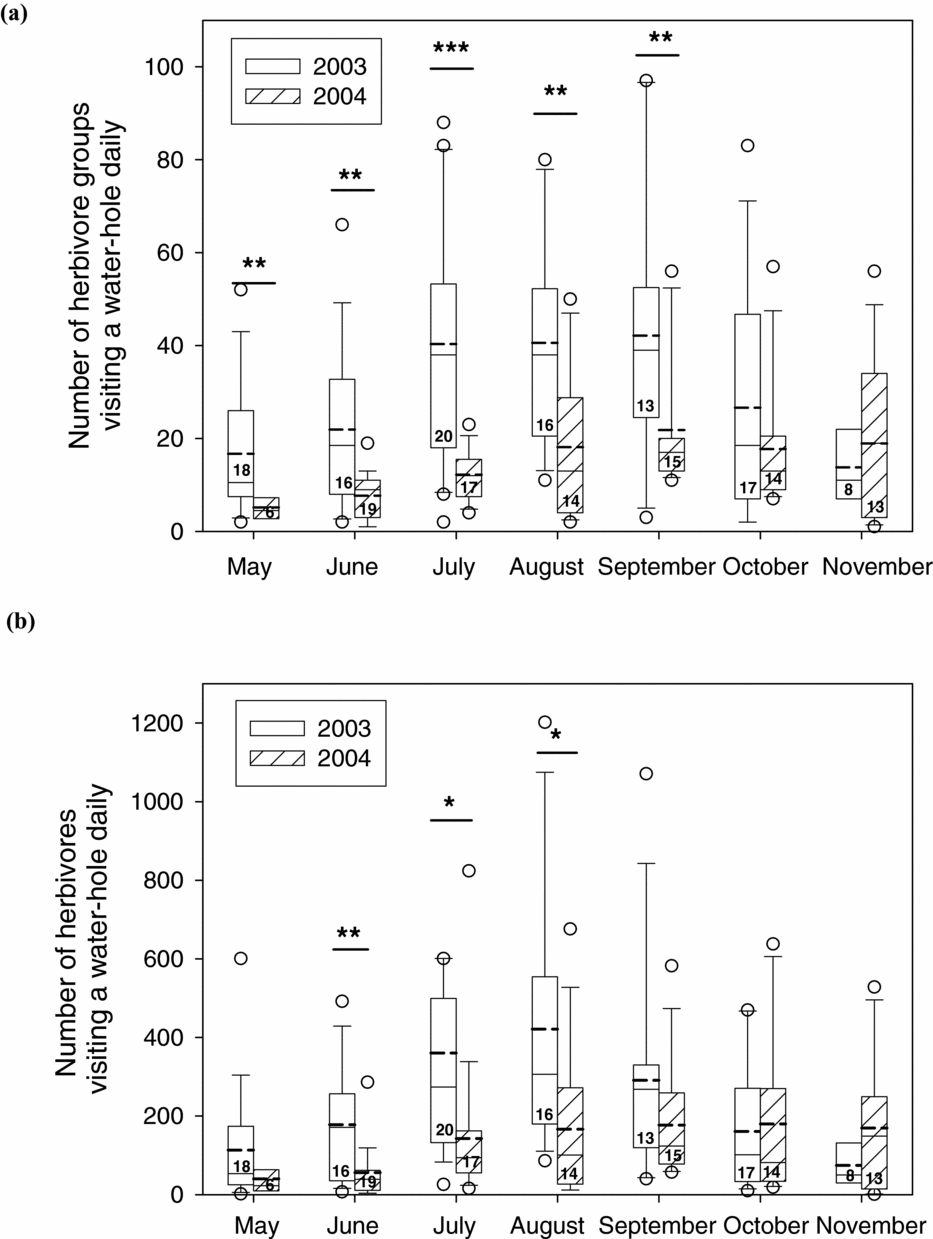
The number of herbivore groups visiting a water-hole daily was significantly higher in 2003 for the whole strict dry season and the difference between the two years was particularly large in July, August and September (Figure 3a). The temporal dynamics in the use of water-holes by herbivore groups was different between the two years: in 2004 the increase in the number of herbivores at water-holes was progressive and reached a maximum in September (mean number of groups visiting a water-hole daily = 22) with imperceptible decrease in use in October and November, whereas in 2003 the number of herbivore groups visiting a water-hole daily reached a high plateau (~41 groups of herbivores visiting a water-hole daily) from July to August and the use of water-holes significantly dropped in October and November (Figure 3a). Similar patterns were detected with the number of individual herbivores visiting a water-hole daily (Figure 3b).
Number of common herbivore groups (a) and individuals (b) visiting a water-hole daily in Hwange National Park, Zimbabwe. Boxes show medians, 25% and 75% quartiles. Bold dashed lines indicate means. Whiskers indicate the range between 10% and 90% percentiles. Dots represent data outside this range. The level of significance of the t-test is indicated with * when the test is significant at the level P < 0.05, ** at the level P < 0.01, and *** at the level P < 0.001. Sample sizes (monitoring sessions) are shown in the boxes.
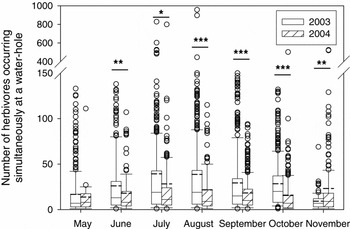
As a consequence, the level of herbivore aggregation (i.e. the number of herbivores occurring simultaneously at a water-hole) was significantly higher in 2003 for the period June–October (Figure 4). It was also significantly lower in November. In 2003, the mean number of herbivores occurring simultaneously at a water-hole peaked around 39 in July–August, whereas in 2004 it peaked at 28 in July (Figure 4). 2003 was characterized by the existence of extremely high numbers of herbivores simultaneously present at a water-hole with regular sightings of more than 100 herbivores occurring simultaneously at a water-hole (Figure 4).
Level of herbivore aggregation at water-holes in the dry season in Hwange National Park, Zimbabwe, represented by the number of common herbivores that visited a water-hole simultaneously. Boxes show medians, 25% and 75% quartiles. Bold dashed lines indicate means. Whiskers indicate the range between 10% and 90% percentiles. Dots represent data outside this range. The level of significance of the t-test is indicated with * when the test is significant at the level P < 0.05, ** at the level P < 0.01, and *** at the level P < 0.001.

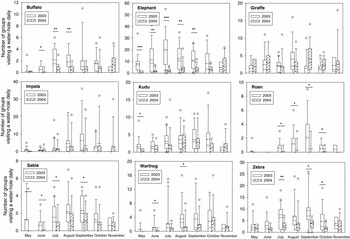
Figure 5 shows that the general pattern revealed in Figure 3 reflects the pattern of water-hole use by most herbivore species. For elephants, the mean number of groups visiting a water-hole daily was significantly higher in 2003 for the whole strict dry season (Figure 5). This was also the case (with mean number of groups visiting a water-hole daily significantly higher in 2003 for some months of the strict dry season) for all grazers (buffalo, roan, zebra, sable and to a lesser extent warthog) (Figure 5). No significant difference was found for browsers (giraffe, kudu and impala) in spite of a tendency for higher use of water-holes in 2003 during the strict dry season for kudu and impala (Figure 5). There was a clear difference between 2003 and 2004 in the temporal dynamics of dry-season water-hole use by elephant, roan, zebra, sable, warthog and impala (Figure 5).
Number of groups visiting a water-hole daily for each common large herbivore species in Hwange National Park, Zimbabwe. Boxes show medians, 25% and 75% quartiles. Bold dashed lines indicate means. Whiskers indicate the range between 10% and 90% percentiles. Dots represent data outside this range. The level of significance of the t-test is indicated with * when the test is significant at the level P < 0.05, ** at the level P < 0.01, and *** at the level P < 0.001.

DISCUSSION
The increasing use of water sources by elephants with decreasing annual rainfall has been the focus of a few recent studies (Chamaillé-Jammes et al. Reference CHAMAILLÉ-JAMMES, VALEIX and FRITZ2007a, Reference CHAMAILLÉ-JAMMES, FRITZ, VALEIX, MURINDAGOMO and CLOBERT2008). This study extends this finding to several species of common African herbivores and further suggests a strong effect of annual rainfall on the temporal dynamics of water sources use by large herbivores in the dry season in a semi-arid savanna. The results clearly show that water-holes were used by herbivores more intensively in 2003 (drought) than in 2004 (year of average rainfall), and were used intensively earlier in the dry season in 2003. The underlying mechanism is the quicker diminution of surface water sources in a dry year (Chamaillé-Jammes et al. Reference CHAMAILLÉ-JAMMES, FRITZ and MURINDAGOMO2007b, Redfern et al. Reference REDFERN, GRANT, GAYLARD and GETZ2005) forcing herbivores to drink from fewer water sources. Because of the different temporal dynamics of water-hole use, the month characterized by the highest level of water-hole use, i.e. potential water stress for herbivores, is likely to differ between years. In 2003, the peak of the dry season in terms of access to water by herbivores started early (July), lasted 3 mo, and reached levels of use far higher than in 2004 (the mean number of herbivore groups visiting a water-hole daily in July was almost four times higher in 2003). Traditionally, the end of the dry season (September–October) was considered as the peak of the dry season. However, the mean number of groups visiting a water-hole daily at the end of the dry season in 2004 was equivalent to that of the beginning of the dry season in 2003. These results strongly suggest that annual rainfall should be taken into account when predicting the peak of the dry season. This study is based on the comparison of only two years of contrasting rainfall and a comparison of multiple years will be needed to show that the pattern described here is consistent between dry and wet years.
Additionally, the dynamics of water-hole use in October–November after the very first rains also differed: whereas in 2004 the level of water-hole use remained the same as in October, it dropped significantly in 2003. It is possible that the very high level of herbivore aggregation at water-holes from July 2003, particularly that of elephants, impacted the surrounding vegetation to an extreme level of depletion that forced herbivores to move from water-hole areas as soon as the water constraint is at least partly alleviated, i.e. when animals are able to drink from puddles filled with rain water from the very first rains (see also Ayeni Reference AYENI1975). Indeed, the increased abundance of herbivores in the vicinity of water-holes during the dry season creates utilization gradients in herbivore pressure, creating a so-called ‘piosphere’ effect (Thrash & Derry Reference THRASH and DERRY1999), even though heterogeneity remains high within piospheres in HNP (Chamaillé-Jammes et al. Reference CHAMAILLÉ-JAMMES, FRITZ and MADZIKANDA2009).
Water-holes might differ in quality beyond having water or not. For example, the mineral concentration of water (Chamaillé-Jammes et al. Reference CHAMAILLÉ-JAMMES, FRITZ and HOLDO2007c) is likely to differ. In addition, heterogeneity of resource distribution other than water and interspecific competition may have large-scale impacts on herbivore distribution in a way that may influence water-hole-use choice (Redfern et al. Reference REDFERN, RYAN and GETZ2006). Finally, if water-holes have nearby water-holes, this may also influence the potential burden of use (Ryan & Getz Reference RYAN and GETZ2005). However, all study water-holes appeared to have similar levels of herbivore use and there was no clear difference in seasonal dynamics of water-hole use among the different study water-holes. This suggests that the change in use of water-holes by herbivores and associated herbivore aggregation level was homogeneous throughout the landscape.
The general trend (higher and earlier use of water-holes in 2003) holds for all herbivore species except giraffe (probably because giraffe is the least water-dependent species). However, the difference depicted between 2003 and 2004 was significant for most grazers (the differential use of water-holes is extreme for roan with almost no roan observed at water-holes in 2004 in contrast to 2003), whereas it was only a tendency for most browsers. These results support the suggestion that the susceptibility of herbivores to water dependence is not equal among different species of herbivore and that browsers may be less dependent on access to surface water than grazers. Browser distribution in African savanna landscape is indeed less influenced by the distribution of water sources (Redfern et al. Reference REDFERN, GRANT, BIGGS and GETZ2003, Valeix et al. Reference VALEIX, FRITZ, LOVERIDGE, DAVIDSON, HUNT, MURINDAGOMO and MACDONALD2009a, Reference VALEIX, LOVERIDGE, CHAMAILLÉ-JAMMES, DAVIDSON, MURINDAGOMO, FRITZ and MACDONALD2009b) and browsers are less susceptible to the trade-off between surface water constraints and nutritional requirements (Redfern et al. Reference REDFERN, GRANT, BIGGS and GETZ2003). This study strongly suggests that different susceptibilities to water dependence also translate into different levels of water-hole use in a drought.
The elephant is one of the species that showed the largest difference in use of water-holes between 2003 and 2004. First, because of their very large body size, elephants need to access water regularly and drink large amount of water daily (Owen-Smith Reference OWEN-SMITH1988). Second, in years of average or good rainfall, elephants use water-holes mainly during the night, but their mean arrival time at water-holes shifts towards earlier time of day with decreasing rainfall (Valeix et al. Reference VALEIX, CHAMAILLÉ-JAMMES and FRITZ2007). Hence, elephant aggregation at water-holes during the day is largely dictated by surface water availability, which is in turn influenced by annual rainfall. The influence of surface water availability on elephants appears to be a major determinant of both elephant spatial distribution (Chamaillé-Jammes et al. Reference CHAMAILLÉ-JAMMES, VALEIX and FRITZ2007a) and population dynamics (Chamaillé-Jammes et al. Reference CHAMAILLÉ-JAMMES, FRITZ, VALEIX, MURINDAGOMO and CLOBERT2008).
The mean level of herbivore aggregation at water-holes was significantly higher in 2003, which was characterized by some extremely high aggregation levels (regular sightings of more than 100 herbivores occurring simultaneously at a water-hole – sometimes up to 1000 herbivores). The temporal dynamics of aggregation also differed. Aggregation of herbivores at water-holes may have several implications in terms of social interactions (Ritter & Bednekoff Reference RITTER and BEDNEKOFF1995), disease transmission (Gortázar et al. Reference GORTÁZAR, AVECEDO, RUIZ-FONS and VICENTE2006, Grenfell & Dobson Reference GRENFELL and DOBSON1995), intra- and inter-specific competition (Chamaillé-Jammes et al. Reference CHAMAILLÉ-JAMMES, FRITZ, VALEIX, MURINDAGOMO and CLOBERT2008, Valeix et al. Reference VALEIX, CHAMAILLÉ-JAMMES and FRITZ2007). Additionally, the temporal dynamics of prey aggregation at predictable sites such as water-holes may have implications for the ecology of large carnivores (Valeix et al. Reference VALEIX, LOVERIDGE, DAVIDSON, MADZIKANDA, FRITZ and MACDONALD2010). Understanding the temporal dynamics of water sources use by large herbivores in semi-arid ecosystems and the determinants of this dynamics is fundamental for a sound management of surface water in these ecosystems, and for ultimately understanding the implications of surface water management for the functioning of herbivore community.
ACKNOWLEDGEMENTS
The Director General of the Zimbabwe Parks and Wildlife Management Authority is acknowledged for providing the opportunity to carry out this research and for permission to publish this manuscript. Marion Valeix was supported by a PhD grant from the French Ministère de la Recherche. This research was carried out within the framework of the CNRS-CIRAD HERD program (Hwange Environmental Research Development), funded by the French Ministère des Affaires Etrangères, the Ambassade de France au Zimbabwe, the CIRAD, the CNRS, the IFB Global Change and Biodiversity, and the ANR FEAR (ANR-08-BLAN-0022). I sincerely thank Hervé Fritz, my PhD supervisor, for his eternal advice and Sébastien Le Bel, CIRAD representative in Zimbabwe for his helpful support for fieldwork. I thank Simon Chamaillé-Jammes and one anonymous referee for their fruitful comments on a previous draft of this manuscript and Andrew Loveridge for his help in improving the language of this manuscript. Special thanks go to the rangers, students and volunteers who participated in the fieldwork.