


Research Highlights
-
Non-plastic reusable shopping bags are environmentally friendly alternatives to single-use plastic shopping bags.
-
Attitude and personal norms emerged as major predictors of consumers’ intention to use non-plastic reusable shopping bags.
-
The inclusion of personal norms and descriptive norms enhanced the explanatory power of the theory of planned behaviour.
-
The moderating effect of habit strength on intention–behaviour relationships was not supported.
-
Rational and norm-based strategies are recommended for stimulating the use of non-plastic reusable shopping bags.
Introduction
Litter from single-use plastic shopping bags (SUPBs) is characterised as a contemporary environmental problem (Karlaitė, Reference Karlaitė2016). The global carbon footprint attributed to SUPBs is estimated to range from 100 to 300 million tonnes of CO2 equivalent per annum (Silvarrey & Phan, Reference Silvarrey and Phan2016). Statistics suggest that 50 per cent of SUPBs are discarded after only one use (Mathalon & Hill, Reference Mathalon and Hill2014). The adverse environmental effects of SUPBs, which have necessitated global action, range from land, marine and air pollution and clogging of waterways (Oyake-Ombis, Van Vliet & Mol, Reference Oyake-Ombis, van Vliet and Mol2015). Global interventions to curb the use of SUPBs include taxes, levies, bans and recycling (Muralidharan & Sheehan, Reference Muralidharan and Sheehan2016). Argentina, Bangladesh, Kenya and Rwanda are some of the countries that have outlawed the use of SUPBs (Larsen & Venkova, Reference Larsen and Venkova2014). In South Africa, the contextual setting of this study, a plastic bag tax, recycling and antiplastic bag campaigns are being implemented. However, these interventions have achieved limited success due to poor implementation and enforcement (McLellan, Reference McLellan2014). As a result, the behaviour of using non-plastic reusable shopping bags (NPRSBs) is being promoted as a long-term solution to the problem of SUPBs litter (Muralidharan & Sheehan, Reference Muralidharan and Sheehan2016). NPRSBs are considered to be environmentally friendly because they biodegrade and are designed to be reused several times before being discarded, thereby minimising environmental pollution (Muralidharan & Sheehan, Reference Muralidharan and Sheehan2016).
Although the environmental benefits of using NPRSBs are widely acknowledged, to date, their use is known to be very low in many countries (Yeow, Dean & Tucker, Reference Yeow, Dean and Tucker2014). The low reuse rate of NPRSBs is mirrored in South Africa in spite of a heightened sense of environmental concern (McLellan, Reference McLellan2014). Although precise statistics are not readily available, major retailers that promote reusable shopping bags, such as Woolworths Holdings Limited and Pick n Pay Limited, have reported that the use of NPRSBs in South Africa remains very low (Pick n Pay, 2016; Woolworths Holdings Limited, 2016). The existing literature identifies consumers’ inability to entrench the habit of carrying NPRSBs as the major impediment (Ohtomo & Ohnuma, Reference Ohtomo and Ohnuma2014). Moreover, the intention–behaviour gap still characterises the use of NPRSBs (Muralidharan & Sheehan, Reference Muralidharan and Sheehan2016). This gap manifests itself when individuals who report favourable intentions to use NPRSBs fail to translate their intentions into behavioural performance.
Until now, empirical research into the factors influencing the behaviour of using NPRSBs has not attracted much interest in emerging economies. As far as we can establish, no empirical study in South Africa has examined the factors that influence consumers’ behaviour of using NPRSBs. Such a study is important, given the magnitude of plastic bag litter in South Africa’s land and marine environments (McLellan, Reference McLellan2014). In addition, in 2015, South Africa was ranked among the top 20 countries with plastic-littered coastal areas (Jambeck, Geyer, Wilcox et al., Reference Jambeck, Geyer, Wilcox, Siegler, Perryman, Andrady, Narayan and Law2015). From a global environmental sustainability perspective, emerging markets such as South Africa, India, Brazil and China continue to be major contributors to environmental pollution and greenhouse gas emissions (Jambeck et al., Reference Jambeck, Geyer, Wilcox, Siegler, Perryman, Andrady, Narayan and Law2015). As emerging markets are regarded as future conduits for global economy growth, this study seeks to provide input to global initiatives aimed at addressing plastic bag pollution.
Moreover, in spite of the important role of reuse as a strategy to manage non-renewable resources, past studies (e.g., Suthar, Rayal & Ahada, Reference Suthar, Rayal and Ahada2016) have mainly concentrated on macroeconomic factors influencing reuse, with only a limited focus on individual factors. Moreover, most of the previous studies focusing on individual factors have relied mainly on the theory of planned behaviour (TPB) to predict the factors that influence the behaviour of using NPRSBs (e.g., Lam & Chen, Reference Lam and Chen2006; Ohtomo & Ohnuma, Reference Ohtomo and Ohnuma2014). The findings of these studies reflect the weakness of the TPB that is, the existence of the intention–behaviour gap. By employing a modified TPB, this study seeks to contribute to theory by bridging the intention–behaviour gap. In addition, as a response to calls by Klöckner (Reference Klöckner2013) and Chan and Bishop (Reference Chan and Bishop2013) to improve the explanatory power of the TPB, this study modified the TPB by adding variables such as ‘personal norm’, ‘descriptive norm’ and ‘habit strength’. Moreover, this study tests whether perceived behavioural control and habit strength moderate intention and behaviour relationship. This study also seeks to contribute to efforts to formulate long-term strategies that promote the behaviour of using NPRSBs.
Literature Review
Use of NPRSBs as a form of pro-environmental behaviour
The majority of the environmental challenges confronting humanity, ranging from the depletion of the ozone layer to pollution, are rooted in human behaviour (Antal & Drews, Reference Antal and Drews2015; Martinez-Espineira, Garcia-Valina & Naughes, Reference Martinez-Espineira, Garcia-Valina and Naughes2014). One of the sectors in which human behaviour contributes significantly to environmental problems is the retail grocery sector (Koenig-Lewis, Palmer, Demody & Urbye, Reference Koenig-Lewis, Palmer, Dermody and Urbye2014). This is because the widespread use of plastic bags in this sector, and the irresponsible disposal thereof, has become a significant environmental problem (Yeow et al., Reference Yeow, Dean and Tucker2014). The behaviour of using NPRSBs is being increasingly promoted with the objective of enhancing environmental well-being.
Use of NPRSBs: A modified TPB perspective
A modified TPB is employed to examine underlying factors that influence the behaviour of using NPRSBs. The TPB argues that intention is the most immediate determinant of behaviour and that intention is directly influenced by attitude towards behaviour, subjective norms and perceived behavioural control (Ajzen, Reference Ajzen1991). Although the TPB posits that intention predicts behaviour, a study on reusable bags by Yeow et al. (Reference Yeow, Dean and Tucker2014) showed that favourable intentions do not always translate into behavioural performance. The prevalence of the intention–behaviour gap, which was also reported by Gifford (Reference Gifford2014), is cited as the major weakness of the TPB. The TPB’s proposition that intention is the most direct antecedent of behaviour is also a matter of academic contest (Sarkis, Reference Sarkis2017; Triandis, Reference Triandis1977). For instance, Triandis’ (Reference Triandis1977) theory of interpersonal behaviour (TIB) argues that, in the case of routinised behaviour, habit strength influences behaviour more than intention does. There are also concerns about how perceived behaviour control is operationalised within the TPB (Davies, Foxall & Pallister, Reference Davies, Foxall and Pallister2002). The TPB operationalised perceived behaviour control as a measure of an individual’s control beliefs to engage in behaviour (Ajzen, Reference Ajzen1991). By conceptualising perceived behavioural control in this manner, Manstead and Parker (Reference Manstead and Parker1995) contend that the influence of external situational factors is not considered. In the case of NPRSBs, Yeow et al. (Reference Yeow, Dean and Tucker2014) note that situational factors influencing behaviour, such as price and availability, are often beyond the control of consumers.
Concerns have also been raised about the subjective norm construct (Armitage & Conner, Reference Armitage and Conner2001; Paul, Modi & Patel, Reference Paul, Modi and Patel2016). In a study conducted by Paul et al. (Reference Paul, Modi and Patel2016), subjective norms only managed to explain five per cent of the variance in intention. This is attributed to the narrow operationalisation of the subjective norm construct (Davies et al., Reference Davies, Foxall and Pallister2002). The theorisation of subjective norm in the TPB is regarded as more inclined towards external norms than internalised norms (Wall, Devine-Wright & Mill, Reference Wall, Devine-Wright and Mill2007). To enhance the potency of subjective norms in promoting behaviour, Mancha and Yoder (Reference Mancha and Yoder2015) recommend that the construct should be subdivided into injunctive and descriptive norms. With regard to the performance of pro-environmental behaviour, Martin, Weiler, Reis et al. (Reference Martin, Weiler, Reis, Dimmock and Scherrer2017) note that descriptive norms exert more pressure on an individual to comply with the approved behaviour than do injunctive norms. This is because descriptive norms emphasise the visible behavioural actions undertaken by others in a social group with which each member is expected to comply (Martin et al., Reference Martin, Weiler, Reis, Dimmock and Scherrer2017). Empirical studies have shown that descriptive norms predict intention more than do injunctive norms (De Leeuw, Valois, Ajzen & Schmidt, Reference De Leeuw, Valois, Ajzen and Schmidt2015). Thus, personal norms, description norms and habit strength are added to the TPB, consistent with Ajzen’s (Reference Ajzen1991) view that the theory is subject to the addition of other variables that have the potential to increase its explanatory power.
Conceptual model
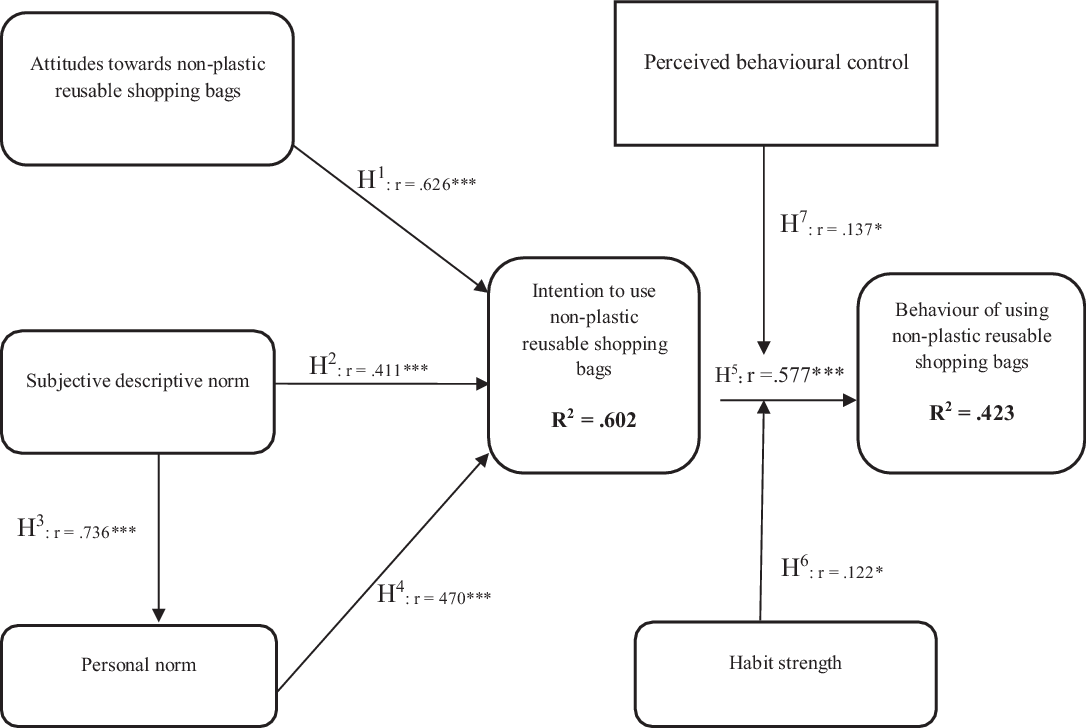
Drawing from the TPB proposition, the research model employed in this study posits that attitude and subjective descriptive norms are direct antecedents of the intention to use NPRSBs. This study also proposes that personal norms have a direct effect on intention and that descriptive norms directly influence the formation of personal norms. In line with the TPB, this study predicts a direct relationship between intention and behaviour. Drawing from the TIB (Triandis, Reference Triandis1977), the model also argues that habit strength moderates the relationship between intention and the actual behaviour of using NPRSBs. Following the TIB, which employed facilitating conditions as a proxy for perceived behavioural control, we argue that perceived behavioural control also moderates the association between intention and the actual behaviour of using NPRSBs. Figure 1 presents the research model.
Research model.

Hypotheses development
Consistent with the research model outlined in Figure 1, the hypotheses below were posited.
Attitude towards use of reusable shopping bags and intention
‘Attitude’ refers to the positive or negative feelings associated with using NPRSBs. The TPB postulates that, if an individual develops a favourable disposition towards a given behaviour, the intention to perform such behaviour is strengthened (Ajzen, Reference Ajzen1991). Past pro-environmental behaviour studies have shown that attitude has a direct effect on intention (Klöckner, Reference Klöckner2013; Paul et al., Reference Paul, Modi and Patel2016). However, other studies (Bamberg, Reference Bamberg2003; Mahmud & Osman, Reference Mahmud and Osman2010) have found a negative effect of attitude on behavioural intention, resulting in what is known as the attitude–intention gap. To bridge the attitude–intention gap, Bamberg (Reference Bamberg2003) emphasises the importance of measuring an individual’s attitude towards specific as opposed to general behaviour. This study focuses on the specific behaviour of using NPRSBs and posits that:
H1: Attitude positively influences South African consumers’ intention to use NPRSBs.
Subjective descriptive norms and intention
Subjective descriptive norms reflect the extent to which an individual perceives that an important social group is using NPRSBs. Moral socialisation theory is central to the development of subjective descriptive norms (Cialdini, Reno & Kallgren, Reference Cialdini, Reno and Kallgren1990). In pro-environmental behaviour studies, ‘descriptive norm’ refers to what individuals do to protect the natural environment (Chan & Bishop, Reference Chan and Bishop2013). Empirical studies have shown a direct positive association between subjective descriptive norms and behavioural intention (Arpan, Barooah & Subramany, Reference Arpan, Barooah and Subramany2015; De Leeuw et al., Reference De Leeuw, Valois, Ajzen and Schmidt2015). In a study by De Leeuw et al. (Reference De Leeuw, Valois, Ajzen and Schmidt2015), descriptive norms managed to explain 29 per cent of the variance in intention. Thus, consistent with the literature reviewed and with past studies, it is hypothesised that:
H2: Subjective descriptive norms positively influence South African consumers’ intention to use NPRSBs.
Subjective descriptive norms and personal norms
Subjective descriptive norms have the potential to foster the development of personal norms when internalised in an individual’s value system (Ahn, Koo & Chang, Reference Ahn, Koo and Chang2012). Based on the norm activation theory (Schwartz, Reference Schwartz1977), personal norms are formed through the process of socialisation. Past studies have shown that subjective descriptive norms have a positive influence on personal norms (Chan & Bishop, Reference Chan and Bishop2013; Hernandez, Martin, Ruiz & Hidalgo, Reference Hernandez, Martin, Ruiz and Hidalgo2010). In a study conducted by Hernandez et al. (Reference Hernandez, Martin, Ruiz and Hidalgo2010), descriptive norms managed to explain 49 per cent of the variance in personal norms. The following hypothesis is thus postulated:
H3: Descriptive norms positively influence South African consumers’ personal norms related to the use of NPRSBs.
Personal norms and intention
‘Personal norms’ denote an individual’s moral obligation to use NPRSBs. Personal norms are internalised values and feelings of obligation that are formed when individuals are conscious of the adverse effects of their behaviour (Schwartz & Howard, Reference Schwartz, Howard, Rushton and Sorrentino1981). Compliance with personal norms engenders a sense of pride, while the violation of personal norms triggers feelings of guilt (Onel, Reference Onel2017; Prakash & Pathak, Reference Prakash and Pathak2017). The relationship between personal norms and behavioural intention was confirmed in meta-analysis studies (Bamberg & Möser, Reference Bamberg and Möser2007; Klöckner, Reference Klöckner2013). The decision to use NPRSBs is initiated at the individual level, so personal norms are expected to play a critical role. Based on the moral theory and on extant research, it is hypothesised that:
H4: Personal norms positively influence South African consumers’ intention to use NPRSBs.
Intention and actual behaviour
‘Intention’ captures the extent to which consumers are willing to use NPRSBs. The TPB postulates that intention is the direct predictor of behaviour (Ajzen, Reference Ajzen1991). The relationship between intention and behaviour was confirmed in several pro-environmental studies (Armitage & Conner, Reference Armitage and Conner2001; Bamberg & Moser, Reference Bamberg and Möser2007). There is also evidence suggesting that individuals do not always act on their reported intentions. According to Klöckner (Reference Klöckner2013), intentions are more likely to predict behaviour if individuals accurately assess the rationale of engaging in such behaviour in terms of its merits and demerits. Drawing from the TPB and the literature reviewed, it is hypothesised that:
H5: South African consumers’ intention to use NPRSBs directly influences their actual behaviour.
Habit strength as a moderator of intention and behaviour relationship
Habit theory suggests that behaviour is not always an outcome of reasoned processes, as is posited by the TPB (Marechal, Reference Marechal2010; Triandis, Reference Triandis1977). On the contrary, the TIB postulates that habits tend to influence the performance of behaviour more than intentions do in the case of repeated behaviours (Triandis, Reference Triandis1977). In practice, the process of changing behaviour involves the disruption of old habits and fostering the formation of new ones (Marechal, Reference Marechal2010). Habit strength was shown to moderate the relationship between intention and behaviour (De Vries, Aarts & Midden, Reference De Vries, Aarts and Midden2011; Klöckner, Reference Klöckner2013). Thus, the following hypothesis is postulated:
H6: Habit strength moderates the association between intention and the actual behaviour of using NPRSBs.
Perceived behavioural control as a moderator of the intention–behaviour relationship
‘Perceived behavioural control’ refers to the objective existence of factors that either enable or constrain the use of NPRSBs. Previous studies have found that individuals’ perceptions of the existence of facilitating or constraining factors play a pivotal role in encouraging or discouraging behavioural performance (Kalamas, Cleveland & Laroche, Reference Kalamas, Cleveland and Laroche2014; Yeow et al., Reference Yeow, Dean and Tucker2014). For instance, Yeow et al. (Reference Yeow, Dean and Tucker2014) identified cost savings and incentives as factors that facilitate their use, while the inconvenience of always carrying a NPRSB on every shopping trip was cited as a barrier. Based on the TIB’s proposition that facilitating conditions have a moderating effect on the intention–behaviour relationship, it is hypothesised that:
H7: Perceived behaviour control moderates the effect of intention on the actual behaviour of using NPRSBs.
Materials and Methods
Procedure
This study employed a post-positivistic philosophy to test the posited hypotheses among consumers in South Africa’s grocery retail sector. The data for this study were collected by trained fieldworkers with the aid of a structured questionnaire, using the mall-intercept technique. The data were collected for a period of three months, from August to October 2017.
Sample profile
Consumers residing in South Africa’s Gauteng Province and who regularly shop at retailers promoting the use of NPRSBs were targeted. Six hundred questionnaires were distributed, out of which the responses from 487 participants were considered valid for analysis. Table 1 shows the sample profile.
Sample profile

** With regard to family monthly income, the exchange was US$1 = ZAR13.50 when data were collected.
Measurement of constructs
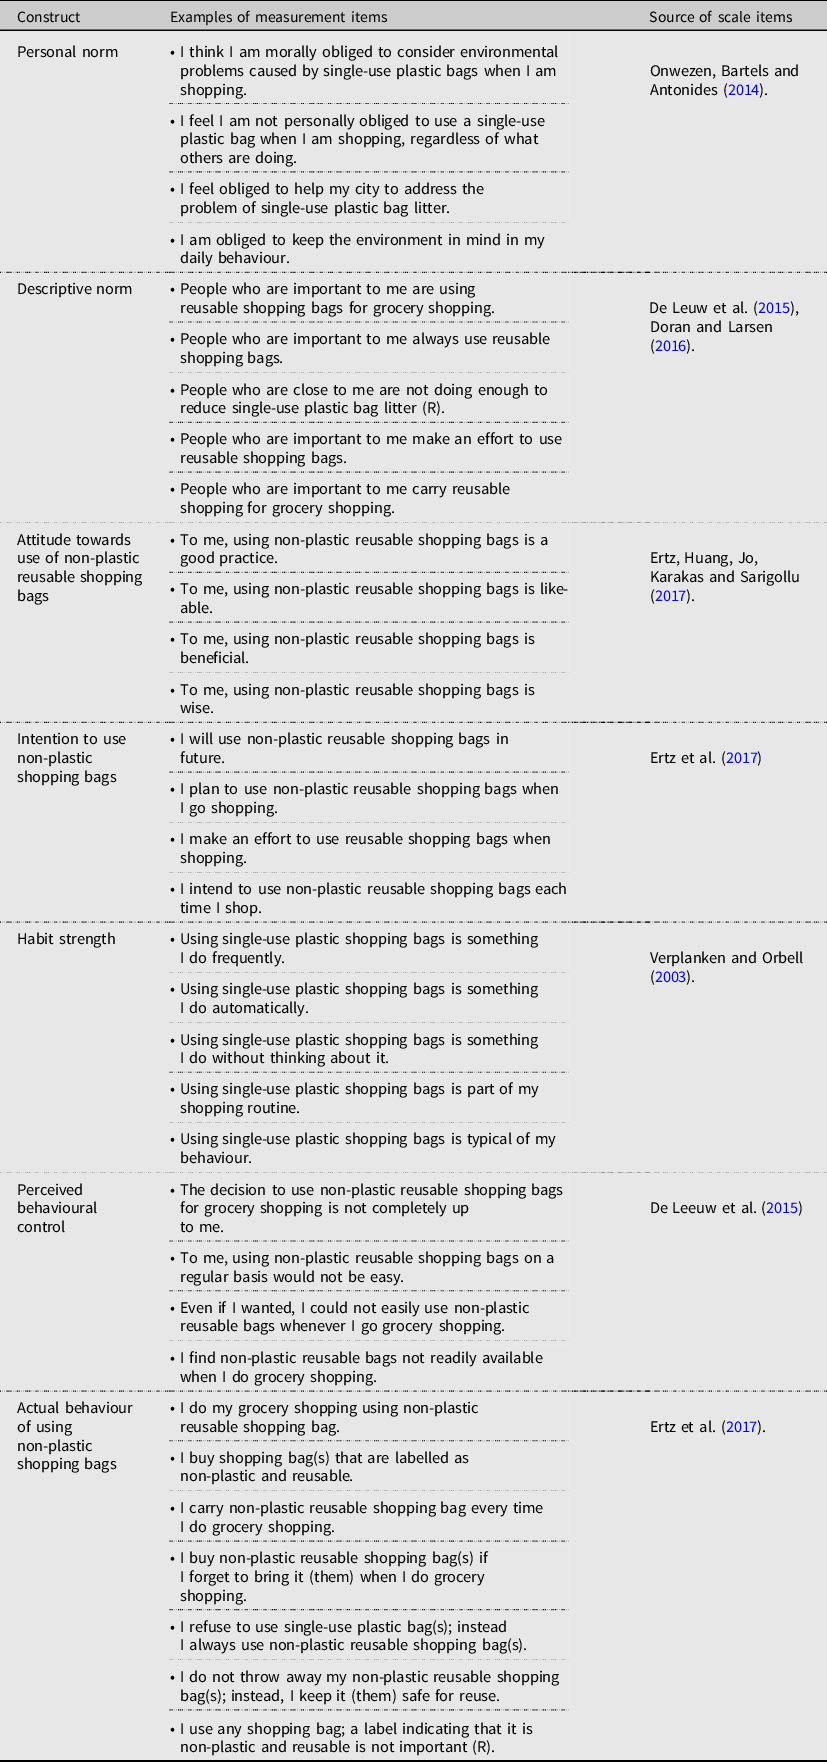
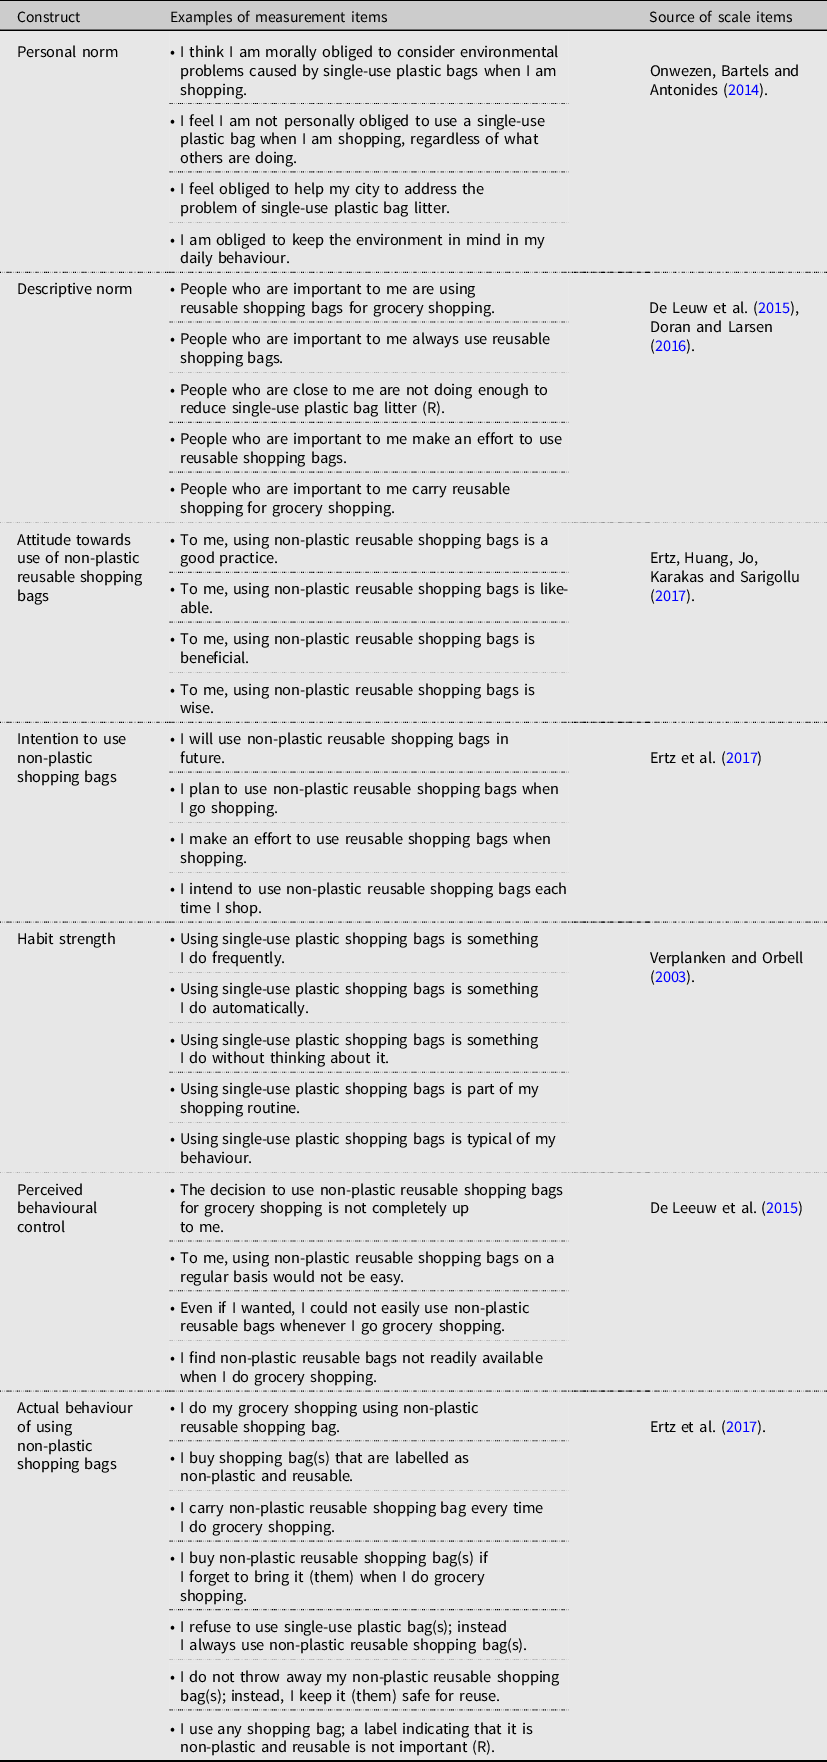
The measurement scale items utilised to measure variables in this study were drawn from validated scales used in previous studies. A 7-point Likert-scale responding format was used to measure all the variables. Table 2 shows how the variables in this study were operationalised.
Operationalisation of constructs
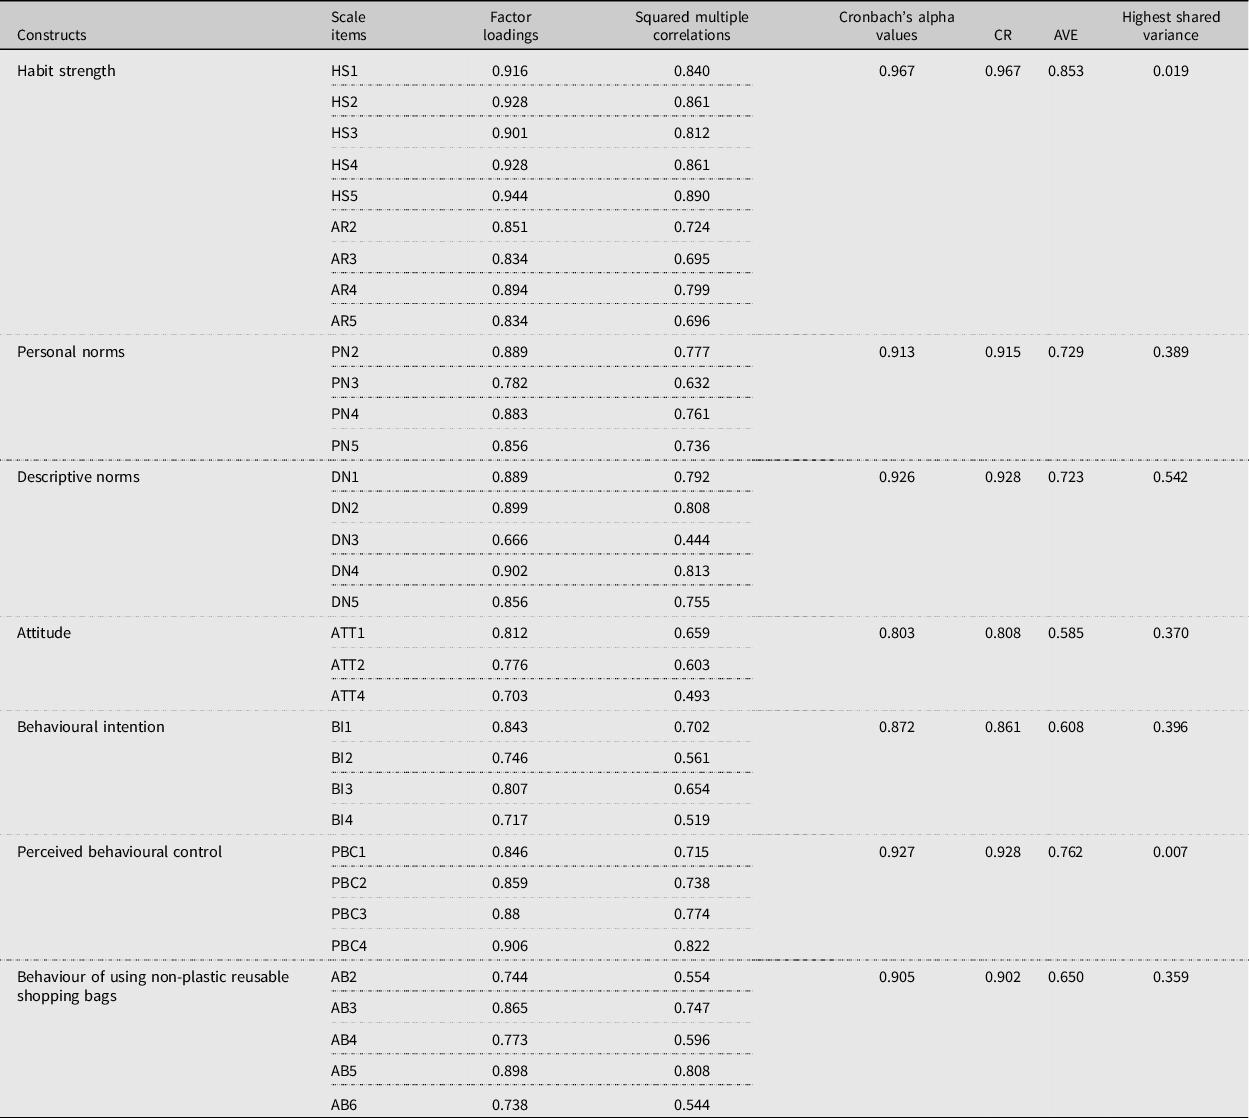
The reliability and validity indicators of the measurement scale items are reported in Table 3.
Reliability and validity indicators

Data Analysis and Results
SPSS version 25 was used for the descriptive statistics, data normality, and common method bias (CMB) assessment. AMOS version 25 was used to validate the measurement and structural models, path analysis, and the moderation analysis.
Assessment of normality and CMB
Data normality was assessed using measures of skewness and kurtosis. The skewness values were between −1.126 and 0.221, while the kurtosis values ranged from −1.386 to 0.924. All the values were within the recommended threshold of −2 to +2 (George & Mallery, Reference George and Mallery2010). Thus, the data used in this study were fairly normal and satisfied the requirements of conducting structural equation modelling. Harman’s single factor test was used to assess CMB. CMB was not an issue in this study, as the highest single factor from un-rotated factor analysis was 37.134 per cent, less than the recommended threshold of 50 per cent (Gaskin, Reference Gaskin2011).
Structural equation modelling
Consistent with Anderson and Gerbing’s (Reference Anderson and Gerbing1988) recommendation, two steps were followed in conducting structural equation modelling. The measurement model was assessed using confirmatory factor analysis, followed by the estimation of the structural model and path analysis.
Measurement model assessment
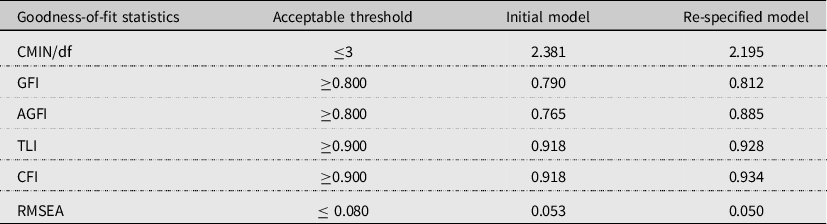
The measurement model consisted of seven latent variables and thirty-three indicator variables. The measurement model was assessed with the aid of the maximum-likelihood estimation technique. The initial assessment of the measurement model yielded unsatisfactory goodness-of-fit indices (GFIs = 0.790; AGFI = 0.765). An inspection of standardised residual covariance was done to check the discrepancy between the proposed model and the estimated model. The following scale items were deleted due to residual values above the acceptable threshold of 0.4 (Hair, Sarstedt, Ringle & Mena, Reference Hair, Sarstedt, Ringle and Mena2012): “When I go shopping, I feel morally obliged to use reusable shopping bags instead of single-use plastic bags” from the personal norm scale; “To me, using non-plastic reusable shopping bags is beneficial” from the attitude scale; and “I do my grocery shopping using non-plastic reusable shopping bag” and “I refuse to use single-use plastic bag(s); instead I always use non-plastic reusable shopping bag(s)”, both from the scale for the behaviour of using non-plastic shopping bag. The re-specified measurement model fitted well with the data, as shown by the goodness-of-fit indicators in Table 4.
CFA goodness-of-fit statistics

The measurement model also returned acceptable levels of reliability and validity as shown in Table 3.
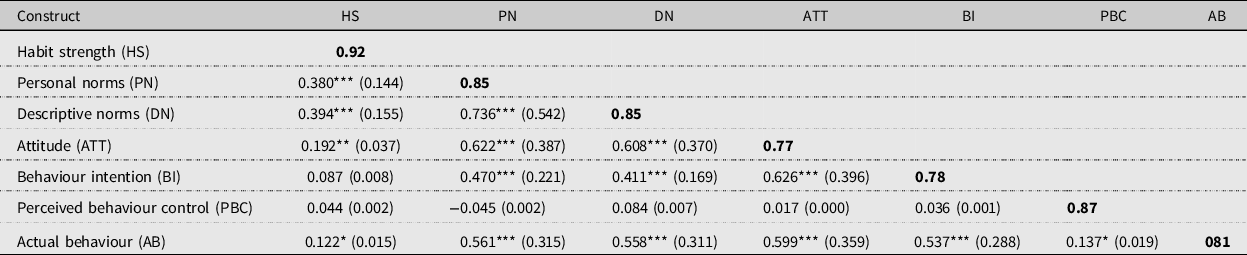
As shown in Table 3, internal consistency of measurement scales was attained as indicated by Cronbach’s alpha and composite reliability values of more than the recommended threshold of 0.70 (Kumar, Reference Kumar2014). The factor loadings and inter-item correlations for all measurement items surpassed the generally acceptable threshold of 0.5 (Hair et al., Reference Hair, Sarstedt, Ringle and Mena2012), signifying the attainment of convergent validity. As indicated in Table 5, all values of the square root of the average variance extracted were above the highest correlation of r = 0.736. Moreover, as indicated in Table 3, all the computed average variance extracted values were above the highest share variance of 0.593, which signifies the attainment of discriminant validity (Fornell & Larcker, Reference Fornell and Larcker1981). Table 5 provides the correlation matrix.
Correlation matrix

Note: Squared correlations are in brackets. Bolded values represent square root of AVE; * p < .05, ** p < . 01, *** p < .001.
Assessment of the structural model
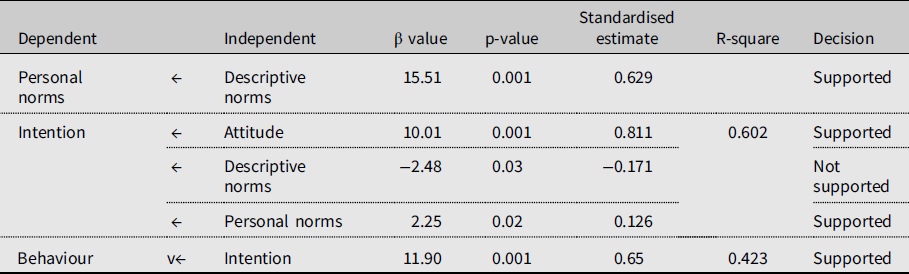
The fitness of the structural model was evaluated using the maximum likelihood estimation method. The proposed structural model fitted well with the data, as shown by goodness-of-fit measures (χ2 = 2635.083, df = 928; p < .001, CMIN/DF = 2.840, GFI = .809, TLI = .904, CFI = .910, RMSEA = .062). After achieving satisfactory model fit results, a path analysis was conducted. The posited relationships between the TPB variables were all positive and significant (attitude → intention = β10.01, p < .01; intention → Behaviour = β11.90, p < .001). As predicted, hypotheses H1 and H5 were supported. The posited positive relationship between subjective descriptive norms and intention was not confirmed by the data (β = −2.48, p < .03). In fact, the study found a significant negative relationship between the two constructs. As a result, H2 was not supported. The path from descriptive norms to personal norms (H3) was also supported (β15.51, p < .01). The path from personal norms to intention was supported by the data (β 2.25, p < 0.02), thereby supporting H4. In terms of the predictors of the intention to use NPRSBs, attitude had the greatest effect, followed by personal norms, while descriptive norms had a negative effect. In terms of explanatory power, attitude, personal norms and descriptive norms accounted for 60 per cent of the variance in intention. Intention accounted for 42 per cent of the variance in the behaviour of using NPRSBs. Table 6 provides the results of the hypotheses testing.
Hypotheses testing results

Moderation analysis
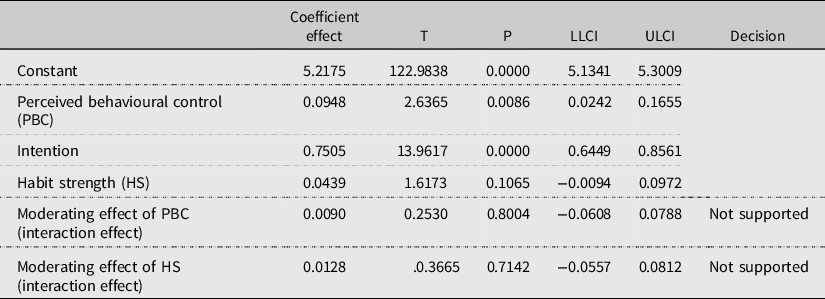
A moderation analysis was conducted using the PROCESS approach suggested by Hayes (Reference Hayes2018). All variables were mean-centred. The level of confidence (LLCI and ULCI) and the p-value of the interaction variable were considered to assess the moderation effect (Hayes, Reference Hayes2018). Table 7 provides the results of the moderation analysis.
Moderation analysis results

As shown in Table 7, the p-values for habit strength and perceived behavioural control were all above the recommended threshold of 0.05 (Hayes, Reference Hayes2018), suggesting the absence of moderation. Based on this result, H6 and H7 were not supported.
Figure 2 presents a graphical summary of the findings.
Graphical summary of findings.
Note: R2 = denotes to the variance explained in the dependent variable by the independent variable(s); r = correlation coefficient; * p < .05, ** p < . 01, *** p < .001.

Discussion of Results
Attitude emerged as the main predictor of consumers’ intention to use NPRSBs, confirming H 1. This result concurs with the findings of past studies that found that a favourable attitude towards behaviour plays a central role in fostering the formation of favourable behavioural intentions (Paul et al., Reference Paul, Modi and Patel2016; Prakash & Pathak, Reference Prakash and Pathak2017). For instance, in a study by Prakash and Pathak (Reference Prakash and Pathak2017), attitude positively influenced intentions related to the purchase of products in environmentally friendly packaging.
The results of this study refuting H 2 are not consistent with the previous studies (Arpan et al., Reference Arpan, Barooah and Subramany2015; De Leeuw et al., Reference De Leeuw, Valois, Ajzen and Schmidt2015). A possible explanation of this is that respondents in the study perceived that individuals they considered important were not using NPRSBs. In such instances, Wynveen, Wynveen and Sutton (Reference Wynveen, Wynveen and Sutton2015) note that individuals may be tempted not to participate in environmental behaviour in order to fit in with what the important others are doing, for fear of being seen as acting outside the prevailing norm. The findings in this study confirming H 3 suggest that descriptive norms play a critical role in assisting consumers to internalise the personal norms related to the use of NPRSBs. This result resonates with the norm activation theory’s proposition that social norms are instrumental in inculcating personal norms (Schwartz, Reference Schwartz1977). This result was also confirmed in past studies on environmental behaviour (Chan and Bishop, Reference Chan and Bishop2013; Jansson, Marell & Nordlund, Reference Jansson, Marell and Nordlund2010). It is important to note, though that, the existence of solid social norms and collective culture is key pre-conditions necessary for descriptive norms to be internalised as personal norms.
This finding supporting H 4 suggests that the more consumers perceive that they are morally obliged to use NPRSBs, the more they develop favourable behavioural intentions towards such behaviour. This result gains empirical support from previous studies, including that of Prakash and Pathak (Reference Prakash and Pathak2017), who found a strong positive effect of personal norm on intention to buy products in an environmentally friendly package. Similarly, in a meta-analysis conducted by Bamberg and Moser (Reference Bamberg and Möser2007), personal norms were the third largest predictor of pro-environmental behavioural intentions. Hypothesis H 5 was confirmed in this study. Moreover, intention managed to explain 42.3 per cent of the variance in the actual behaviour towards NPRSBs. This result suggests that the behaviour towards NPRSBs may be promoted by stimulating favourable behavioural intentions. This result reinforces the TPB’s central premise that intention is the main predictor of behavioural performance (Ajzen, Reference Ajzen1991).
H 6 , positing that the stronger the habit strength, the more likely it is to weaken the association between intention and actual behaviour, was not supported by the data. This result is in contrast with that of previous studies (De Vries et al., Reference De Vries, Aarts and Midden2011; Klöckner, Reference Klöckner2013) in which habit strength moderated the intention–behaviour relationship. This result may be explained by the process of behaviour habitualisation. Habit strength is more significantly reinforced when behaviour is routinised than when behaviour is occasional (Klöckner, Reference Klöckner2013). The majority of consumers surveyed in this study tend to conduct their grocery shopping monthly, and the low frequency of shopping behaviour may explain why the habits associated with the use of SUPBs were weak in this study.
H 7 was not supported by the data, suggesting that perceptions of behavioural control did not constrain the use of NPRSBs. This finding is not in accordance with previous studies (Numata & Mangi, Reference Numata and Mangi2012; Young, Hwang, McDonald & Oates, Reference Young, Hwang, McDonald and Oates2010). A possible explanation of this result is what Dagher and Itani (Reference Dagher and Itani2012) argued in noting that the growth in the market of reusable shopping bags facilitates easy access, which tends to reduce perceived barriers.
Implications of the Study
The results of this study offer valuable theoretical and managerial contributions to the evolving discipline of pro-environmental behaviour, particularly in the promotion of green consumerism and sustainable packaging. Compared with the standard TPB, the model used in this study explained a greater variance in behaviour – 42 per cent – than the average of 27 per cent explained by the TPB, thereby narrowing the intention–behaviour gap. The findings of this study also offer valuable insights to policymakers who intend to promote the mainstream use of NPRSBs. First, the study showed that entrenching favourable attitudes among consumers is crucial in promoting the use of NPRSBs. This could be done by emphasising the benefits of NPRSBs over SUPBs. As attitudes are significantly influenced by one’s rational of the merits of behavioural performance (Lee, Reference Lee2014), the present study recommends that environmental messages emphasise the environmental benefits and cost-saving advantages accruing to individuals who use NPRSBs. This recommendation echoes Peattie’s (Reference Peattie2001:194) call to “return to rationality” when structuring environmental messages.
Second, the study finding point to the need for the implementation of norm-based strategies that focus on changing the behaviour of important stakeholders who are perceived as points of reference when individuals are making a decision whether or not to use NPRSBs. In this regard, De Leeuw et al. (Reference De Leeuw, Valois, Ajzen and Schmidt2015) suggest that the family should be regarded as the prime socialisation unit for nurturing descriptive norms, while Yeow et al. (Reference Yeow, Dean and Tucker2014) recommended the use of opinion leaders. Other instruments that may be effective in promoting the adoption of descriptive norms include rewards (subsidies, nudges) or penalties (taxes). The use of subsidies or taxes gained support from Abrahamse, Steg, Vlek & Rothengatter (Reference Abrahamse, Steg, Vlek and Rothengatter2007), who note the pivotal role played by incentives in encouraging individuals to participate in environmental citizenship behaviours. Increasing single-use plastic bag tax and rewarding individuals who use NPRSBs have the potential to enhance the assimilation of descriptive norms.
Finally, the study noted the prominent role of personal norms in enhancing the formation of favourable intentions towards the use of NPRSBs. Thus, enhancing personal norms is a strategic imperative for policymakers because, when personal norms are embedded in individuals, the users of NPRSBs will be inner-directed, resulting in cost savings associated with the enforcement of environmental policies. To activate personal norms, Onel (Reference Onel2017) suggests that policymakers should focus on communicating both the favourable and the unfavourable consequences of behaviour. Such messages could focus on the challenges associated with the reluctance to use NPRSBs, such as pollution and the depletion of resources, and on the resultant benefits such as environmental sustainability. When personal norms related to the use of NPRSBs are formed and internalised, policymakers also need to focus on efforts that sustain established norms and minimise conditions that result in the deactivation of such norms.
Limitations and Future Research
This study has potential shortcomings that point to further research opportunities. The data used to test the posited hypotheses were collected in a once-off cross-sectional study, which meant that one could not track the factors that influence the use of NPRSBs over time. Future studies could employ a longitudinal time horizon in order to understand the factors that influence the use of NPRSBs in the long term. This study also used data generated from self-reports by respondents, and as a result, the findings may be susceptible to social desirability bias. To address this weakness, future studies could employ data collection methods that reduce the possibility of inflated responses, such as observations or field experiments. The model used in this study managed to explain 42 per cent of the variance in the actual behaviour of using NPRSBs. Future research could examine the effect of other factors, such as anticipated feelings, self-concept and value orientations.
Conclusion
This study has confirmed the ability of the modified TPB to explain the behaviour of using NPRSBs. Personal norms and attitude emerged as the major predictors of the intention to use NPRSBs, while descriptive norms had a negative effect. Habits and perceived behavioural control were shown not to moderate the behaviour of using NPRSBs. The study’s findings point to the need for the implementation of both rational and norm-based interventions. Rational environmental messages to South African consumers need to stress the economic, social and environmental benefits of using NPRSBs while emphasising the consequences of not using them. Normative messages should emphasise the benefits of participating in environmental citizenship behaviours such as the cost savings that accrue to the South African government as a result of a decrease in the costs associated with the enforcement of environmental laws. The South African government also needs to be more involved in the governance and promotion of NPRSBs. Currently, retailers set the price of reusable bags, and there are growing perceptions that they are profiteering from the sales of NPRSBs. In the long term, if these perceptions are not addressed, they may trigger consumer apathy.
Acknowledgements
The authors thank the anonymous reviewers who helped to improve the quality of this study.
Financial Support
This research received no specific grant from any funding agency, commercial or not-for-profit sectors.
Conflicts of Interest
The authors were not motivated by any interest in conducting this study.
Asphat Muposhi (PhD) is a Lecturer in the Department of Marketing Management at Midlands State University, Gweru, Zimbabwe. His research interests are in green marketing and environmental sustainability. He has published several articles in international peer-reviewed journals.
Mercy Mpinganjira (PhD) is a Professor and Director of the School of Consumer Intelligence & Information Systems, University of Johannesburg, South Africa. Her research interests are in consumer behaviour and sustainable marketing. She has extensively published in peer-reviewed journals.
Marius Wait (PhD) is an Associate Professor and Head of the Marketing Management Department, University of Johannesburg, South Africa. His research interests are in consumer behaviour, social marketing and sustainable marketing. He has published several articles in peer-reviewed journals.