

Introduction
Animal genetic resources are defined as animal species that are used, or may be used for the production of food and fibre (FAO, 2007). Livestock currently contribute about 30 percent of agricultural gross domestic product in developing countries, with a projected increase to about 40 percent by 2030. The World Bank has estimated that it will be necessary to increase meat production by about 80 percent between 2000 and 2030 (FAO, 2011). Sheep are very important in the socio-economic lives of the people of Nigeria (Abdullahi, Reference Abdullahi2002). However, their potential value is not realized because of low productivity resulting from high mortality and poor performance among others. Geographical isolation, natural and artificial selection for physical or productive characters, genetic drift, mutations and interpopulation gene flows have altered gene frequencies over many generations (Pariset et al., Reference Pariset, Mariotti, Gargani, Joost, Negrini, Perez, Bruford, Marsan and Valentini2011), and this could affect fitness and adaptive potentials of animals (Luikart and Allendorf, Reference Luikart and Allendorf1996). The current loss of genetic resources concerns not only the extinction of traditional breeds, but also the loss of genetic diversity within breeds (Taberlet et al., Reference Taberlet, Coissac, Pansu and Pompanon2011). In terms of biodiversity, conservation and utilization, these genetic resources require further identification and evaluation to assess their potential contribution to food and agricultural production in the future.
The initial step in characterization is identification of distinct populations using information on their geographic and ecological isolation, traditional nomenclatures (traditionally recognized populations), phenotypic distinctness and the level of genetic differentiation among the populations (Gizaw et al., Reference Gizaw, Komen, Hanote, van Arendonk, Kemp, Aynalem, Mwai and Dessie2011). Since the beginning of the 1990s, molecular data have become more relevant to the characterization of genetic diversity (Groeneveld et al., Reference Groeneveld, Lenstra, Eding, Toro, Scherf, Pilling, Negrini, Jianlin, Finlay, Groeneveld and Weigend2010), and the identification of genetically distinct breeds is commonly based on these state-of-the-art techniques (Gizaw et al., Reference Gizaw, Komen, Hanote, van Arendonk, Kemp, Aynalem, Mwai and Dessie2011). Mitochondrial DNA (mtDNA) diversity is a useful molecular tool in establishing phylogenetic relationships among breeds and at species level (Tanaka et al., Reference Tanaka, Takizawa, Murakoshi, Dorji, Nyunt, Maeda, Yamamoto and Namikawa2011; Zhao et al., Reference Zhao, Zhao, Zhang and Duan2011). According to Ajmone-Marsan and The GLOBALDIV Consortium (Reference Ajmone-Marsan2010), studies of mtDNA, microsatellite DNA profiling and Y-chromosomes have revealed many details about the process of domestication, diversity retained by breeds and the relationships between breeds.
Although a preliminary study of natural genetic variation among Nigerian sheep breeds using microsatellite markers was reported by Adebambo et al. (Reference Adebambo, Williams, Blott and Urquhart2004), the full extent of molecular variation and diversity remain largely unknown, and studies based on other molecular markers capable of unraveling phylogenetic history and development to better understand the genetic structure of the Nigerian sheep population are scarce. As part of efforts to better understand the genetics of Nigerian sheep for improvement and conservation goals, we report the first study undertaken to assess population structure and genetic diversity of Nigerian sheep using D-loop sequence of the ovine mitochondrial genome.
Materials and methods
Study area and study population
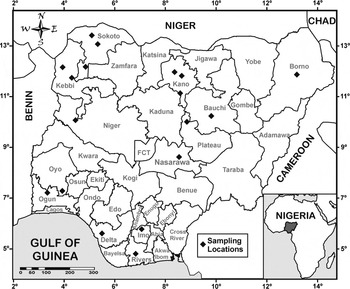
This study was carried out using samples collected across all over Nigeria. Nigeria is located in West Africa on the Gulf of Guinea between latitude 10° north of the equator and longitude 8° east of Greenwich Meridian with a total area of 923 768 km2. Nigeria is bounded by Niger, Benin and Cameroon Republics on the North, West and East, respectively (Figure 1). The five agro-ecological zones include Sahel and Sudan Savannah, Guinea Savannah, derived Guinea Savannah and Rainforest/Mangrove swamp. For the purposes of sampling, Sahel and Sudan savannas were combined into Sahelo-Sudan; derived Guinea and Guinea savannas were combined into Guinea savanna and sampling was carried out from three main agro-ecological zones of Sahelo-Sudan Savannah, Guinea Savannah and Rainforest/Mangrove swamp.
Map of Nigeria showing sampled locations.

Two hundred and ninety sheep were sampled from the three main agro-ecological zones of Nigeria comprising 98 Balami, 43 Uda, 110 Yankasa and 39 West African Dwarf (WAD) breeds. Approximately 5 ml of blood was collected into heparinized tubes from the jugular vein of the sheep, stored on ice before transfer to the laboratory for analysis.
DNA extraction, polymerase chain reaction amplification and sequencing
DNA was extracted from 50–100 µl of whole blood using the ZymoBeadTM Genomic DNA Kit (Zymo Research Corp. Irvine, CA, USA) according to the manufacturer's recommendations. Quantification of DNA yield and assessment of quality were done using the Nanodrop ND-100 Spectrophotometer (Thermo Scientific, Wilmington, DE, USA). The DNA was amplified via polymerase chain reaction (PCR) in a MyCyclerTM Thermal Cycler (Biorad, Hercules, CA, USA) using primers designed from published ovine sequences (Genbank Accession Number AF010406) (Hiendleder et al., Reference Hiendleder, Lewalski, Wassmuth and Janke1998): tRNA-proline (5-CAGTGCCTTGCTTTGGTTAAGC-3) and tRNA-phenylalanine (5-CACCATCAACCC CAAAGCTGAAG-3). The total volume of 20 µl amplification reactions contained 20–50 ng template DNA, 2.0 µl each of forward and reverse primers, and 16 µl nuclease-free water in a BIONEER AccuPower® TLA PCR Premix (containing NTPs, MgCl2 and DNA polymerase) (BIONEER Corporation, Alameda, CA, USA). PCR used the following protocol: initial denaturation at 94°C for 5 min, 35 cycles of amplification at 94°C for 30 s, annealing at 62°C for 30 s, extension at 72°C for 1 min, final extension at 72°C for 5 min and held at 4°C until analysis. Ten microlitres of the PCR product were separated in a 1.5 percent agarose gel prestained with 0.5 µg/ml ethidium bromide. Electrophoresis was carried out at room temperature for 40 min at 100 V using a Bio-Rad Power PacTM electrophoresis apparatus (Biorad). The resulting amplified bands were visualized with UV light and photographed using the AlphalmagerTM 2200 electrophoresis documentation and analysis system (Cell Biosciences, CA, USA), and were scored using GENEMate Quanti-Marker 100 bp DNA ladder (BioExpress, UT, USA). Amplified PCR products were sequenced with the Applied Biosystems Automated 3730 DNA Analyzer (Applied Biosytems, Foster City, CA, USA) using the Big Dye Terminator chemistry and AmpliTaq-FS DNA polymerase. Sequencing reactions used tRNA-proline primer (5-CAGTGCCTTGCTTTGGTTAAGC-3).
Statistical analysis
Sequence alignment of the 1 179 bp PCR-amplified fragment (after excluding the 75 nt tandem-repeat elements) was done using DNA alignment software (Fluxus Technology, http://www.fluxus-engineering.com/). A pair-wise distance matrix between mtDNA sequences were computed using the nucleotide p-distance (Nei and Kumar, Reference Nei and Kumar2000), and a neighbour-joining (NJ) tree constructed on the basis of these distances using the MEGA 3.0 software (Kumar, Tamura and Nei, Reference Kumar, Tamura and Nei2004). A median joining network (Bandelt, Forster and Rohl, Reference Bandelt, Forster and Rohl1999) was drawn from haplotypes using the program Network 4.1.0.9 (www.fluxus-engineering.com). Indices of sequence variation and haplotype structure were calculated using the DnaSP 4.00 program (Rozas et al., Reference Rozas, Sánchez-del-Barrio, Messeguer and Rozas2003) including nucleotide diversity (π), number of haplotypes (nh), haplotype diversity (Hd) and number of polymorphic sites (S). An analysis of molecular variance (AMOVA) was computed to test significant differences in mitochondrial diversity between Nigerian sheep breeds using ARLEQUIN 3.01 (Excoffier, Laval and Schneider, Reference Excoffier, Laval and Schneider2005).
Results
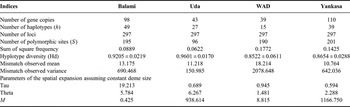
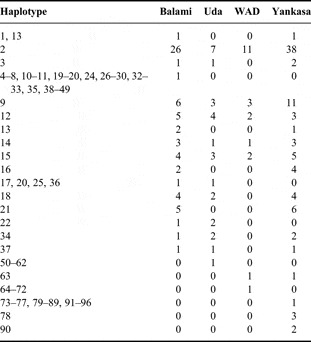
Table 1 shows values for standard diversity indices for the study of mtDNA of the Nigerian sheep. A total of 96 haplotypes were observed among the populations. Haplotypes 2, 3, 9, 12, 13, 14, 15, 16, 17, 18, 22, 23, 25, 31, 34, 36, 37 and 63 were shared among the different populations with haplotypes 2, 9, 12 and 15, common to all the populations. However, haplotype 2 had the highest distribution among the four populations studied (Tables 2 and 3). Number of polymorphic sites varied across the populations with the highest value in Yankasa (201) and the lowest in Uda (96). Gene diversity was high in all the populations. Values ranged from 0.9601 ± 0.0170 in Uda to 0.8522 ± 0.0611 in WAD. A variation in mismatch observed mean was noticed in this study, with WAD having the highest value of 18.214.
Standard diversity indices for mtDNA analysis of Nigerian sheep breeds.

Haplotypes shared among populations.

Distribution of haplotypes among the populations studied.

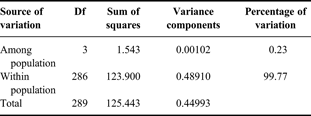
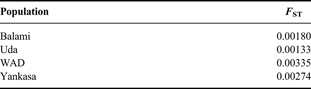
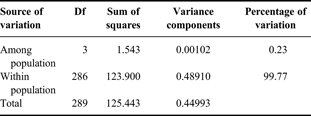
Parameters of spatial expansion assuming constant deme size is shown in Table 1. Tau ranged from 0.594 in Yankasa to 19.213 in Balami. However, Uda had the highest value of 6.267 for Theta, with the lowest value seen in WAD. Higher variation in M was also observed with values ranging from 0.425 in Balami to 9338.613 in Uda. The AMOVA is shown in Table 4. The AMOVA analysis revealed that 0.23 percent of the variation is found among populations compared with 99.77 percent variation found within populations. Population-specific F ST indices are presented in Table 5. F ST values are very low and range from 0.00133 in Uda to 0.00335 in WAD. The fixation index F ST is 0.00226.
AMOVA analysis.
Population specific F ST indices.
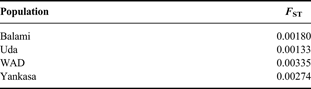
Fixation index F ST: 0.00226.
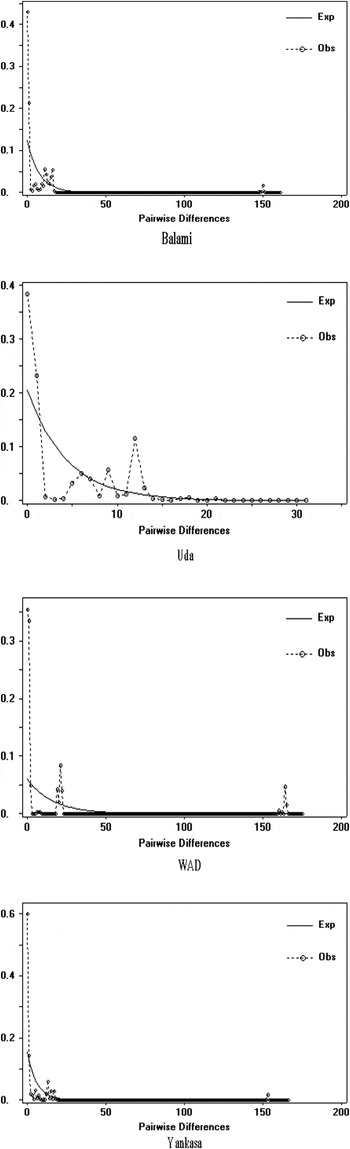
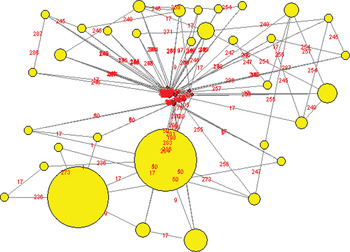
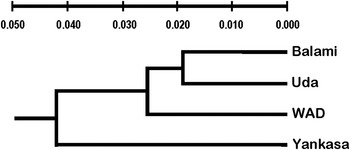
The estimation of population size change for Nigerian sheep breeds using pair-wise comparison is shown in Figure 2. In all the populations, a sharp variation for both observed and expected pair-wise differences was observed. The fluctuation was highest among Uda. Figure 3 shows the median joining network for the haplotypes observed among Nigerian sheep. The network shows a grouping of the haplotypes into two haplogroups. The unweighted pair group method analysis (UPGMA) tree of Nigerian sheep mtDNA sequences is shown in Figure 4. The tree shows that all the breeds originated from a common source. However, Yankasa diverged first. This was followed by WAD and lastly Balami and Uda, although separated but are more genetically closely related.
Estimation of population size changes for Nigerian sheep breeds.

A median joining network for the haplotypes observed among Nigerian sheep. Circles represent haplotypes and have a size proportional to frequency. Mutational differences are shown on lines.

UPGMA tree of Nigerian sheep mtDNA sequences.

Discussion
Variation among all the standard diversity indices was observed across the four Nigerian sheep breeds studied. The highest number of polymorphic sites in Yankasa could be attributed to the fact that it is the most populous sheep breed in Nigeria spread across different agro-ecological zones of the country (Adebambo et al., Reference Adebambo, Williams, Blott and Urquhart2004). The mismatch distribution analyses and the genetic diversity analyses suggest that these breeds must have undergone relatively recent population expansion (Qing et al., Reference Qing, Ping, Hong and Tsunodak2009). The values of haplotype and nucleotide diversities observed in this study are a little higher than haplotype diversity of 0.792 ± 0.37 and nucleotide diversity of 0.00392 ± 0.00046 observed by Wang et al. (Reference Wang, Cao, Liu and Fang2006) from analysis of mtDNA variation and matrilineal structure in blue sheep populations of Helan Mountain, China. However, the values of haplotype diversity are comparable to 0.857 ± 0.137 to 1.000 ± 0.052 reported by Sulaiman, Wu and Zhao (Reference Suleiman, Wu and Zhao2011). Mohammadhashemi et al. (Reference Mohammadhashemi, Pirany, Roz and Nassiry2010) also reported that sequence analysis of the mtDNA from Moghani breed with another Iranian sheep showed high genetic diversity with some Iranian sheep breeds. Pariset et al. (Reference Pariset, Mariotti, Gargani, Joost, Negrini, Perez, Bruford, Marsan and Valentini2011) observed that mtDNA analysis showed higher levels of sheep nucleotide diversity in the South-East, which was congruent with the proximity to the domestication centre. In a related study in goats, Benjelloun et al. (Reference Benjelloun, Pompanon, Ben Bati, Chentouf, Ibnelbachyr, El Amiri, Rioux, Boulanouar and Taberlet2011) reported very high haplotype diversity obtained for the Moroccan goats, and this, according to the same authors, could have resulted from the capture of a large part of the wild diversity during domestication.
The AMOVA showed that 0.23 percent of the genetic variation among Nigerian sheep breeds is attributed to among populations compared with 99.77 percent due to variation within populations. A higher variation within than among Nigerian sheep breeds suggests high levels of female-mediated gene flow (Tserenbataa et al., Reference Tserenbataa, Ramey, Ryder, Quinn and Reading2004). More so, the results of pair-wise computations and AMOVA indicates that some breeds are differentiated relative to a random collection of genotypes and reflect differences in the spatial distribution of genetic variation (Wang et al., Reference Wang, Cao, Liu and Fang2006). Similar to these findings, Pariset et al. (Reference Pariset, Mariotti, Gargani, Joost, Negrini, Perez, Bruford, Marsan and Valentini2011) reported that the major mitochondrial variation was distributed within breeds (95.04 percent), while it was lower among regions (0.90 percent) and among breeds within regions (4.06 percent).
The genetic differentiation fixation index (F ST) among the Nigerian sheep breeds was low. The highest F ST value in Nigerian WAD sheep could be the results of its presence only in the southern part of the country. Reduced differentiation could be attributed to shrinkage of grazing area, indiscriminate cross-breeding/intermixing between breeds and lack of appropriate breeding and management policies. Although there are no strict breeding rules, geographical isolation between the investigated sheep from different regions has probably led to the moderate level of differentiation among them since genetic drift and natural selection are two main factors that give rise to genetic differentiation among populations (Qing et al., Reference Qing, Ping, Hong and Tsunodak2009). The observed F ST values indicate significant inbreeding from subdivision of the breeds. The degree of subdivision suggests gene flow between the breeds (Kantanen et al., Reference Kantanen, Vilkki, Elo and Maki-Tanila1995). If gene flow is greater than one, it could play a uniform action of resisting the action of genetic drift and preventing differentiation between populations (Qing et al., Reference Qing, Ping, Hong and Tsunodak2009). According to Gizaw et al. (Reference Gizaw, Komen, Hanote, van Arendonk, Kemp, Aynalem, Mwai and Dessie2011), an important characteristic to note in genetic diversity in livestock populations is that the variation within a population is much larger than that between the populations. This is well exemplified in the study of Ethiopian sheep where the diversity between Ethiopian sheep populations accounted for only 4.6 percent of the overall genetic diversity (global F ST value = 0.046 ± 0.004), the rest being accounted for by within-population variation. The variation in the number of haplotypes and gene copies analysed contributes to unravelling genetic diversity among Nigerian sheep breeds. Despite the high haplotype diversity observed in Uda, the higher number of polymorphic sites in Yankasa compared with other breeds is likely to have contributed to Yankasa's adaptation ability.
Out of the 96 haplotypes observed in this study, only 5 haplotypes are common to all the breeds with haplotype 2 having the highest frequency. This probably points to the existence of evolutionary relationship among them; and equally suggests evidence linking the four Nigerian sheep breeds to a common ancestor or a small number of founders. In a related study in buffalo, few haplotypes of South Kanara and Toda were found to be quite distinct from the commonly found haplotypes, indicating that these might have been ancestral to all the present-day haplotypes (Kathiravan et al., Reference Kathiravan, Kataria, Mishra, Dubey, Sadana and Joshi2011). Relatively divergent haplotypes within breeds and geographical locations suggests that gene flow has occurred on a regional scale at some time in the recent past and that the breeds have not been subdivided by long-term biogeographic barriers (Luikart and Allendorf, Reference Luikart and Allendorf1996). Similar mean haplotype diversity of 0.945 and mean nucleotide diversity and 0.013 from genetic diversity and structure of the West Balkan Pramenka sheep types as revealed by microsatellite and mtDNA analyses further support the results of this study (Cinkulov et al., Reference Cinkulov, Popovski, Porcu, Tanaskovska, Hodzić, Bytyqi, Mehmeti, Margeta, Djedović, Hoda, Trailović, Brka, Marković, Vazić, Vegara, Olsaker and Kantanen2008). In a related study in goats, Vacca et al. (Reference Vacca, Daga, Pazzola, Carcangiu, Dettori and Cozzi2010) reported that the animals showed a high genetic haplotype diversity, as 35 haplotypes were each represented by a single sequence and only a few haplotypes were shared among the animals, thereby lending credence to the findings of Naderi et al. (Reference Naderi, Rezaei, Taberlet, Zundel, Rafat, Naghash, El-Barody, Ertugru and Pompanon2007) that it is common to find haplotypes represented by one individual or shared by only a few subjects, because mtDNA variation is a more frequent component within breeds than between them. The significant differentiation in the haplotype frequencies among Nigerian sheep breeds suggest that little gene flow currently exist among the breeds (Luikart and Allendorf, Reference Luikart and Allendorf1996).
The median joining network separated the 96 haplotypes into two major haplogroups. The UPGMA tree separated the four Nigerian sheep breeds according to their geographical locations and population sizes in the country. Balami and Uda are northern breeds which are also fewer than WAD which is a southern breed compared with Yankasa with a wider geographical spread across the country. Evidence from the phylogenetic tree supports first divergence of Yankasa followed by WAD and later by Uda and Balami. However, Zhao et al. (Reference Zhao, Zhao, Zhang and Duan2011) reported that F S value was −13.17574 (P = 0.00000) for haplogroup A in Chinese large-fat-tailed sheep breeds, which suggested one expansion event in this population's demographic history. Analysis of mismatch distribution also revealed an almost multi-modal distribution of mtDNA D-loop for haplogroup B. F S value was −6.39666 (P = 0.00000) for haplogroup B, which showed no population expansion and relatively stable population size because of no significant difference from neutrality.
The present information could be used to strengthen the monitoring, characterization and conservation of animal genetic resources towards the sustainable rearing of the autochtonuous sheep breeds. However, further studies involving the use of endogenous retroviruses (Chessa et al., Reference Chessa, Pereira, Arnaud, Amorim, Goyache, Mainland, Kao, Pemberton, Beraldi, Stear, Alberti, Pittau, Banabazi, Kazwala, Zhang, Arranz, Ali, Wang, Uzun, Dione, Olsaker, Holm, Saarma, Ahmad, Marzanov, Eythorsdottir, Holland, Ajmone-Marsan, Bruford, Kantanen, Spencer and Palmarini2009) as a new class of genetic markers, combined with existing knowledge from microsatellite (Agaviezor et al. accepted. Adebambo et al., Reference Adebambo, Williams, Blott and Urquhart2004) will help to unravel the history of domestication of Nigerian sheep.
Conclusions
Genetic diversity among Nigerian indigenous sheep breeds is eroding due to indiscriminate cross-breeding/intermixing between breeds, and lack of appropriate breeding and management policies. The highest number of polymorphic loci in Yankasa compared with other breeds suggests wider genetic variation that can be exploited in its improvement. In addition, the four Nigerian sheep breeds studied separated genetically based on their geographical locations and population sizes with a rough grouping of the northern breeds (Balami and Uda) and the southern breeds (WAD and Yankasa). The evolutionary divergence into distinct entities of Nigerian sheep breeds based on mtDNA D-loop sequence appear to closely follow their geographical distribution in Nigeria, and this could have implications for management, improvement and conservation strategies in Nigerian sheep.
Statement of Interest: The authors wish to state that there is no conflict of interest as regards this manuscript.
Acknowledgements
Financial support from College of Agriculture and Life Sciences, Cornell University through a partnership with University of Agriculture, Abeokuta, Nigeria is gratefully acknowledged. Special thanks to Prof. W. Ron Butler for the opportunity given to the first two authors as visiting graduate students at Cornell University.