INTRODUCTION
Most of Uruguay is covered by native pastures, dominated by grasses, with a high diversity of species (Lezama et al. Reference Lezama, Altesor, Paruelo and León2006). The majority of these pastures do not receive any added phosphorus (P) fertilizer and there is little in the way of species introduction. The low P availability of the soils combined with low organic matter mineralization results in poor herbage quality (Berretta Reference Berretta and Berreta1998). The improvement of native pastures through legume introduction and P fertilizer application, intended to remove the production and quality limitations, has been widely adopted for beef fattening systems. Less use has been made of these improved pastures specifically for calf rearing or post-weaning, although it has been long recognized that these are crucial for the overall productivity of the system (Pallarés et al. Reference Pallarés, Berretta, Maraschin, Suttie, Reynolds and Batello2005; Soca et al. Reference Soca, Claramunt and Do Carmo2007).
The most commonly introduced species are white clover (Trifolium repens L.) and lotus (Lotus corniculatus L. and Lotus subbiflorus Lag.). The response of improved pastures to P fertilizer application in different regions of Uruguay has been studied extensively. Carámbula (Reference Carámbula1996) summarized previous findings and concluded that the response to P application depends mainly on the successful establishment of the introduced legume species. Carámbula (Reference Carámbula1996) also remarks that the herbage production response usually reaches a plateau at relatively low P application rates (10–20 kg P/ha/year). The benefits of using higher P application rates are more variable.
The soils developed on basaltic rocks of the Northern Region have high P retention capacity (Hernández & Zamalvide Reference Hernández and Zamalvide1998; Durán & García Préchac Reference Durán and García Préchac2007). Consequently, annual P applications are required to maintain the legume production and to ensure the persistence of the oversown species (Bemhaja Reference Bemhaja and Berretta1998). Bemhaja (Reference Bemhaja and Berretta1998) reported that white clover showed higher responses to P fertilization than lotus on soils developed from basaltic rocks. The increase in herbage production and quality could influence productivity by allowing higher stocking rates and improving individual animal performance. To date no field studies have been conducted in Uruguay to quantify the extent of the animal response to pastures improved through the use of different legume species and P fertilizer.
The objective of the current study was to quantify the animal production response to pastures improved through the introduction of different legume species and P fertilizer. Quantitative relationships between pasture characteristics and post weaning daily live weight gain (DLWG) were also established as part of the study.
MATERIALS AND METHODS
Site
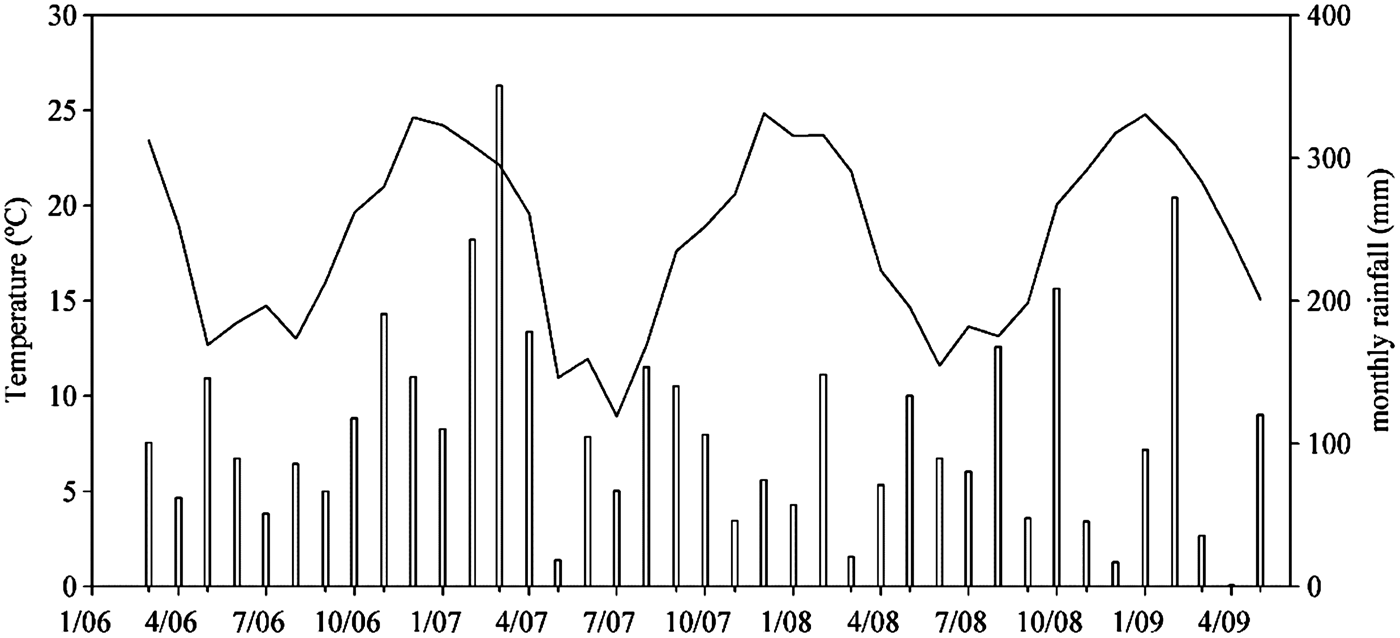
The experiment was established in July 1995 on a beef production farm in Salto, Uruguay (31°14′S, 57°08′W) and ran through to 2002. This region has a temperate climate with a mean annual temperature of 18·0 °C, a mean temperature of 11·7 °C in the coldest month (June) and 24·0 °C in the warmest month (January). The mean annual rainfall is 1322 mm, without any clear distribution pattern. Long-term monthly average rainfall is approximately 100 mm for each month (Dirección Nacional de Meteorología 2015). Figure 1 shows the mean monthly temperature and monthly rainfall in the period studied.
Average monthly temperature (line) and total monthly rainfall (bars) throughout the experimental period (month/year), Salto, Uruguay. From January to September 1999 the rainfall was not recorded.

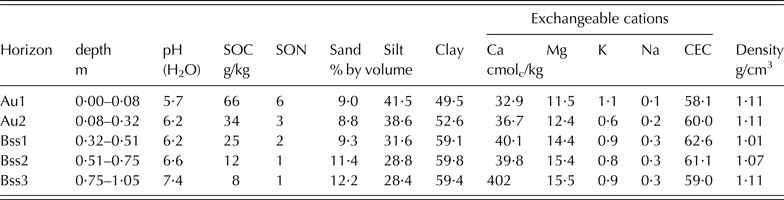
The experiment was located on an extended gentle slope (<0·03 m/m). The soil was a Typic Hapludert (Soil Survey Staff 2006), developed on lodolites derived from meteorization of basaltic rocks (Table 1). Although the soil profile presented some variation within the experiment, there were no appreciable zones of shallow soils. The native pasture was composed mainly of grasses, dominated by Paspalum notatum Flüggé, Paspalum dilatatum Poir., Axonopus fissifolius (Raddi) Kuhlm., Piptochaetium stipoides (Trin. & Rupr.) Hack. ex Arechav., Aristida uruguayensis Henrard, Nassella neesiana (Trin. & Rupr.) Barkworth and Schizachyrium spicatum (Spreng.) Herter. The contribution of native legumes was very small, as was the weed presence (mainly Eringyum sp.). Although no quantitative measurements of species contribution were made, observations led to the conclusion that, except for legume introduction, the pasture species composition did not undergo important changes throughout the duration of the study.
Characteristics of the soil
SOC, soil organic carbon; SON, soil organic nitrogen; Ca, calcium; Mg, magnesium; K, potassium; Na, sodium; CEC, cation exchange capacity.
Treatments
The treatments in 1995 were:
1. Native grassland (NG)
2. Improved pasture with annual low P fertilizer applications (P1), oversown with L. corniculatus (cvar San Gabriel) fertilized with a basal rate of 26 kg P/ha, and annual applications of 13 kg P/ha.
3. Improved pasture with annual high P fertilizer applications (P2), oversown with L. corniculatus (cvar San Gabriel) fertilized with a basal rate of 39 kg P/ha, and annual applications of 26 kg P/ha.
In 1997 white clover (cvar Bayucuá) was included in the two improved pasture treatments. The three treatments were allocated randomly to five blocks with 2 ha paddocks; therefore the total area of the experiment was 30 ha. The fertilizer applications were made in late autumn each year, and the P source was single superphosphate in 1995, 1996, 1998 and 1999, while in 1997 triple superphosphate was used. In the last two periods (starting 2000 and 2001) no fertilizer was applied, and only the residual effect of previous applications was evaluated.
Experimental management
Prior to the establishment of the experiment the pasture was grazed with cows at high stocking rates, in order to reduce the standing grass biomass and also to create bare ground for introducing the legumes. After legume seeding and fertilization the experiment was excluded from grazing for 6 months, then low stocking rates were used for short periods for a further 8 months. In 1996-early spring, after a short grazing period with a high stocking rate (SR) of cows, the experiment was closed to allow the sward to regrow.
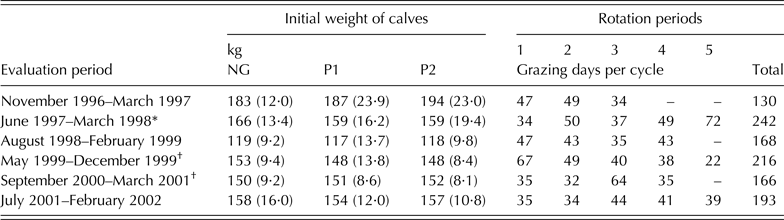
Weaned Hereford calves, born in spring of the previous year, were used as the test animals. At the beginning of each evaluation period throughout the 6 years, 60 weaned calves from the commercial herd were selected and divided into three equal groups of 20 based on weight. These animals had been in native grass paddocks until the selection. Table 2 shows the average initial weights of each group of animals for each evaluation period. Although there were variations in weight, differences among the three groups were not significant. Each group of animals grazed the five blocks (replicates) of one treatment in rotation. The length of grazing for each block was 10 days, with a complete rotation cycle of 50 days. In the last two seasons the intended rotational cycle was 35 days. However, incidental reasons modified the extension of the cycles (Table 2). Stocking rate was dependent on herbage availability (put and take system), with a daily allowance of 7 kg dry matter (DM) of standing herbage per 100 kg live weight (LW). Within each group a sub-group of 8–14 animals, with similar average LW, were selected to graze each treatment (‘fix’ calves) at each grazing throughout the study period each year. When herbage production was not enough for the whole group of 20 post-weaned calves, some animals were kept in a native pasture paddock next to the experiment.
Average initial weight of weaned calves (standard deviation in parentheses), and length of the grazing rotation periods
NG, native grassland; P1, annual applications of 13 kg P/ha; P2, annual applications of 26 kg P/ha.
* The evaluation was discontinued from December 1997 to February 1998 because the high rainfall produced water logging of the field.
† The evaluation was discontinued for short periods in summer because of malfunctions in the water distribution system.
Management of the weaned calves in terms of their health and other husbandry practices followed commercial farm protocols. There were no unusual events during the course of the experiment.
Measurements and chemical analysis
Soil samples were taken in the autumn of 1995, 1996, 1997 and 1999, prior to fertilizer application. Composite samples (20 cores) were taken from each plot at 0–0·075 m depth. The soil samples were dried at 40 °C and analysed for available P using the Bray-1 method with a soil : solution rate of 1 : 7.
Herbage production was estimated with five cages per paddock (1·0 × 0·5 m2), located at random after trimming the pasture to a height of 0·03 m. The herbage within the cages was cut at the beginning of each evaluation period, and thereafter at the end of each rotation cycle (approximately 50 days growth) with electric shears at 0·03 m. After that, the cages were removed and located in a new site. Herbage samples were separated into grasses and legumes. Due to the poor establishment of white clover, it was separated only in 1998 and 1999.
The herbage collected in the cages was dried at 60 °C and ground for analysis. In the periods September 2000–March 2001 and July 2001–February 2002, herbage samples were not analysed, due to lack of funding. The herbage samples were mineralized with sulphuric acid (H2SO4) at 350 °C, adding concentrated hydrogen peroxide (H2O2) to complete the oxidation. The total nitrogen (N) content was analysed by the Kjeldahl method, and the P content was determined colorimetrically.
The available herbage in each paddock was estimated a week prior to grazing, by cutting 30 squares (0·25 × 0·25 m2) into a single sample, which was dried at 60 °C and weighed without species separation.
Weaned calves were weighed after each rotation cycle, in facilities nearby the experiment. Although the calves did not receive any previous treatment, the management implied at least 2 h without ingestion of herbage or water before weighing.
Calculations and statistical analysis
Stocking rate was calculated from the available herbage of each paddock (7 kg DM/100 kg LW). Since the calves were weighed only once in the rotation cycle, for this calculation it was assumed that calf LW increased at a fixed rate.
The nutrient content of the composite herbage samples was multiplied by the amount of available herbage to calculate available N and P in each paddock. A similar procedure was used to calculate the nutrient content of each species from the samples taken within grazing exclusion cages.
To calculate the change in LW per paddock in the rotation cycle, average LW change of the fix calves from each treatment was used, multiplied by SR and number of grazing days (calves × days). For this calculation it was assumed that changes in LW of the other animals were similar to the fix calves.
For statistical analysis of the soil, herbage yield and nutrient content of the pastures (N and P) and analysis of variance corresponded to a random block design with five replications. Contrast analysis was used to test differences between NG and oversown pastures or differences between P rates in oversown pastures. The statistical analysis of LW changes was based on the individual daily weight change using a mixed autoregressive effects analysis. Linear regression analysis was used to test the effect of the herbage, N and P availability on LW changes in each grazing period (from 1996 to 1999). Data were analysed using the Statistical Analysis System (SAS) v. 8.1 software.
RESULTS
Soil phosphorus availability
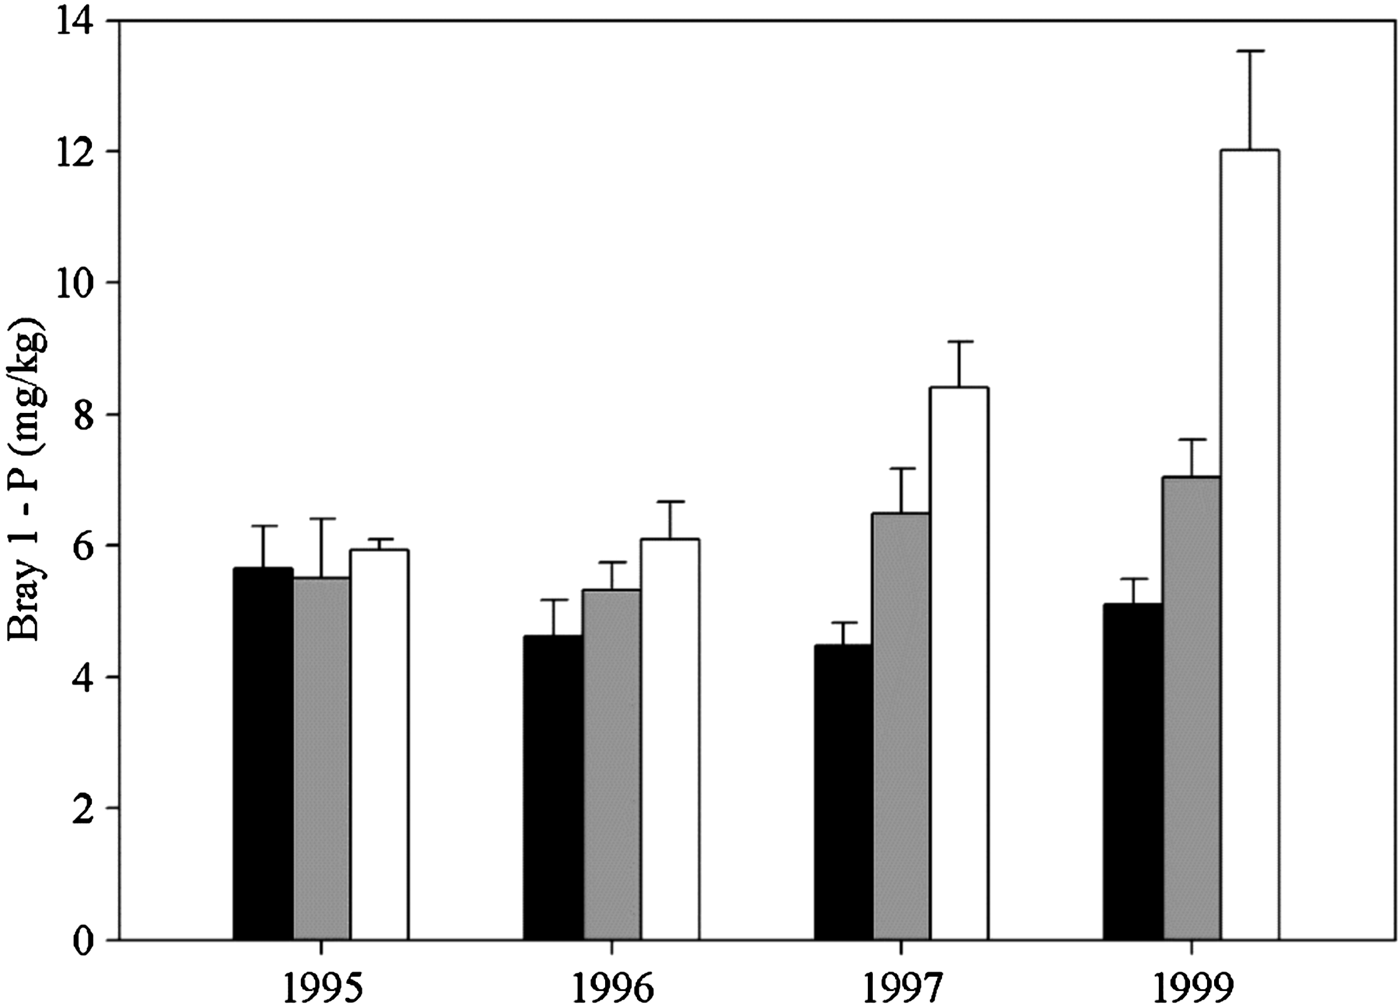
There were no statistical differences in available soil P among treatments in the first 2 years of the experiment, with low values not only for the native pasture, but also for the fertilized soils (Fig. 2). In the 1997 sampling, the fertilized treatments showed higher values than NG (P < 0·05), while in 1999 the P2 treatment was higher than P1 (P < 0·05).
Available P content (Bray-1) of the soil under native pasture and oversown pastures with different annual P fertilizer rates. Native grasslands (NG, black bars), Improved pasture with annual applications of 13 kg P/ha (P1, grey bars) and improved pasture with annual applications of 26 kg P/ha (P2, white bars). Vertical bars indicate standard deviation of mean.
Pasture production
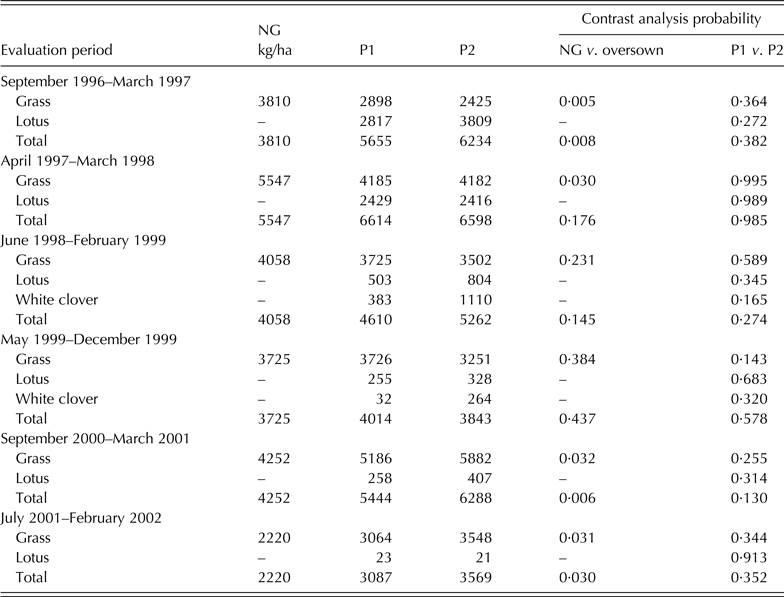
Total herbage yields of the oversown pastures were significantly higher (P < 0·05) than the NG in three of the six study periods (Table 3). No significant differences in total herbage yield were found in the oversown pastures between the two P rates (P1 v. P2).
Total herbage and legume production of native grasslands and oversown pastures with different annual P fertilizer rate, and probability of contrast analysis
NG, native grassland; P1, annual applications of 13 kg P/ha; P2, annual applications of 26 kg P/ha.
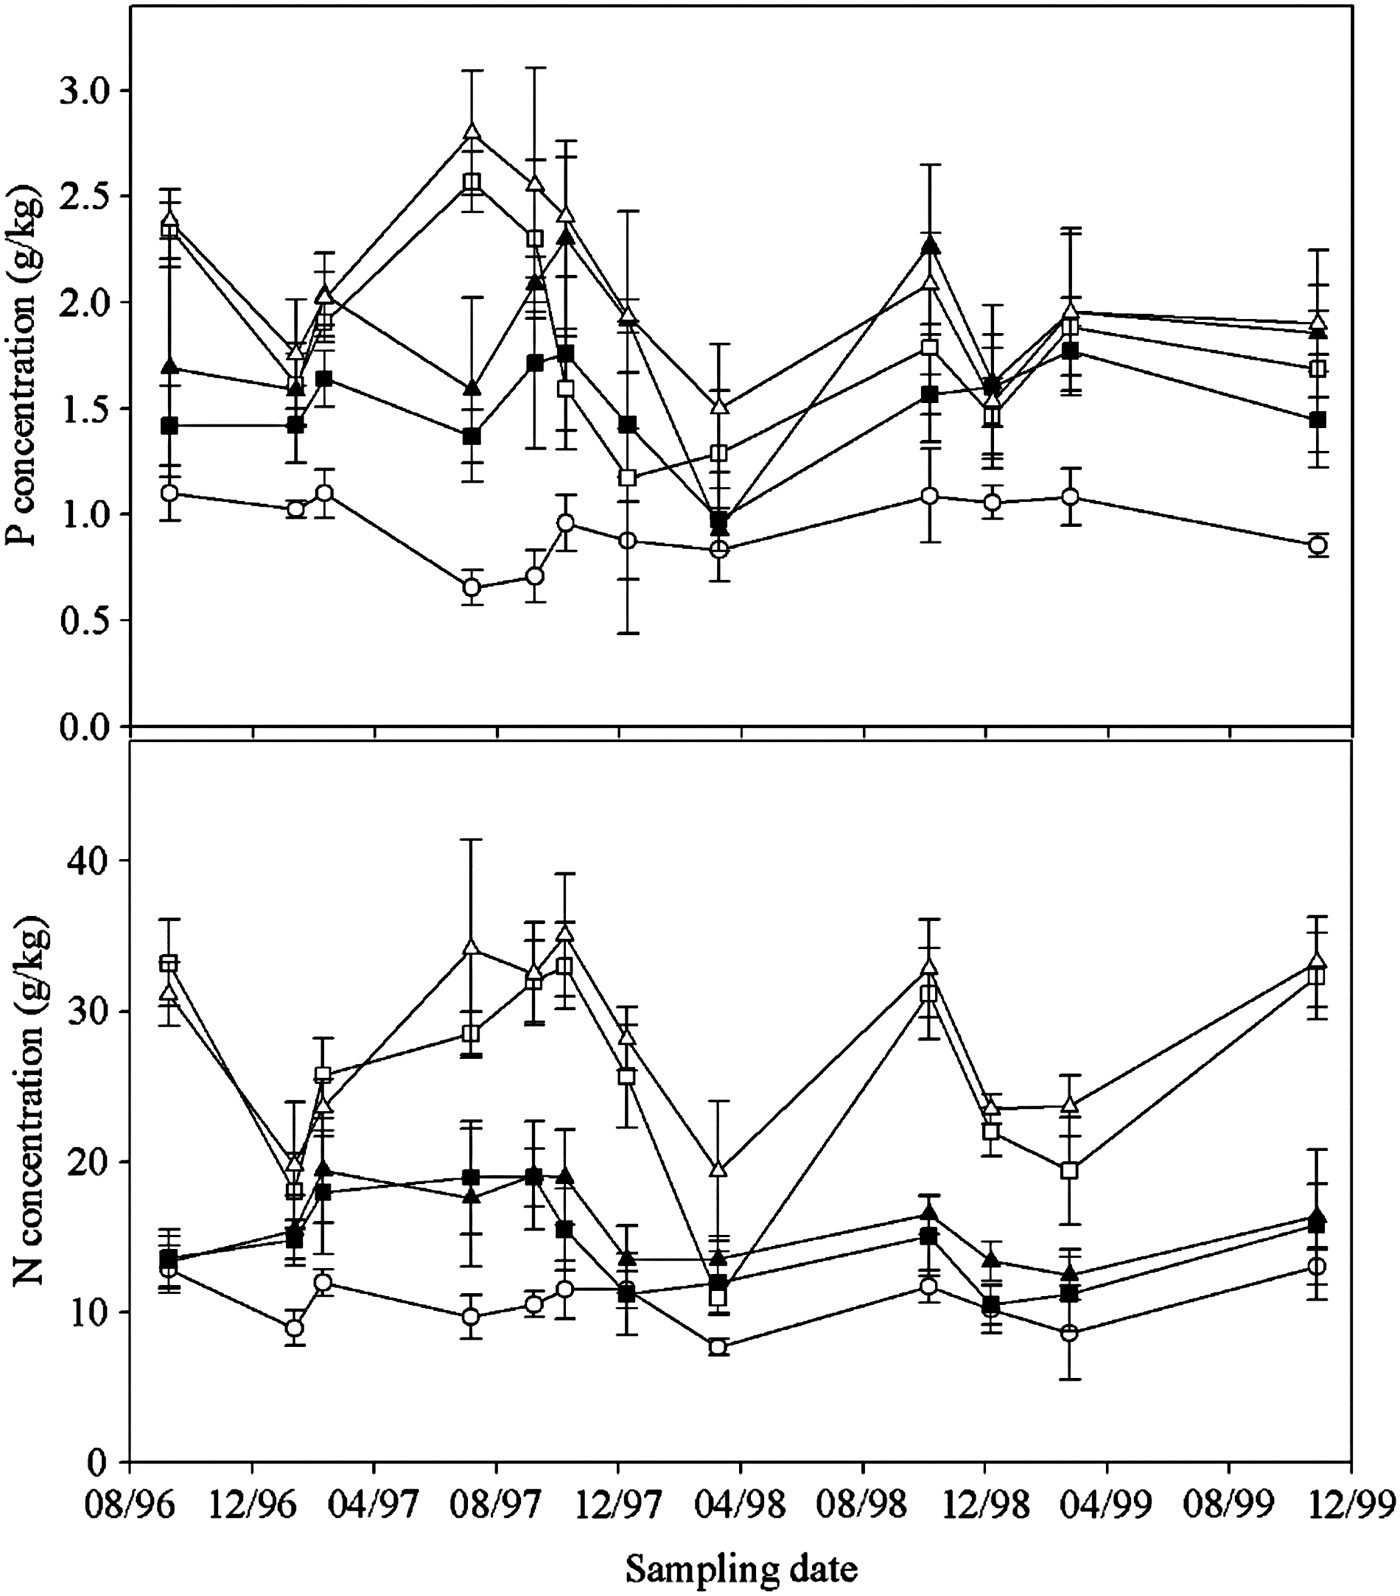
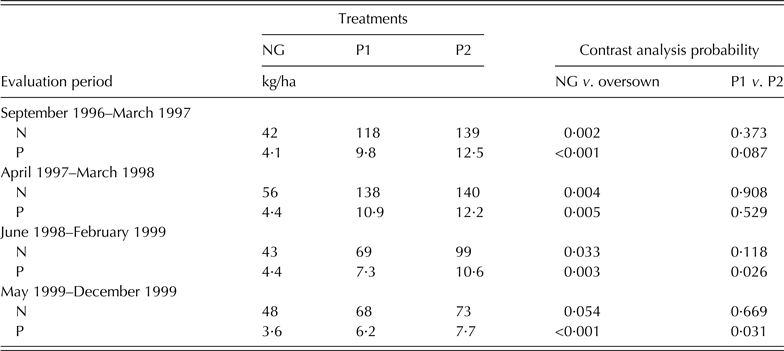
Herbage N and P concentration varied throughout the study, with the highest values in early spring and the lowest in late summer–autumn (Fig. 3). The N concentration of the harvested herbage was significantly higher (P < 0·05) in legumes than in grasses. Although the differences were not significant, there was a trend of higher N content in legumes and grasses from P2 compared with P1, and the N content of grasses in the oversown pastures generally higher than in NG, indicating that N fixed symbiotically by legumes was transferred to the grasses. The total amount of N and P in the harvested herbage of P1 and P2 was significantly higher (P < 0·05) than in NG (Table 4), with more than double the amount of N in herbage from the improved pastures, except for the total N in forage of the May–December 1999 evaluation period. As with the results for N concentration in herbage, no significant differences in the amounts of N were found when comparing P1 with P2.
Time course (month/year) of P and N concentration in the herbage of native pasture and oversown pastures with different annual P fertilizer rates. The symbols are: NG, native grasslands (○) P1, improved pasture with annual applications of 13 kg P/ha (grass ■, legume □), and P2, improved pasture with annual applications of 26 kg P/ha (grass ▴, legume ▵). Vertical bars indicate standard deviation of mean.
Total amount of N and P in the herbage of native grasslands and oversown pastures with different annual P fertilizer rate, and probability of contrast analysis
NG, native grassland; P1, annual applications of 13 kg P/ha; P2, annual applications of 26 kg P/ha.
In the oversown pastures the grasses and lotus had significantly higher (P < 0·05) P contents than NG in most of the cuts (Fig. 3). Although a trend was observed of higher P concentration in the grasses and legumes of the P2 treatment than in P1, this effect did not reach statistical significance in most of the cases. The herbage P concentration was less variable in the NG than in the improved pastures.
Live weight gain of weaned calves
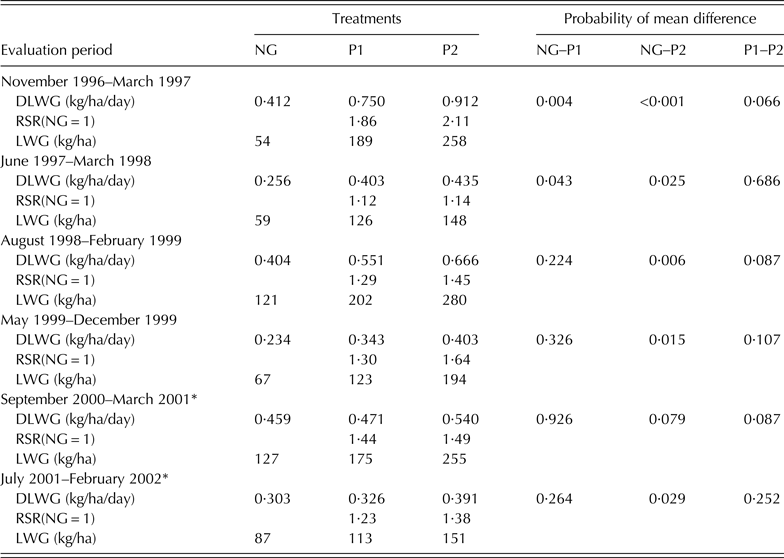
The DLWG of the weaned calves grazing the NG pasture was lower than that from the oversown fertilized pastures (Table 5). The DLWG of the NG calves was significantly lower (P < 0·05) than P2 in all the studied periods, even in the last 2 years when no fertilizer was added and the legume production had declined (Table 3). Although significant differences were observed only in some periods, there was a trend of higher DLWG in P2 than in P1. The average DLWG for the three treatments throughout years and rotation cycles was 0·319, 0·478 and 0·586 kg/day for NG, P1 and P2, respectively. These values of DLWG are within the expected range for this category in grazed systems of Uruguay.
Daily live weight gain, relative stocking rate and live weight gain per period of the weaned calves grazing native grasslands and oversown pastures with different annual P fertilizer rate, and probability of mean differences for daily live weight gain
NG, native grassland; P1, annual applications of 13 kg P/ha; P2, annual applications of 26 kg P/ha; DLWG, daily live weight gain; RSR, relative stocking rate; LWG, live weight gain per period.
* The oversown plots were not fertilized.
The oversown pastures presented higher herbage availability and therefore they were able to maintain higher SR during most of the rotation cycles. Stocking rate was based on available herbage hence it varied between seasons and evaluation periods. The overall average SR were 1·5, 2·0 and 2·2 head/ha for NG, P1 and P2, respectively. This resulted in higher beef production in the fertilized treatments, with an average LW increase of 86, 155 and 214 kg/ha for NG, P1 and P2, respectively, for the six seasons.
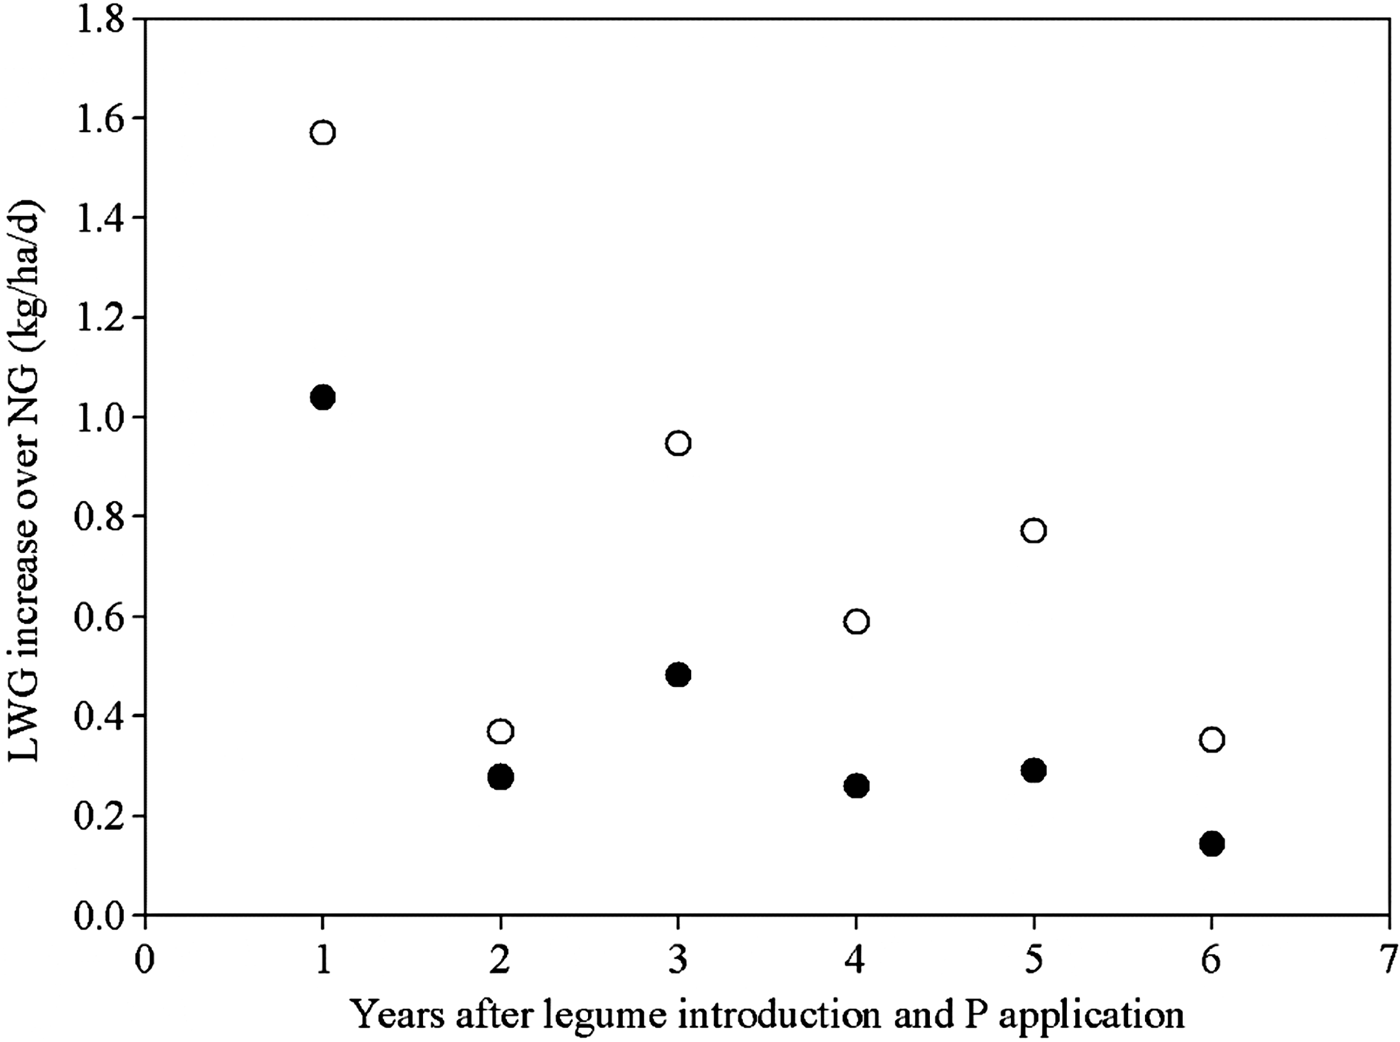
The per hectare DLWG increase of calves grazing the oversown pastures over the NG treatment showed a decline throughout the study (Fig. 4).
Effect of pasture improvement on live weight gain (LWG). Each point represents the difference between the treatment and native grasslands (NG) in a daily basis. The symbols are: P1, improved pasture with annual applications of 13 kg P/ha (•), and P2, improved pasture with annual applications of 26 kg P/ha (○).
Relationship between herbage yield and quality and beef production
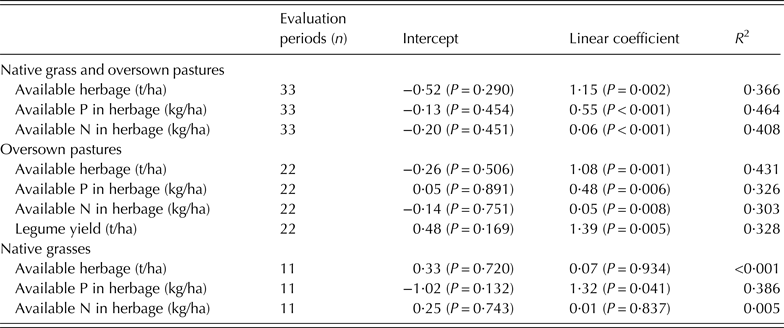
When the whole data set were considered, nutrient availability and forage yields showed significant relationships (P < 0·05) with the LW of the post-weaning calves, and the closest relationship corresponded to the amount of P in herbage (Table 6).
Parameters of the linear regression of live weight change of the calves (kg/ha/day) on pasture yield and composition at the beginning of each grazing cycle. In parenthesis probability of the regression parameters
DISCUSSION
The repeated fertilizer applications did not produce an important increase in available P, moreover the soils that received the highest rate were just attaining the recommended critical level for L. corniculatus in Uruguay (12 mg/kg) after 5 years. This reflects the high P retention capacity of the soils developed from basaltic rocks (Hernández & Meurer Reference Hernández and Meurer1998). Although these results indicate that P was a limiting factor for pasture production, they should be taken with caution, because there is some evidence that the Bray-1 method underestimates the real P availability in these soils. The causes of this poor behaviour of the method are high organic P mineralization, which is difficult to detect, and strong P retention of iron oxide compared with the Bray-1 solution extraction capacity (Hernández & Meurer Reference Hernández and Meurer1998). In spite of these difficulties, no other soil P test has been extensively used and calibrated for the soils of Uruguay, so consequently the Bray-1 method was used in the current study.
While lotus was successfully established and produced abundant herbage in all the oversown plots, white clover establishment was patchy, dominating in some plots and almost absent in others (data not shown). This heterogeneity could not be related to fertilizer rates, or a given area of the experiment. The persistence of the two species was also different, with a longer productive period for lotus and only 2 years for white clover. This may also reflect that white clover has a higher P requirement than Lotus.
Drawing conclusions on the benefits of oversowing and fertilizer P based solely on total herbage yield would be very misleading without looking at the changes that occurred in grass and legume growth. For both species there was a trend towards lower production as time passed, which has also been reported by other researchers for this type of improved pasture in Uruguay (Carámbula Reference Carámbula1996) and other countries (McIvor et al. Reference McIvor, Guppy and Probert2011). The causes of this have been related mainly to the competence of the native grasses, which have more developed root systems and are able to absorb water and nutrients more efficiently than legumes. In the current study, the legume decline also reflects the cessation of P fertilizer inputs in 2000 and 2001.
The P fertilizer used in most of the applications was single superphosphate, which is also a sulphur (S) source. In a plot experiment, testing different P sources (single and triple superphosphate, phosphate rock and partially acidulated phosphate rock) near to the grazing experiment, the effect of S addition on total forage and L. corniculatus yield was examined under mowing. Phosphate rock plus elemental S, at comparable P rates as single superphosphate, and phosphate rock without S addition were tested. The responses in total forage and legume production to phosphate rock plus elemental S application were not significantly different from those to phosphate rock (data not presented). These results were taken into consideration to interpret the processes that occurred in the grazing experiment. Although it is possible that the benefits of single superphosphate application could be related to the improvement in S nutrition of the pasture, and the decline of legume production after fertilization ceased partially attributed to the decrease in S input, the results of the plot experiment suggest that the main limitation to legume production was P availability.
In spite of the declining trend in legume production throughout the study, they produced a marked increase in N availability in the whole system. Mallarino et al. (Reference Mallarino, Wedin, Perdomo, Goyenola and West1990) reported significant amounts of N transferred from legumes to grasses by decaying nodules, roots and shoots in pastures of Uruguay. The other means of N transfer would be through dung and urine deposition of the grazing animals (Ledgard Reference Ledgard2001). This transference was probably relevant to foster the N content of grasses in P2, because this treatment supported higher stocking rates than P1 in most of the rotation cycles. The rate of N cycling was, therefore, probably faster in P2, which increased the N concentration of the herbage.
An examination of the legume component of the sward shows a marked increase in legume production in the first 3 years of the study, declining in the last year of measurement. The higher legume production was in general counteracted by lower grass production, explaining the lack of differences in total herbage yield in the second to fourth years. A similar trend of decreasing grass production following legume introduction and P application was reported in the south of Brazil by Bandinelli et al. (Reference Bandinelli, Gatiboni, Trindade, de Quadros, Kaminsky, Flores and Saggin2005). Although the current study does not show differences between fertilizer rates overall, in many cuts the P2 produced significantly higher amounts of legume herbage than P1 (data not presented). Interestingly the last 2 years, when P was not added, the oversown pastures produced higher grass yield than NG, maybe reflecting the increasing amounts of N being cycled in these swards, as a result of the legume symbiotic N fixation in the previous 4 years. This higher grass production is therefore the residual response to the applied P fertilizer, but without further P inputs the benefits from the residual P fertilizer will be short-lived.
The seasonal trends of pasture N and P contents, with the lowest contents in late summer, have been reported by other authors (Li et al. Reference Li, Hao, Willms, Zhao and Han2009) and can be attributed to the physiology of the different species. Although native pastures are composites of many species, most of the grasses present the highest nutrient accumulation for the spring growth and the lowest at maturity in the seeding period at the end of the summer (Berretta Reference Berretta and Berreta1998; Ferreira et al. Reference Ferreira, Nabinger, Elejalde, de Freitas, Carassai and Schmitt2011). Coates (Reference Coates1994), in a long-term study of pasture fertilization in Australia, also reported seasonal variations of grass P content, which were attributed not only to plant maturity but also to low soil moisture, conditions frequently seen in late summer. Regarding the decrease in lotus nutrient content at the end of the summer, the low leaf to stem proportion could explain the decline in quality of the forage (Hill et al. Reference Hill, Coates, Whitebread, Clem, Robertson and Pengelly2009). Another possible explanation for the declining P content of the oversown pastures is related to fertilizer application at the end of autumn, which is likely to have lost availability after 1 year, given the high P retention of the soils. As mentioned previously, the soil showed rather low available P values, even in the fertilized plots, throughout the experiment.
Similar P concentrations and seasonal trends were reported by Wunsch et al. (Reference Wunsch, Barcellos, Prates, da Costa, Montanholi and Brandao2006) for NG in the south of Brazil, with an average of 0·7 g/kg of P in the forage. The concentration of P in the herbage biomass of NG was insufficient for the nutrition of the calves, according to NRC (1996) and the critical levels reported by Karn (Reference Karn2001), but are within the range reported by other authors in pastures of this region (Berretta Reference Berretta and Berreta1998; Mazza et al. Reference Mazza, Motta, de Moraes, Vezzani, Adami and Rabel2012). On the other hand, given the relatively low stocking rates, the calves were probably able to select the younger leaves, which are likely to present higher nutrient contents than trimmed herbage (Suttle Reference Suttle2010; Avondo et al. Reference Avondo, Secchiari, Battaglini, Bonanno and Pulina2013).
It was expected, given the important increase in P absorption produced by fertilizer application, that the effect of P rate on the amount of P of the mixed pastures would be apparent. However, significantly higher P amounts in the herbage of P2 than in P1 were found only in the third and fourth years, after four and five fertilizer applications, respectively. Haan et al. (Reference Haan, Russell, Kovar, Powers and Benning2007) attributed increases in pasture P uptake when higher cattle stocking rates were used to manure return. In the current experiment, higher P contents were measured in dung collected in the oversown pastures compared with the native grasses (Del Pino & Hernández Reference Del Pino and Hernández2002), which indicates that P cycling was enhanced by the improvement in diet quality.
The weaned calves gained weight throughout the experimental period of each year. There were exceptions, including calves on the NG treatment in the winter of 1997 and in the summer of 1999 and 2001 that lost weight, as did the calves on the P1 treatment in summer 2001. This was unexpected because in those periods the herbage allowance was similar to the other groups. It is possible that the poor performance could be related to extreme weather conditions affecting animal welfare, or to the poor quality of herbage (Birkelo et al. Reference Birkelo, Johnson and Phetteplace1991; Ferreira et al. Reference Ferreira, Nabinger, Elejalde, de Freitas, Carassai and Schmitt2011). In this region of Uruguay the first cause is more likely to occur in winter, because of frost, and the latter in summer, as observed in the current experiment.
The long-term average annual production in Uruguayan extensive grazing systems is 90–100 kg/ha/year, depending on the technology, which is in line with the result obtained in the NG treatment in the current study (Mila & Tambler Reference Mila and Tambler2011). The increased production from oversowing and P fertilizer addition translated into a 1·8- and 2·5-fold increase in animal production for the P1 and P2 treatments, respectively. If this comparison is limited to the first 4 years when fertilizer was applied each year, this translated to a 2·12- and 2·92-fold increase, respectively, highlighting the importance of P fertilizer inputs. The contrasting results from herbage production cuts and animal production data demonstrate the importance of obtaining animal production data when assessing the merits of oversowing and fertilizer.
Considering that the herbage allowance was similar for different groups, the differences in DLWG could be attributed to herbage quality, which is closely related to the nutrient content of consumed herbage (Coates Reference Coates1994). There was a higher response in DLWG and SR to P1 than P2 rate, indicating a higher efficiency of the P1 rate. However, comparing the effect of the treatments in LW throughout the experiment, the production per kg of applied P were 5·102 and 5·193 kg of LWG for the P1 and P2, respectively, indicating a linear response to the P rate. McIvor et al. (Reference McIvor, Guppy and Probert2011), in a review of many experiments that measured response to P application, reported that the response was in general <4 kg LWG/kg P. This linear response contrasts with the flat pasture production response, but is consistent with the response observed in some periods in the herbage P. It is important to note that the superiority of P1 and P2, compared with the native pasture, is not only attributable to fertilizer P, but also to legume introduction, which should be taken into consideration in the technological evaluation of the different options. The interaction of N (crude protein) and P concentration in the pasture quality have been widely recognized (Karn Reference Karn2001).
The effects of each treatment on LWG of the grazing animals in the last two periods, when no fertilizer was added, suggest that there was a cumulative effect of pasture improvement, as was also observed in herbage yield. This residual effect of pasture improvement also has practical implications, because farmers frequently stop fertilizer applications to improved pastures when the legume population declines.
The declining trend in pasture quality, especially regarding lower legume production, throughout the study produced a lessening in the LWG response to pasture improvement. The outline of this trend is the poor performance of all treatments in the second evaluation period, but this could be mainly due to the extreme weather conditions, with drought during winter–early spring and excessive rainfall in late spring–summer. The negative effects of withholding P application from pastures were also observed in New Zealand by Mackay & Lambert (Reference Mackay and Lambert2011), who reported a decline in quality of the pastures after withholding fertilizer inputs, which was reflected in animal production, and this effect was aggravated with time.
The establishment of relationships between LWG and pasture characteristics was aimed at providing tools for pasture management, especially regarding stocking rate. Simple regression relationships were adjusted: a multiple regression was not tested because of the high correlation among the parameters. Other parameters tested (N and P concentration in herbage, grass yield) did not reach statistical significance. Coates et al. (Reference Coates, Kerridge, Miller and Winter1990) reported close relationships between LWG per head and pasture characteristics, but in the current study per head measurement underestimates the whole effect of the treatment; therefore per hectare beef production was considered a better representation of animal performance. The amount of nutrients in herbage is dependent partly on pasture yield, but also herbage quality; hence it is better related to animal behaviour than herbage production. In the separated set of oversown pastures herbage quality was not likely to represent an important limitation; therefore the main parameter determining animal performance was pasture yield. In contrast, in the native pasture the most important limitation was the low nutrient content and this was reflected in the significant effect of the amount of P in herbage. Hill et al. (Reference Hill, Coates, Whitebread, Clem, Robertson and Pengelly2009) in northern Australia developed relationships between mixed pasture characteristics and LW changes. The pastures varied in species composition, with legume/grass and grass-only swards. They obtained positive correlations of per head LW gains with green leaf herbage mass and proportion, diet crude protein (CP), dietary DM digestibility, diet non-grass % and total green herbage mass, but the relationships found were best fitted by an asymptotic model. The LW gains were relatively poorly predicted by dietary CP, compared with green leaf proportions. This was attributed by Hill et al. (Reference Hill, Coates, Whitebread, Clem, Robertson and Pengelly2009) to the good quality of the herbage. It is important to note that in their experiment, the diet CP was measured from faecal samples and represented the consumed rather than the offered herbage N content. In contrast, Ferreira et al. (Reference Ferreira, Nabinger, Elejalde, de Freitas, Carassai and Schmitt2011) comparing native and improved pastures in Brazil reported close relationships of LWG with total forage mass, but in their experiment the main effect of the treatments were on pasture yield, with similar per head gains of the animals grazing the different treatments. Jones (Reference Jones2003) in Australia also reported linear relationships between per head annual LWG and pasture yield until 4000 kg/ha, with an asymptotic trend thereafter.
These relationships have practical implications, providing a useful indicator for assessing performance where animal production data are not available. For low-quality pastures the amount of available nutrients, especially P, in herbage was a better predictor of beef production than herbage yield. For oversown fertilized pastures, in contrast, herbage availability was a good indicator of animal performance. In a given situation the nutrient content of the available herbage could allow the comparison of pastures with different species composition.
This finding emphasizes the importance of including animal performance and not limiting assessments to herbage production when conducting cost-benefit analysis of oversowing and fertilizer investments. Phosphorus availability in the herbage was a better predictor of animal performance than the pasture yield. The current study highlights that the benefits of oversowing and fertilizer inputs are short-lived, with the withholding of fertilizer in the last 2 years resulting in a loss of sown legumes and decline in animal production.
The research was supported by IBRD – Plan Agropecuario (MGAP- Uruguay). The authors would like to thank Alfredo Cambra for his work in the establishment and management of the field experiment and José Zamalvide for advice in the experimental design. The authors also acknowledge Fernando Gorriti for providing the site and animals for the experiment, and his staff for the assistance with the management of the animals. We thank Alec Mackay for advice in the preparation of the manuscript.