


INTRODUCTION
Parasites impose a selection pressure on their hosts, influencing phenotypes and genotypes, and inducing changes at all levels of biological organization (Anderson and May, Reference Anderson and May1981; May and Nowak, Reference Nowak and May1994). Parasite fitness is inherently linked with the ability to transmit to new hosts, the mode and efficiency of which determine the success of any species or strain of parasite. The transmission dynamics of a parasite in a population depend on the interaction of host individuals, with the rate at which susceptible hosts become infected individuals being determined by the contact of susceptible hosts with infectious material and by the probability of the host becoming infected per contact (Begon et al. Reference Begon, Bennett, Bowers, French, Hazel and Turner2002).
For transmission to occur, a parasite must encounter a susceptible host. If the rate of transmission of new infections is proportional to the number of encounters between susceptible and infected hosts, then it can be modelled simply as βSI, where β is a constant representing the probability of contact and then probability of transmission, S is the number of susceptible individuals in a population and I is the number of infected individuals in the population who may transmit the infection (Anderson and May, Reference Anderson and May1981). This is known as density-dependent transmission (Knell et al. Reference Knell, Begon and Thompson1998; McCallum et al. Reference McCallum, Barlow and Hone2001; Begon et al. Reference Begon, Bennett, Bowers, French, Hazel and Turner2002). Both host number and density (hosts in an area) can also determine parasite fitness, which has led to the development of models that take into account changing transmission probability with changing host density (Anderson and May, Reference Anderson and May1981; De Jong, Reference De Jong1995; McCallum et al. Reference McCallum, Barlow and Hone2001; Begon et al. Reference Begon, Bennett, Bowers, French, Hazel and Turner2002). Host density is at its most extreme in social animals, where there is spatial aggregation of potential hosts, most notably in the social insects where within a colony there is also temporal overlapping of generations of genetically similar hosts (Schmid-Hempel, Reference Schmid-Hempel1998). Consequently, sociality is often predicted to be associated with increased disease transmission (Freeland, Reference Freeland1976; Shykoff and Schmid-Hempel, Reference Shykoff and Schmid-Hempel1991; Johnson et al. Reference Johnson, Lafferty, van Oosterhout and Cable2011), although this effect may be mitigated by a decrease in intergroup transmission and highly evolved group-level defences (Hughes et al. Reference Hughes, Eilenberg and Boomsma2002; Traniello et al. Reference Traniello, Rosengaus and Savoie2002; Wilson et al. Reference Wilson, Knell, Boots and Koch-Osborne2003; Boomsma et al. Reference Boomsma, Schmid-Hempel, Hughes, Fellowes, Holloway and Rolff2005).
In social insects, within-group transmission can be at low levels with the transmission coefficient decreasing with increasing host density (Rosengaus et al. Reference Rosengaus, Traniello, Lefebvre and Carlock2000; Hughes et al. Reference Hughes, Eilenberg and Boomsma2002;Traniello et al. Reference Traniello, Rosengaus and Savoie2002). It has been suggested that the social organization within a social insect colony could have evolved to reduce the spread of pathogens, an idea referred to as organizational immunity (Naug and Camazine, Reference Naug and Camazine2002; Naug and Smith, Reference Naug and Smith2007). However, social insect colonies, as with groups of any animal, include multiple phenotypes (castes and ages) and genotypes, which differ in the resistance to parasites (e.g. Baer and Schmid-Hempel, Reference Baer and Schmid-Hempel2003; Baer et al. Reference Baer, Krug, Boomsma and Hughes2005; Poulsen et al. Reference Poulsen, Hughes and Boomsma2006; Ruiz-González and Brown, Reference Ruiz-González and Brown2006; Armitage and Boomsma, Reference Armitage and Boomsma2010; Hughes et al. Reference Hughes, Bot and Boomsma2010; Smart and Sheppard, Reference Smart and Sheppard2012; Roberts and Hughes, Reference Roberts and Hughes2014), something that may have profound effects on the within-group dynamics of parasite transmission. Social insects therefore make ideal models for studying parasite transmission, because their lifestyle of living in dense, highly social groups of related individuals with varying phenotypes and genotypes provides an opportunity to test a multitude of social transmission processes (Schmid-Hempel, Reference Schmid-Hempel1998).
Here we investigate the dynamics of horizontal transmission using the honey bee Apis mellifera and its microsporidian parasite Nosema ceranae as the model system. Nosema ceranae is horizontally transmitted between adult bees through ingestion of infective spores which germinate and infect gut epithelial cells, before proliferating and producing more infective spores which are excreted by the host in the feces, with subsequent transmission to susceptible individuals being either fecal–oral or oral–oral (Fries, Reference Fries2010; Smith, Reference Smith2012). The dynamics of N. ceranae transmission are not fully understood, due to its relatively recent and apparently rapid global colonization of A. mellifera (Higes et al. Reference Higes, Martin-Hernandez, Aránzazu, Martín and Meana2006; Klee et al. Reference Klee, Besana, Genersch, Gisder, Nanetti, Tam, Chinh, Puerta, Ruz, Kryger, Message, Hatjina, Korpela, Fries and Paxton2007). The parasite has, however, been found to infect all castes of adult honey bee: the sterile female workers (Higes et al. Reference Higes, García-Palencia, Martín-Hernández and Meana2007; Fries, Reference Fries2010), the sexual male drones and sexual female queens (Traver and Fell, Reference Traver and Fell2011a , Reference Traver and Fell b ; Botías et al. Reference Botías, Martín-Hernández, Días, García-Palencia, Matabuena, Juarranz, Barrios, Meana, Nanetti and Higes2012). We investigate how transmission rate relates to the ratio of infected to susceptible individuals in a group, by comparing parasite transmission in groups with infected:susceptible (I:S) ratios of 5:5, 4:6, 3:7, 2:8, 1:9, as well as 0:10 control groups. We do this in separate experiments for groups where the infected individuals were either workers or drones, to examine whether the phenotype of infected individuals may alter the transmission relationship. The null hypothesis if the transmission parameter β was constant would be that the number of susceptible individuals which become infected is proportional to IS, and differ respectively by the ratio 25:24:21:16:9 for the I:S ratios we test here.
MATERIALS AND METHODS
Experimental hosts and parasite preparation
Bees were obtained from managed A. mellifera colonies of similar age and size. Bees were obtained from 10 colonies for the experiment in which workers were the experimentally infected individuals and from 9 colonies for the drone experiment, with 4 of the colonies providing bees for both (see Supplementary material). All colonies were confirmed to be free from Nosema infection by screening 30 returning foragers for the presence of Nosema by light microscopy and conventional polymerase chain reaction (PCR) (Chen et al. Reference Chen, Evans, Smith and Pettis2008; see below for details; no control bees developed Nosema infections during the experiment, confirming that this methodology was robust for identifying the general infection status of a colony). To obtain experimental bees of the same age, frames of brood from the colonies were allowed to eclose in incubators at 34 °C, 60% RH, 12:12 light:dark cycle, with newly hatched bees taken from the frame and placed into plastic pots (Ambican 16oz Fabrikal Delipot, 115×95×75 mm) with sterile filter paper on the base of the pots and 50% sterile sucrose solution provided ad libitum. Bees were kept in incubators under the same conditions, in the same pots throughout the whole experiment. Parasite spores were isolated from 100 A. mellifera foragers collected from 5 naturally infected colonies. The ventriculi of the bees was homogenized in 1·5 mL microcentrifuge tubes containing 500 μL molecular grade water using a plastic pestle, and then examined by light microscopy to confirm the presence of Nosema spores. Conventional PCR was then used to identify the species of Nosema (see below). Spore suspensions from bees that were infected by N. ceranae only, through molecular screening, were purified with Percoll centrifugation using a modification of Huang et al. (Reference Huang, Jiang, Chen and Wang2007). The concentration of spores was quantified using FastRead (Immune Systems) disposable haemocytometers. Spore viability was checked using 10% Trypan blue dye staining (Martin-Hernandez et al. Reference Martin-Hernandez, Meana, Garcia-Palencia, Marin, Botias, Garrido-Bailon, Barrios and Higes2009), to allow spore doses to be adjusted to account for non-viable spores. Spores were then diluted in a sterile 50% sucrose solution to make up an infective dose of 2500 viable spores per μL. Fresh spore suspensions were prepared from the same colonies and used for the infections of the drones and workers, respectively, within an interval of 10 days.
Experimental infection
The experiment compared I:S individuals of 5:5, 4:6, 3:7, 2:8, 1:9 or 0:10 (the control groups), with infected individuals being workers in 1 experiment and drones in a second experiment and the susceptible individuals being workers in both (see Fig. S1 for experimental design). To generate infected individuals, 6-day-old bees were individually hand-fed with 10 000 viable N. ceranae spores in a 4 μL sterile sucrose solution using a micropipette. Bees were held in 0·5 μL microcentrifuge tubes with the ends cut off during this process, to reduce their stress levels by minimizing handling and removing the need for anaesthetic. Bees were starved for 1 h before infection to ensure they would fully ingest their dose. Any bees that did not fully ingest their dose were discarded and replaced by another individual. All treated bees were found to be infected by N. ceranae by PCR screening at the end of the experiment and so are described as infected individuals hereafter. Two sets of controls were used throughout the experiments: (a) 5 sham-treated individuals that were fed 4 μL of the sterile sucrose solution and (b) unmanipulated bees. Sterile sucrose solution was used rather than a Nosema-negative Percoll washed bee homogenate; previous optimization of methods showed no difference in survival between bees fed Nosema-negative Percoll washed extract and sucrose solution (Huang et al. Reference Huang, Jiang, Chen and Wang2007; Chen et al. Reference Chen, Evans, Murphy, Gutell, Zuker, Gundensen-Rindal and Pettis2009; Cornman et al. Reference Cornman, Chen, Schatz, Street, Zhao, Desany, Egholm, Hutchison, Pettis, Lipkin and Evans2009; Martin-Hernandez et al. Reference Martin-Hernandez, Meana, Garcia-Palencia, Marin, Botias, Garrido-Bailon, Barrios and Higes2009). Bees were held individually for an hour post-inoculation to minimize bee-to-bee (trophallactic) sharing of their dose, before being placed in groups of like-treated nestmates for 24 h to allow the inoculum to be digested (Crailsheim, Reference Crailsheim1988). After this 24 h period, infected bees were set up in plastic pots with untreated, susceptible bees from their respective colonies to create groups of 10 bees with I:S ratios of 5:5, 4:6, 3:7, 2:8, 1:9 or 0:10 (the control groups). There was 1 group per colony for each I:S ratio, giving 10 replicate groups (i.e. from 10 different colonies) of each ratio when the experimentally infected individuals were workers and 9 replicate groups (i.e. from 9 different colonies) of each ratio when they were drones (Fig. S1). Both infected and susceptible bees were marked with different colour paint dots to allow them to be identified subsequently. The survival of the bees was then monitored daily for 12 days, to allow sufficient time for any transmitted infections to develop whilst avoiding excessive bee mortality. Bees that died during this period, as well as all bees surviving at the end of the experiment, were stored in 90% ethanol at −20 °C for subsequent quantification of parasite infection.
Parasite detection
To determine the infection status of individuals, the ventriculi of bees were individually homogenized in 500 μL of molecular grade water using a plastic pestle. The numbers of Nosema spores were then quantified using FastRead counting chambers, and the remainder of the homogenate used for species-specific PCR analysis of Nosema. DNA was extracted by incubating 75 μL of the ventriculus homogenate for 12 h with Proteinase K (Promega) (5 μL mL−1) at 56 °C, and then boiling with 75 μL of 5% Chelex 100 (Biorad) suspended in 10 μ m Tris Buffer. After centrifugation, the supernatant was stored at −20 °C for molecular analysis. Molecular detection was carried out using N. ceranae and Nosema apis specific primers from Chen et al. (Reference Chen, Evans, Smith and Pettis2008), and the quality of DNA extractions was checked using the LCO-Hym/HCOout primers for the CO1 host control gene (Folmer et al. Reference Folmer, Black, Hoeh, Lutz and Vrijenhoek1994; Prendini et al. Reference Prendini, Weygoldt and Wheeler2005). To ensure accuracy of Nosema detection, a 20% subsample of positive and negative samples from each colony were double checked with additional primers targeting species-specific regions of the RPB1 gene (Gisder and Genersch, Reference Gisder and Genersch2013), which gave from the same results as those found using the Chen et al. (Reference Chen, Evans, Smith and Pettis2008) primers. Reactions were carried out in 96-well microtitre plates in a VertiPCR thermal cycler (ABI), with primer-specific mixes containing 2·5 mm MgCl2 and 2·5 mm dNTPs, 0·2 μ m of each primer, 0·8 U Taq (PROMEGA) and 50–100 ng of DNA in a 10 μL reaction. PCR thermo-cycling profiles for all reactions consisted of an initial denaturing step of 94 °C for 2 min, followed by 35 cycles of 94 °C for 30 s, annealing temperature for 45 s and 72 °C for 2 min, with a final elongation step of 72 °C for 7 min. The annealing temperatures were 50 °C for the host control gene, 61 °C for N. ceranae and 63 °C for N. apis. PCR products were visualized under UV using 1% agarose gels stained with ethidium bromide and compared with a 100 base pair, size ladder. All plates were run with both triplicate negative and positive controls, and all samples were run twice, which in all cases confirmed that negatives were true negatives.
Statistical analysis
All analysis was carried out in R 2.14.2 (R Development Core Team, 2012). As the workers and drones were tested in separate experiments, the 2 datasets were analysed separately. Survival analysis was carried out using the survreg function in the Survival package using default Weibull errors to account for non-constant errors. Frailty models were used in order to include colony as a random factor, with day of death as the response variable and treatment, age and their interaction as the variables. Hazard ratios were extracted from survival models of the hazard of death of infected bees vs the untreated control bees. As there were no differences in survival between the 2 sets of controls (sham-treated bees and unmanipulated bees) they were therefore pooled for calculating the hazard ratios. Transmission potential, as estimated by spore counts, and infection status determined by PCR were both analysed using mixed effects models implemented using the lme4 package (Bates and Maechler, Reference Bates and Maechler2010). Either the spore count or the infection status was fitted as the response variable, with the ratio of I:S individuals as the discrete independent variable and colony as a random factor. Spore counts were modelled with a glmer to allow data to be fitted with a Poisson error structure and included the day of death of each bee to control for any effect of duration of infection on infection intensity. Infection status was modelled as a binomial response (infected or uninfected). Significance was based on model comparison using likelihood ratio tests comparing models of fixed effects to null models with only random effects. Where appropriate we accepted models where the model with fixed effects differed significantly from the null model, and therefore report the total degrees of freedom for the minimal model, as well as the P-value associated with model comparison. Models containing only 1 fixed variable did not require model selection. All models were checked for normality of errors, and homogeneity of variance, through plots of residuals against fitted values and quantile–quantile plots, and no data or models violated the assumptions of analysis. In addition, for the 4 colonies that were used as source colonies for both the drone and worker experiments (see Supplementary material S1), the survival, proportion infected and spore production of the susceptible and infected individuals were analysed together, as described for the separate experiments. This analysis found similar differences between workers and drones to those suggested by comparison of the overall experiments, suggesting that these differences were not simply due to difference in the colonies from which workers and drones originated (see Supplementary material S2). Transmission terms were calculated for each cage of infected to susceptible ratio, and averaged across colonies for each worker and drones treatment, using the simple, mass action model, βSI (Knell et al. Reference Knell, Begon and Thompson1996; Begon et al. Reference Begon, Bennett, Bowers, French, Hazel and Turner2002; McCallum et al. Reference McCallum, Barlow and Hone2002). As we have experimentally controlled population number and area, here S is the number of susceptible hosts, I is the number of infected hosts and β is the transmission coefficient. Calculations of β were also carried out using the number of spores produced by the experimentally infected individuals. Correlations between the transmission coefficient and the I:S ratios were carried out using linear regressions.
RESULTS
Spore production of experimentally infected individuals
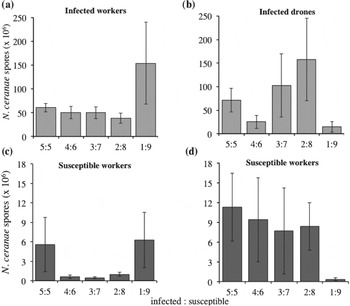
All experimentally infected bees were found to have become infected with N. ceranae, being positive by both PCR screening and visual detection of spores in their ventriculi. None of the control bees were found by light microscopy or PCR to have any Nosema infections. The numbers of spores that the experimentally infected workers and drones produced was highly variable; however, the spore production of workers was significantly affected by the ratio of I:S bees in a group, despite all the infected bees having received the same initial dose of parasite (
 $\chi _{4,7}^2 $
= 12·42, P = 0·014, with control groups excluded; Fig. 1a). Infected workers in groups with between 2 and 5 infected individuals had similar numbers of spores, whereas those in the groups with only a single infected individual produced a much higher number of spores (Fig. 1a). The number of experimentally infected drones in a group was also found to significantly affect the number of spores that they produced (
 $\chi _{4,7}^2 $
= 14·53, P = 0·005, Fig. 1b). Experimentally infected drones had more variation in the average number of spores they produced than did infected workers (Fig. 1), and did not have the high spore production in the groups with a single infected individual that was shown by groups in which the infected individual was a worker.
Mean (±s.e.) number of spores of the N. ceranae parasite in the ventriculi of experimentally infected (a) workers or (b) drones which had been fed a dose of 1×10⁴ N. ceranae spores, and the susceptible workers kept with the experimentally infected (c) workers or (d) or drones for 12 days. Bees were kept in groups with a 5:5, 4:6, 3:7, 2:8 or 1:9 ratio of infected to susceptible individuals. Only bees confirmed by PCR to be infected by N. ceranae are included in the spore counts (all experimentally infected bees and see Fig. 2 for proportion of the susceptible workers which became infected).

Infection of susceptible bees
For the susceptible individuals housed with either experimentally infected workers or drones, there was a significant effect of the ratio of I:S bees on the proportion of the susceptible individuals that became infected (when the experimentally infected individuals were workers:
 $\chi _{4,7}^2 $
= 45·7, P<0·001, Fig. 2a; when the experimentally infected were drones:
 $\chi _{4,7}^2 $
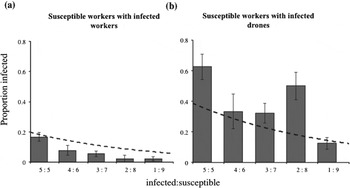
= 99·8, P<0·001, Fig. 2b). The effect of a decrease in the I:S ratio on the numbers of susceptible individuals becoming infected was substantially less than expected if the transmission parameter β was constant (Fig. 2). Susceptible bees were more likely to become infected when the proportion of experimentally infected individuals in their group was greater (Fig. 2). However, there was a dramatic difference between the worker and drone experiments, with many more susceptible individuals becoming infected when they were kept with infected drones than when kept with infected workers (Fig. 2a and b). All susceptible bees in the control groups were found by PCR to be negative for N. ceranae and no spores were found in them when inspected by light microscopy. As with the experimentally infected individuals, the spore production of the susceptible individuals was highly variable. However, the proportion of experimentally infected individuals, either worker or drones, also affected the spore production of susceptible individuals (
 $\chi _{5,11}^2 $
= 9·82, P = 0·028, Fig. 1c, and
 $\chi _{2,6}^2 $
= 11·29, P = 0·003, Fig. 1d, respectively). Susceptible bees that were housed with 2–4 infected workers produced around 6×10⁵ spores, whereas those with 1 or 5 infected workers had 6×10⁶ spores. There was large variation in the spore numbers produced in some treatments. Those housed with 2–5 infected drones had higher numbers of spores than those housed with infected workers, whereas those with a single infected drone had relatively few spores. The variation is partially due to some individuals having very few spores present, or in the case of the 3:7 and 4:6 ratios, is due to some bees (4 and 2 individuals, respectively) having no spores counted despite PCR screening indicating that they were infected.
Mean (±s.e.) proportion of susceptible worker bees who became infected with the N. ceranae parasite after 12 days housed with experimentally infected (a) workers or (b) drones, and kept in groups with either a 5:5, 4:6, 3:7, 2:8 or 1:9 ratio of infected to susceptible individuals. Dashed line represents the expected numbers of new infections that would occur if the transmission coefficient was constant, shown here for the value calculated for the 5:5 ratio.

Survival
Survival was significantly different between those experimentally infected with N. ceranae and the control groups for both the workers and drones (
 $\chi _1^2 $
= 20·5, P<0·001 and
 $\chi _1^2 $
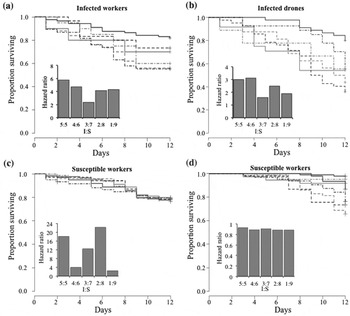
= 12·9, P<0·001, respectively), with infection of Nosema causing higher mortality. Survival of the experimentally infected bees differed significantly depending on the ratio of susceptible to infected bees, both when the infected bees were workers and drones (
 $\chi _5^2 $
= 16·6, P = 0·005 and
 $\chi _{11 \cdot 7}^2 $
= 65·8, P<0·001, respectively; Fig. 3, Supplementary Figs. S2 and S3). Experimentally infected bees in lower ratios of infected to susceptible individuals appeared to survive better (Fig. 3). The survival of susceptible individuals in groups with experimentally infected workers was not found to significantly influence the proportion of infected individuals (
 $\chi _5^2 $
= 0·24, P = 1·0, Fig. 3c), with all groups having a similarly low hazard from N. ceranae exposure and showing very marginally better survival than control bees (hence the hazard ratios of slightly <1). However, the survival of susceptible individuals kept with the experimentally infected drones was markedly different, being significantly influenced by ratio of susceptible to infected individuals (
 $\chi _{11 \cdot 9}^2 $
= 69·2, P<0·001, Fig. 3d), with the survival of susceptible individuals kept with infected drones being substantially worse overall than when kept with infected workers.
Survival graphs of individuals over a 12-day period after exposure to the N. ceranae parasite for (a) experimentally infected worker bees or (b) experimentally infected drones, kept for 12 days with susceptible workers (c) those kept with infected workers and (d) kept with infected drones at either a 5:5, 4:6, 3:7, 2:8 or 1:9 ratio of infected to susceptible individuals (control: solid black line; 1:9 grey small dash line; 2:8 grey large dash; 3:7 black small dash; 4:6 grey solid line and 5:5 black small dash line). Corresponding hazard ratio graphs for each group are included as inset graphs, calculated as the hazard of exposure in comparison to the control groups. Note the difference in y-axis scale between the graphs.

Transmission coefficients
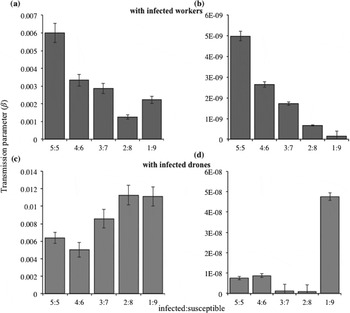
When calculated using experimentally infected individuals as I, the transmission coefficients had a negatively association with the I:S ratio when experimentally infected individuals were workers (F 1,46 = 8·14, P = 0·06, R 2 = 0·64), but positively correlated when they were drones (F 1,46 = 11·4, P = 0·004, R 2 = 0·72, Fig. 4a). Transmission coefficients were substantially lower when the numbers of parasite spores produced by experimentally infected individuals were used as I, and in this case were negatively correlated with the I:S ratio with the exception of the 1:9 ratio in the drone experiment when the transmission coefficient was much greater (worker experiment: F 1,46 = 40·1, P = 0·007, R 2 = 0·90; drone experiment: F 1,46 = 1·5, P = 0·3, R 2 = 0·90, Fig. 4b). The transmission coefficients were in general higher when experimentally infected individuals were drones than when they were workers in both cases.
Transmission parameter of infected workers (a, b) and drones (c, d) housed with susceptible workers in ratios of 5:5, 4:6, 3:7, 2:8 or 1:9 susceptible to infected individuals (a) workers and (c) drones calculated using the number of individuals as the infectious unit and calculated using the spore counts as the infectious units (b) worker and (d) drone, error bars representing the mean standard error of the transmission parameter for each pot of bees.

Discussion
The ratio of infected to susceptible individuals in a group was positively related to the intensity and prevalence of infections in susceptible individuals, but the relationship was much weaker than expected if the transmission parameter β was constant. The effect of the ratio of susceptible to infected individuals appeared to differ depending on the infected phenotype, with more transmission occurring in the experiment in which the infected individuals were drones than when they were workers. Interestingly, the spore production of the experimentally infected bees, whilst highly variable, was not constant across the treatment groups, despite them all having received the same initial parasite dose, suggesting that either the ratio of I:S individuals in a group or the density of infectious hosts affects not only the dynamics of between-host transmission, but also the within-host infection. Although it is possible that some secondary infections may have contributed to the results, these are likely to have been limited because spore production of N. ceranae is low until at least 6 days post-infection (Paxton et al. Reference Paxton, Klee, Korpela and Fries2007; Forsgren and Fries, Reference Forsgren and Fries2010; Fries, Reference Fries2010).
We found that the ratio of I:S individuals influenced the subsequent infection rate of the susceptible individuals and the numbers of susceptible individuals that became infected at the lower I:S ratios were less than expected if the transmission parameter β was a constant. Horizontal transmission of parasites is often dependent on contact between infected and susceptible individuals and is therefore influenced by the ratio of these in a population (Anderson and May, Reference Anderson and May1981, Reference Anderson and May1982; McCallum et al. Reference McCallum, Barlow and Hone2001, Reference McCallum, Barlow and Hone2002). When group size is constant, higher ratios of I:S individuals are predicted to result in higher proportions of susceptible individuals becoming infected (Knell et al. Reference Knell, Begon and Thompson1996; Ryder et al. Reference Ryder, Miller, White, Knell and Boots2007), as found to be the case here. This result indicates that a density-dependent form of transmission may occur in N. ceranae (McCallum et al. Reference McCallum, Barlow and Hone2001, Reference McCallum, Barlow and Hone2002; Begon et al. Reference Begon, Bennett, Bowers, French, Hazel and Turner2002). Interestingly, the effect of the I:S ratio on the probability of susceptible individuals becoming infected with either workers or drones did not match that predicted if the transmission parameter was constant. In some host–parasite systems the relationship asymptotes (Fenton et al. Reference Fenton, Fairbairn, Norman and Hudson2002), but in this case there was a substantial increase in the probability between I:S ratios of 4:6 and 5:5. Potentially this may be due to the increasing infection pressure on the susceptible individuals in these cohorts, as the infection prevalence increases so too may the concentration of parasite propagules in the environment (Matthews et al. Reference Matthews, Reeve, Woolhouse, Chase-Topping, Mellor, Pearce, Allison, Gunn, Low and Reid2009). Individual bees may be able to handle low I:S ratios, avoiding infection by employing individual and social immunity; however, once the ratio becomes more extreme these defences maybe overcome.
The infected to susceptible ratio also influenced the intensity of the infection seen in the susceptible individuals once they became infected. Higher infection levels in susceptible individuals may occur due to multiple infection events, as susceptible individuals in the groups with higher ratios of infected individuals may encounter a larger number of transmission events, effectively receiving a higher overall dose and therefore infection intensity. Interestingly the ratio of infected to susceptible individuals in the group also influenced the intensity of infection seen in the experimentally infected bees, despite them all receiving the same initial dose. In workers, spore production was much higher at an I:S ratio of 1:9 than at higher ratios, whereas in drones the effect was inconsistent, which may in part be due to the greater variation in spore production shown by drones at most of the I:S ratios, with some individuals producing up to 5 times less spores. The effect, however, was significant in both phenotypes, in spite of the variation in the data, so it appears that the I:S ratio does alter the spore production of infected individuals, but not necessarily in a straightforward way. The higher spore production rates may also be due to behavioural differences in the bees. Any individuals that are detected as being infected may be subject to more aggressive treatment or behavioural stressors, or receive less care and social interactions from their nest mates (Moore, Reference Moore1995; Cremer et al. Reference Cremer, Armitage and Schmid-Hempel2007; Cotter and Kilner, Reference Cotter and Kilner2010; Rueppell et al. Reference Rueppell, Hayworth and Ross2010). The cuticular hydrocarbon profile of infected individuals has been known to change following an immune challenge and therefore allow infection status to be determinable by nest mates (Richard et al. Reference Richard, Aubert and Grozinger2008, Reference Richard, Holt and Grozinger2012). The infected individuals may potentially be segregated behaviourally from the other individuals to some extent to minimize parasite transmission, thus influencing the transmission dynamics of the parasite in a context-dependent way. It may be that the greater variation and inconsistency in the spore production of drones was due to them relying on nestmate workers for food and being treated less consistently by them than was the case for other workers. Nosema infection has also been linked to an increase in hunger and behavioural changes in infected individuals, so it is also possible that infected bees may try to engage in more trophallaxis than susceptible bees in order to counter-act the energetic demand of infection (Mayack and Naug, Reference Mayack and Naug2009; Naug and Gibbs, Reference Naug and Gibbs2009).
The transmission rate appeared to be greater in the experiment in which drones were the infected individuals than in the experiment in which the infected individuals were workers. As the drones and workers were tested in separate experiments, it cannot be certain that this reflects a genuine difference in transmission rate between phenotypes, but this seems feasible. The drone and worker experiments were carried out under identical conditions with only a 10-day period between them. While different suspensions of the parasite were used in order to control for viability, these were obtained from the same host colonies and it is unlikely that the genetic composition or infection dynamics of the parasite changed in such a short period. The difference also seems unlikely to be due to differences in the genetic composition of the hosts, because the same effect was present in the subset of colonies that were used in both drone and worker experiments, as in the overall samples (Supplementary information). It is nevertheless possible that some other unknown factor may have affected the results, such as parasite life cycle differences between the host types, and further work is needed to confirm other possible causes. It, however, seems likely that there may be a phenotypic difference in transmission rate in honey bees. Male honey bees have been shown to have increased parasitism rates by the mite Varroa destructor, a known vector of viruses such as Deformed Wing Virus (Fuchs, Reference Fuchs1990; Boot et al. Reference Boot, Schoenmaker, Calis and Beetsma1995; de Miranda and Fries, Reference De Miranda and Fries2008). It is therefore possible that other parasites, as well as Nosema, may have been stressing the drones and thereby in part causing the greater infectivity of drones with Nosema. Sexual dimorphism in transmission rate has previously been attributed to high parasite load or elevated propagule production rate (Perkins et al. Reference Perkins, Cattadori, Tagliapietra, Rizzoli and Hudson2003; Galvani and May, Reference Galvani and May2005; Grear et al. Reference Grear, Luong and Hudson2012), and to males investing less in immunity (Bateman, Reference Bateman1948; Rolff, Reference Rolff2002; Nunn et al. Reference Nunn, Lindenfors, Pursall and Rolff2009). In the case of honey bees, males may also be more susceptible because they are haploid (O'Donnell and Beshers, Reference O'Donnell and Beshers2004) or receive more food by trophallaxis (Higes et al. Reference Higes, Martín-Hernández, Garrido-Bailón, González-Porto, García-Palencia, Meana, Del Nozal, Mayo and Bernal2009; Feigenbaum and Naug, Reference Feigenbaum and Naug2010; Traver and Fell, Reference Traver and Fell2011a , Reference Traver and Fell b ; Smith, Reference Smith2012), and it is also possible that the cell cycle of N. ceranae may be shorter in males than workers. Regardless of the mechanism responsible, if drones do transmit the parasite far more than workers, this may make drones potential ‘superspreaders’ of infection within a colony (Woolhouse et al. Reference Woolhouse, Dye, Etard, Smith, Charlwood, Garnett, Hagan, Hii, Ndhlovu, Quinnell, Watts, Chandiwana and Anderson1997; Lloyd-Smith et al. Reference Lloyd-Smith, Schreiber, Kopp and Getz2005). Pathogen load and shedding rates of parasites are rarely measured in superspreading events (Lloyd-Smith et al. Reference Lloyd-Smith, Schreiber, Kopp and Getz2005), so the heterogeneity in these components that is suggested by our results may potentially be important. Identifying these influential hosts in transmission is beneficial to understanding parasite spread and control, as treatment strategies would be most effective if targeting these individuals (Woolhouse et al. Reference Woolhouse, Dye, Etard, Smith, Charlwood, Garnett, Hagan, Hii, Ndhlovu, Quinnell, Watts, Chandiwana and Anderson1997; Lloyd-Smith et al. Reference Lloyd-Smith, Schreiber, Kopp and Getz2005; Hawley and Altizer, Reference Hawley and Altizer2011).
Transmission of parasites is dependent on contact between infected and susceptible individuals, and therefore the ratio of these in a population. From our data we calculated the transmission coefficient β from a mass action model, with β describing the rate at which susceptible individuals are converted to infected hosts (due to the contact rate and probability of infection per contact; Begon et al. Reference Begon, Bennett, Bowers, French, Hazel and Turner2002). This revealed that the transmission parameter was positively correlated with the I:S ratio, which contrasts with the negative relationship seen in other studies (e.g. Knell et al. Reference Knell, Begon and Thompson1998). There are at least 3 non-mutually exclusive hypotheses that could explain this. First, it may be that Nosema infections show an allee effect, with a minimum number of spores needing to be ingested for infections to be likely to be successful, as is the case for other parasites (Hughes et al. Reference Hughes, Petersen, Ugelvig, Pedersen, Thomsen, Poulsen and Boomsma2004). Second, bees may isolate or avoid interacting with infected individuals which would reduce transmission and such social exclusion may be more effective when the I:S ratio is low. Third, lower frequencies of infected individuals may lead to greater spatial heterogeneity in the deposition of spores and consequently reduced likelihood of susceptible individuals encountering spores when movement in the environment is non-random, although this effect is unlikely in the small containers used in this experiment. The transmission parameter also appeared to be higher when the infected individuals were drones rather than workers, and that the relationship with I:S ratio may also differ between phenotypes. The mechanism of drone transmission is likely to be through a mixture of fecal–oral and oral–oral transmission (Higes et al. Reference Higes, Martín-Hernández, Botías, Bailón, González-Porto, Barrios, del Nozal, Bernal, Jiménez and Palencia2008; Smith, Reference Smith2012). Although we did not carry out quantitative behavioural observations, feces was seen on the filter paper floors of the cages, confirming that defecation took place and thus the potential for the ingestion of spores from feces during grooming or hygienic behaviours. Huang and Solter (Reference Huang and Solter2013) also commented that they found Nosema spores present on the inside of cages, and that spores found in the mouth of bees were likely due to cleaning and grooming behaviours. We observed some drone-to-drone exchange of food during the experimentally set up, when drones were held together for 24 h before being placed with the naive susceptible individuals. Although this behaviour may be rare it suggests that drones will initiate and take part in feeding others, with the potential for parasite transmission. Phenotype-dependent transmission coefficients have been demonstrated previously in Plodia interpunctella infected with B. thuringiensis, in which 5th instar larvae have a higher transmission term than infected 4th instars (Knell et al. Reference Knell, Begon and Thompson1996). This highlights the fact that in a given host–parasite system, transmission dynamics may differ depending on not just the host and/or parasite genetics. The transmission terms do not appear to have a fully linear relationship, which shows, unsurprisingly, that the simple model used here is not sufficient to fully explain the dynamics of this system. Interestingly, the transmission coefficients were substantially lower when calculated using the numbers of parasites spores as I, rather than the number of infected hosts. The very low transmission coefficients for spores indicate the relative inefficiency of transmission in this parasite.
The results emphasize the importance of recognizing the heterogeneity in host–parasite transmission dynamics. The ratio of infected to susceptible individuals can influence not only the probability of a susceptible becoming infected, but also the dynamics of the within-host infection and resulting production of parasite propagules by an infected host, with both also potentially being affected by host phenotype. Understanding the dynamics of parasite transmission, and how this can change with host phenotype, is likely to be fundamental to our comprehension of parasite virulence, as well as for disentangling reciprocal cycles in population sizes.
SUPPLEMENTARY MATERIAL
To view supplementary material for this article, please visit http://dx.doi.org/10.1017/S0031182014001243.
ACKNOWLEDGEMENTS
We thank Bill Cadmore, Sophie Evison and Crystal Frost for technical assistance, Peter Graystock, Jon Ryder and Ben Jones for helpful discussion, and Sophie Evison and 3 anonymous reviewers for valuable comments which improved the manuscript.
FINANCIAL SUPPORT
This work was supported by a Biotechnology and Biological Sciences Research Council studentship to KER.