I. INTRODUCTION
Phase-change materials (PCMs) exhibit a combination of extraordinary properties enabling their application in information storage.Reference Wuttig and Yamada1 First, these materials show a drastic difference in resistivity or reflectivity between amorphous and crystalline phases.Reference Lee, Abelson, Bishop, Kang, Cheong and Kim2,Reference Friedrich, Weidenhof, Njoroge, Franz and Wuttig3 In addition, this class of materials exhibits very fast crystallization kinetics proceeding on a submicrosecond time scale. In some alloys such as germanium telluride (GeTe) the phase transitions can even be as fast as 1 ns.Reference Bruns, Merkelbach, Schlockermann, Salinga, Wuttig, Happ, Philipp and Kund4 Hence, PCMs offer the possibility to create a universal memory combining nonvolatility with dynamic random access memory (DRAM)-like switching speeds.Reference Lankhorst, Ketelaars and Wolters5,Reference Wuttig6 The successful application of PCM in electronic devices is made possible by the remarkable nonlinear I–V characteristics observed in the amorphous state.Reference Wuttig and Yamada1,Reference Ovshinsky7 The electrical resistivity decreases significantly by several orders of magnitude by applying an electric field exceeding a material-dependent critical value typically of 10 V/μm.Reference Krebs, Raoux, Rettner, Burr, Shelby, Salinga, Jefferson and Wuttig8 This sudden breakdown in resistivity is known as the threshold switching effect and the physics behind that phenomenon is still a matter of research. Below this threshold the amorphous state resistivity shows a thermally activated behavior and is observed to increase with aging duration. Furthermore, the increase in resistivity accelerates with annealing temperature.Reference Boniardi, Redaelli, Pirovano, Tortorelli and Pellizzer9 To realize the multilevel storage potential of the PCM technology, it is crucial to identify materials with a stable amorphous state resistivity. Finding suitable materials could result in a massive increase in storage density. Binary phase-change alloy GeTe offers both very fast crystallization kinetics, and a high crystallization temperature of 180 °C, which is attractive for industrial applications.Reference Chen, Rubin and Barton10 However, the drift of the amorphous state resistivity in amorphous GeTe (a-GeTe) is rather high.Reference Luckas, Piarristeguy, Bruns, Jost, Grothe, Schmidt, Longeaud and Wuttig11 Ge15Te85, on the contrary shows much slower crystallization kinetics on a timescale of 100 μs,Reference Chen, Rubin and Barton10 but a more stable amorphous state.
Even though many models attribute the threshold switching and resistance drift effects to trap kinetics,Reference Ielmini and Zhang12–Reference Krebs, Schmidt, Klomfaß, Luckas, Bruns, Schlockermann, Salinga, Carius and Wuttig16 little is known about the defect distribution in amorphous phase-change alloys. As the physical properties can be drastically varied with the proportion of tellurium (Te) content in binary GeTe alloys, this study compares traps state densities of a-Ge15Te85 to two common PCMs a-GeTe and a-Ge2Sb2Te5 with the objective of gaining a better insight into the mechanisms underlying the effects of threshold switching. To get a better insight of resistance drift phenomena the evolution of defect state densities, activation energies of electronic conduction and optical band gaps have been systematically studied in aged and postannealed a-GeTe thin films.
II. EXPERIMENTAL TECHNIQUES USED TO STUDY RESISTANCE DRIFT PHENOMENA AND DEFECT STATE DENSITIES IN AMORPHOUS PHASE-CHANGE MATERIAL THIN FILMS
A. Sample preparation
The thin films studied were produced by direct current (dc) magnetron sputtering using a LS 320 von Ardenne system (Dresden, Germany) and stoichiometric targets of 99.99% purity. The chalcogenide thin films were deposited on substrates meeting the specific requirement of subsequent measurements adjusting the sputtering power to 20 W, the background pressure to 10−6 mbar, and the argon gas pressure to 5 × 10⁻³ mbar. X-ray measurements under grazing incidence revealed that all samples were amorphous after deposition. The thickness of the chalcogenide films was determined from known sputter rates determined in advance for each target. For all films the film thickness was verified using spectroscopic ellipsometry measurements. Both methods gave consistent values for the film thickness d chosen to be ∼200 nm in this study unless stated otherwise.
B. Electrical characterization of resistance drift
For investigating the temporal drift of the amorphous state resistivity a sophisticated set-up has been developed. The system is based on the four-point van der Pauw method. Electrical van der Pauw experiments enable the measurement of sheet resistance R, which is directly related to the resistivity according to ρ = R·d. To realize the required four-point geometry at first four aluminum contacts were sputtered symmetrically on solvent-cleaned 2 × 2 cm2 glass substrates. Subsequently, a chalcogenide thin film (size 1 × 1 cm2) was sputter-deposited centered with respect to the electrodes. A heated sample stage enables study of the change of resistivity during heating. For avoiding oxidation effects these measurements were performed under argon atmosphere.
C. Photothermal deflection spectroscopy
Photothermal deflection spectroscopy (PDS) is based on the mirage effect.Reference Jackson, Amer, Boccara and Fournier17 The sample under study is surrounded by a deflection medium while a monochromatic light source illuminates the sample surface. Due to recombination in available states the material under study heats the deflection medium near the sample surface creating a thermal lens, i.e., a gradient in refractive index, deflecting a laser passing near the sample surface. The deflection angle contains information on the density of defect states within the band gap. In the present study carbon tetrachloride (CCl4) was used as the deflection medium. Monochromatized light from halogen and xenon lamps was used to illuminate a-GeTe thin films. The intensity of the incoming and transmitted light has been detected as well as the deflection angle of a semiconductor laser passing the sample surface at a distance of approximately 30 μm. From these data taken at room temperature, the absorption coefficient α at different photon energies E has been calculated knowing the film thickness d and variation of the refraction index n(E) near the optical band gap E g of the studied a-GeTe thin films to estimate the absorbed light intensity. For achieving a good balance between transmission and reflection in the experiments a film thickness of 500 nm has been chosen.
D. Modulated photocurrent experiments
Modulated photocurrent (MPC) experiments enable a spectroscopy of the defect state density within the band gap. Originally this method has been developed to study photovoltaic materials.Reference Oheda18–Reference Longeaud and Kleider20 Recently, the MPC technique has been applied successfully to amorphous PCMs—a class of chalcogenide materials which generally shows a very low photoconductivity at room temperature.Reference Luckas, Krebs, Salinga, Wuttig and Longeaud21 Generally chalcogenide glasses show n-type conductivity in Hall effect measurements, whereas these alloys demonstrate p-type conductivity in thermoelectric Seebeck experiments. A similar phenomenon is also observed in other disordered materials such as hydrogenated amorphous silicon and is commonly known as the anomalous Hall effect. At this point one should recall that electric and magnetic fields may lead to complex scattering mechanisms resulting in ordinary and anomalous contributions to the Hall conductivity. Whereas the ordinary Hall conductivity mainly depends on the carrier type and concentration, different physical mechanisms may contribute to a nonzero anomalous Hall conductivity. These scattering mechanisms are expected to depend strongly on disorder.Reference Nagaosa, Sinova, Onoda, MacDonald and Ong22 Thermoelectric measurements are based on carrier diffusion induced by temperature gradients. Hence, a thermoelectric approach is expected to give a reliable result for amorphous chalcogenides and consequently p-type conductivity is assumed in this work.
The MPC technique exploits the interaction of free holes with localized hole trap states to gain information about the density of states within the band gap. In these experiments the sample surface is illuminated by a modulated light flux F:
 $$F = F_{{\rm{dc}}} + F_{{\rm{ac}}} \sin ({\rm{\omega }}t)\quad.$$
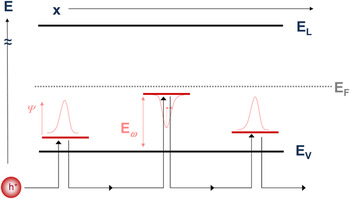
This periodic excitation gives rise to the creation of photoexcited holes induced by band-to-band transitions. However, localized defect states within the band gap capture free holes from the valence band. As long as direct carrier transitions between different localized defect states can be neglected, trapped holes do not contribute to photoconductivity. Nevertheless, captured holes can be thermally released out of the trap toward extended states beyond the valence band edge. As a consequence of these multiple trapping and release processes visualized in Fig. 1, a phase lag φ exists between the hole-driven photocurrent I and the excitation flux F:
 $$I = I_{{\rm{dc}}} + I_{{\rm{ac}}} \sin ({\rm{\omega }}t + \phi )\quad.$$
Hole trap states within the band gap (indicated by red lines and localized wave functions Ψ) capture free holes from the valence band. After a certain time a hole trapped at E ω is thermally released back to the valence band. These trapping and release processes repeat continuously. This interrupted extended state transport is denoted as multiple trapping transport for which the basic MPC formulas are derived by solving the corresponding rate equations, see Ref. Reference Oheda18–Reference Longeaud and Kleider20.

Multiple trapping involves all localized traps within the band gap as illustrated in Fig. 1. However, it has been shown that the photocurrent is dominated by those holes that are trapped and released at the same frequency as the frequency of the light modulation. Hence, only those traps having an emission rate e p(E,T) equal to the excitation frequency ω contribute significantly to the phase shift φ. Solving the corresponding rate equations under the assumptions that the alternating photocurrent I ac is mainly driven by holes and that multiple trapping processes dominate the electronic transport, the reduced defect density Nc/μ can be determined by the following relationReference Brüggemann, Main, Berkin and Reynolds19,Reference Longeaud and Kleider20 :
 $${{c_p N(E_{\rm{\omega }} )} \over {{\rm{\mu }}_p }} = {2 \over {{\rm{\pi }}k_b T}}Aq{\rm{\varepsilon }}_{{\rm{el}}} \cdot g_{{\rm{ac}}} \cdot {{\sin (\phi )} \over {|I_{{\rm{ac}}} |}}\quad,$$
where N is the density of states, c p is the capture coefficient describing the interaction between localized trap states and free holes, μp is the free hole mobility, A denotes the conduction cross-section, q is the absolute value of the electronic charge, k B denotes the Boltzmann constant, εel is the applied electric field, and g ac is the ac generation rate of photo carriers. All parameters of the right hand side including the phase shift φ and the amplitude of the alternating photocurrent |I ac| can be obtained directly from experiment.
The energy scaling of the reduced density N(E ω)c/μ is defined by the fact that only those hole traps whose emission rate e p equals the excitation frequency ω contribute significantly to a nonzero phase shift φ. Thus the relation e p(E ω) = ν p·exp[−E ω/(k bT)] = ω leads to the classical energy scaling valid for all p-type materials, such as a-GeTe, a-Ge15Te85 and a-Ge2Sb2Te5Reference Brüggemann, Main, Berkin and Reynolds19,Reference Longeaud and Kleider20 :
 $$E_{\rm{\omega }} = E - E_{\rm{v}} = k_{\rm{b}} T\ln (\nu _p {\rm{/\omega }})\quad,$$
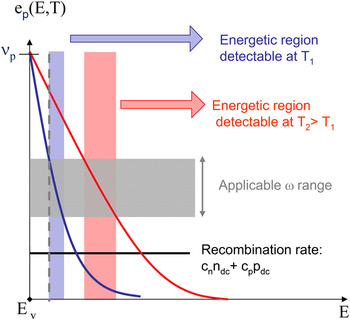
where ν p is the attempt-to-escape frequency of a hole trapped in a defect state located at energy E ω. According to Eqs. (3) and (4) a simple spectroscopy of the quantity Nc/μ within the band gap is possible by measuring couples (φ, |I ac|) at different excitation frequencies ω and temperatures T. Figure 2 illustrates the probed energy ranges for two different temperatures T 1 < T 2 by varying the modulation frequency ω between ωmin and ωmax—the set-up limited ω range used in the experiment. As illustrated in Fig. 2 hole traps near to the valence band edge are probed at low temperatures and high modulation frequency ω, whereas hole traps deep into the gap are measured at high temperatures and low excitation frequency ω.
In p-type materials MPC experiments probe the defect state concentration N of those multiple trapping levels above the valence band edge E v, whose emission rate e(E ω,T) equals the excitation frequency ω of the exciting light source, i.e., e(E ω,T) = ω > recombination rate. The two decreasing full lines represent the variations of e(E,T) with E for two temperatures T 1 (blue) and T 2 (red). At a given temperature T states within a certain energy range can be probed using an applicable ω range (blue shaded range at T 1 and red shaded range at T 2 > T 1). Hence, a systematic variation of excitation frequency ω and temperature T enables a spectroscopic scan of the defect state distribution.

Amorphous chalcogenides generally show a strongly temperature-dependent band gap resulting in a shift of the valence band edge with temperature, i.e., E v= E v(T). Consequently, MPC curves taken at different temperatures do no longer refer to the same zero point of the energy scale as assumed in the classic energy scale. Recent studies have shown that the temperature dependence of the band gap in a-GeTe and a-Ge2Sb2Te5 can be taken into account by a corrected energy scale given byReference Luckas, Kremers, Krebs, Salinga, Wuttig and Longeaud23:
 $$E_{\rm{\omega }} = E - E_{\rm{v}} = k_{\rm{b}} T\ln ({\rm{\nu }}_p {\rm{/\omega }}) - \xi T^2 \quad,$$
where ξ describes the parabolic decrease of the optical band gap with increasing temperature. A detailed discussion of the influence of a temperature-dependent band gap on the MPC energy scale can be found in Ref. Reference Luckas, Kremers, Krebs, Salinga, Wuttig and Longeaud23.
This study compares reduced defect state Nc/μ densities of different amorphous chalcogenides. One should note that that the MPC-DOS Nc/μ is of primary importance for electronic transport phenomena in semiconductors. Indeed, electronic transport phenomena are not influenced by the defect state distribution N(E) alone. States with a high density N but a low capture coefficient c may have the same influence on trapping and recombination as trap states with a low density N but a high capture coefficient c. This influence on the electronic transport is reflected by the Nc product. Furthermore, a semiconductor characterized by a low Nc product and a low extended state mobility will demonstrate transport properties, in terms of carrier flow or current, similar to a semiconductor having a high Nc product and a high mobility. Consequently the reduced density of states Nc/μ is an excellent indicator of the electronic transport properties of semiconductors. Furthermore, it should be recalled at this point that Eq. (3) is only valid for defect states acting as multiple trapping centers (emission rate > recombination rate) but not as recombination centers (recombination rate > emission rate), the recombination rate being defined as c nn dc+ c pp dc, where c n (c p) is the capture coefficient for electrons (holes) and n dc (p dc) is the free electrons (holes) concentration. Therefore, the analysis of MPC data via Eqs. (3) and (4) or Eqs. (3) and (5) enables the investigation of defect state densities within a limited energy range only, i.e., at most from the valence band edge to the dark Fermi level. The attempt-to-escape frequency ν p cannot be measured directly, but an order of magnitude can be estimated within the MPC analysis procedure demonstrated later in this work. Hence, MPC measurements were performed in a large temperature range, which varied in this study from 90 to 300 K. The chalcogenide films studied have been deposited on sapphire substrates (size 1 × 1 cm2) to ensure a good thermal contact on the cold finger of the cryostat during the experiment.
III. RESULTS AND DISCUSSION
A. Defect state densities of electrical switching chalcogenides
Recent studies have shown that the electrical threshold field is strongly material-dependent.Reference Raoux, Cabrera, Devasia, Kurinec, Cheng, Zhu, Breslin, Jordan-Sweet, Rettner, Burr, Salinga and Wuttig24,Reference Krebs, Raoux, Rettner, Burr, Salinga and Wuttig25 A phase-change alloy such as Ge15Sb85, which possesses a small optical band gap E g exhibits a low electrical threshold field E t.Reference Krebs, Schmidt, Klomfaß, Luckas, Bruns, Schlockermann, Salinga, Carius and Wuttig16,Reference Shportko, Kremers, Woda, Lencer, Robertson and Wuttig26,Reference Kremers27 However, materials with similar band gaps as a-GeTe, a-Ge2Sb2Te5 and a-Ge15Te85 exhibit very different threshold fields (see Table I). Consequently, the large variation in E t ranging from 37 V/μm for a-Ge15Te85 to 143 V/μm for a-GeTe cannot be properly described by the difference in optical band gaps alone. With the aim to study the influence of localized defect states on electrical switching, this work compares defect state densities measured by MPC experiments in amorphous deposited a-GeTe, a-Ge2Sb2Te5 and a-Ge15Te85 thin films and relates the defect density to the threshold field.
Electrical threshold fields and optical band gaps for different amorphous deposited chalcogenides taken from the literature as compared with reduced defect state densities Nc/μ describing valence band tail (VB), shallow (L1) and deep (L2) defect state densities presented in this work.

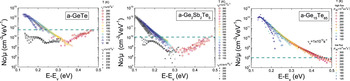
Figure 3 presents MPC spectra using a corrected energy scale according to Eq. (5). These measurements were performed using a light-emitting diode of wave length λ = 850 nm. For all measurements the amplitude of the alternating photon flux was chosen to be 40% of the continuous flux and the continuous photon flux was adjusted to F dc= 1016/(cm2 s) if not stated otherwise. Each MPC curve, defined by a symbol, is taken at a given temperature by varying the excitation frequency f = ω/2π from 12 Hz to 40 kHz in such a way that that f i+1 = f i × 1.5. At a given temperature states closer to the valence band edge are probed at 40 kHz, whereas deeper states are probed at lower frequencies, see Eq. (4) or Eq. (5). Likewise, increasing the temperature T enables a spectroscopy of trap states lying deeper within the gap. Thereby, the temperature steps have to be chosen sufficiently small so that the same trap state density is measured with different pairs of (f,T), see Fig. 2. Consequently, the envelope of overlapping MPC curves taken at different temperatures reveals the probed density of states.
Defect state densities Nc/μ measured by MPC experiments in a-GeTe, a-Ge2Sb2Te5 and a-Ge15Te85 thin films. The MPC data shown here are scaled using Eq. (5), which takes the temperature dependence of the band gap into account. Both phase-change alloys (a-GeTe and a-Ge2Sb2Te5) show three characteristic defect state distributions: valence band tail states probed from 90 to 210 K (VB), shallow defect states located at ∼0.2 eV from the valence band edge E v detected from 220 to 250 K (L1 defects) and deep defect states measured from 260 to 300 K (L2 defects). In contrast to a-GeTe and a-Ge2Sb2Te5, a-Ge15Te85 presents only valence band tail states over the whole investigated temperature range. Amorphous GeTe presents the highest density of deep (L2: Nc/μ = 5 × 10¹⁰/cm2 V/eV) as well as shallow trap states (L1: Nc/μ = 1 × 10¹⁰/cm2 V/eV), followed by a-Ge2Sb2Te5 (L2: Nc/μ = 1 × 10¹⁰/cm2 V/eV and L1: Nc/μ = 4 × 10⁹/cm2 V/eV). In contrast to both PCMs a-Ge15Te85 shows no L1 or L2 defect distributions and valence band tail densities are measured down to Nc/μ = 108/cm2 V/eV close to mid gap.

This is why the value of the attempt-to-escape frequency νp which maximizes the overlap of MPC curves taken at different temperatures has to be chosen to define their energetic position within the forbidden band gap. Since the attempt-to-escape frequency νp reflects the capture cross section of the hole trap considered, its value may differ significantly for different defect state distributions such as band tails, shallow or deep defects.
Both phase-change alloys a-GeTe and a-Ge2Sb2Te5 show three different characteristic defect state distributions: valence band tail states (VB states), shallow defects (L1 states) and deep defects (L2 states). Valence band tail states were probed from 90 to 210 K. The MPC curves describing the valence band tail show the highest overlap adjusting the attempt-to-escape frequency to νp = 1012/s. However, some MPC curves describing the valence band tail distribution depart significantly from the common envelope especially at low excitation frequencies of the modulation flux, see Fig. 3. This departure from the envelope also referred as MPC “tails” is well known in the literature and results from the impact of recombination. The recombination zone is energetically located around the dark Fermi level and its width increases with increasing light flux and decreasing temperature. If the probed states lie energetically in the recombination zone those probed trap states do not act as multiple trapping centers and an analysis of MPC data according to Eq. (3)—valid for multiple trapping centers only—leads to erroneous results. Consequently, these MPC “tails” are not representative of the probed DOS but rather depend on the DOS multiplied by its occupation function, where the latter evolves with the temperature at which the MPC experiment is performed. At very low temperatures MPC ‘tails’ may also result from an increasing influence of hopping conduction.Reference Longeaud and Tobbeche28
In a temperature range from 220 to 250 K shallow defect states are probed. However, these shallow L1 states cannot be properly described by −ν p = 1012/s. Considering the influence of a temperature-dependent band gap to calculate their energetic position with respect to the valence band edge E v, [see Eq. (5)] the attempt-to-escape frequency has to be chosen equal to ν p= 1 × 10¹⁰/s for ensuring a good overlap of these MPC curves taken from 220 to 250 K. Furthermore, a-GeTe and a-Ge2Sb2Te5 demonstrate the presence of a deep defect distribution measured from 260 to 300 K. These deep L2 defects are scaled with ν p = 1012/s.
In contrast to the above two PCMs, the Te-rich alloy a-Ge15Te85 shows the existence of valence band tail states over the whole investigated temperature range investigated from 120 to 300 K. Even with a lower flux F dc= 1015/(cm2 s)—leading to a lower splitting of both quasi-Fermi levels limiting the width of the recombination zoneReference Shockley and Read29,Reference Simmons and Taylor30 —no additional defect state distributions could be detected.
The MPC spectra illustrated in Fig. 3 demonstrate the reduced density of states Nc/μ from the valence band E v edge to the dark Fermi level, which is expected to lie close to mid gap in amorphous chalcogenides.Reference Cohen, Fritzsche and Ovshinsky31,Reference Kastner, Adler and Fritzsche32 Thus a-GeTe shows the highest density of deep L2 defect states Nc/μ = 5 × 10¹⁰/cm−2 V/eV−1, whereas the deep L2 defect state density in a-Ge2Sb2Te5 is significantly lower, i.e., Nc/μ = 1 × 10¹⁰/cm2 V/eV [indicated by the horizontal dashed lines in Figs. 3(a) and 3(b)]. The good glass-former a-Ge15Te85 shows the lowest trap state deep into the forbidden energy gap, i.e., Nc/μ (VB) = 1 × 10⁸/cm2 V/eV. Furthermore, a-GeTe shows the highest density of shallow L1 trap states reaching a maximum value of Nc/μ (0.2 eV)= 1 × 10¹⁰/cm2 V/eV. In comparison to a-GeTe a-Ge2Sb2Te5 shows a lower density of shallow L1 traps, i.e., Nc/μ(0.2eV) = 4 × 10⁹/cm2 V/eV. In contrast to both phase-change alloys no shallow L1 or deep L2 defects could be detected in a-Ge15Te85.
These results, summarized in Table I, underline that not only a wide band gap but also a high density of deep and shallow states Nc/μ in addition to their valence band tail states promote a high electrical threshold field E t. This finding supports a generation-recombination model for electrical threshold switching in amorphous chalcogenides originally proposed by Adler.Reference Adler, Shur, Silver and Ovshinsky33 In this model field-induced generation of carriers over the band gap—such as impact ionizationReference Jandieri, Rubel, Baranovski, Reznik, Rowlands and Kasap34—has to outbalance their recombination in localized defects to fulfill the switching condition. Consequently, this model predicts an increasing threshold field with increasing optical band gap or increasing reduced defect states density Nc/μ.
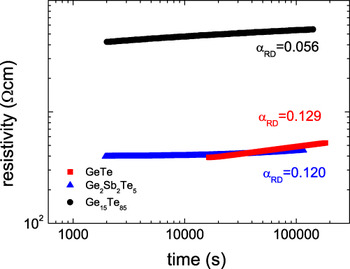
Figure 4 compares the temporal drift of the amorphous state resistivity measured in the three alloys a-GeTe, a-Ge2Sb2Te5 and a-Ge15Te85 at 50 °C. In all the three chalcogenide alloys, the evolution of the amorphous state resistivity at 50 °C is properly described by the power law:
 $${\rm{\rho }} = {\rm{\rho }}_0 (t + t_{\rm{s}} )^{{\rm{\alpha RD}}} \quad.$$
Evolution of the amorphous state resistivity measured during annealing chalcogenide thin films at 50 °C. For a better data visualization the experimental time scale is shifted by t s, see Eq. (6). In all three alloys, this evolution of the amorphous state resistivity is correctly described by a power law. The drift exponent αRD is observed to be rather high in both investigated phase-change alloys a-GeTe (αRD = 0.129) and a-Ge2Sb2Te5 (αRD = 0.120) indicating a strong drift in resistivity. In comparison a-Ge15Te85 shows a much lower value αRD = 0.056 and thus a lower drift in resistivity.

The parameter ρ0 denotes the resistivity measured at the onset of the drift experiment. The parameter t s ≠ 0 illustrates that the starting point of the measurement defined as t = 0 s does not match with the beginning of the drift mechanism of the amorphous deposited thin film, which should be expected to start already during or at least directly after completion of the deposition process. The change of the amorphous state resistivity over time is governed by the drift coefficient αRD, i.e., the stronger the drift the higher the value of αRD. Consequently, the resistance drift in both phase-change alloys GeTe (αRD = 0.129) and a-Ge2Sb2Te5 (αRD = 0.120) is rather strong when compared with a-Ge15Te85 (αRD = 0.056). However, in contrast to both PCMs, a-Ge15Te85 shows only valence band tail states and no additional shallow or deep defect state distributions. These large differences in resistance drift phenomena and defect state densities raise the question of the impact of localized defects states on resistance drift phenomena. This point is addressed in Sec. III. B.
B. Evolution in defect state density in aged a-GeTe thin films
The impact of localized defect states on resistance drift phenomena has been discussed inconclusively and contradictingly in the literature. Whereas some authors propose a structural relaxation of the glassy state leading to defect annihilation,Reference Ielmini, Lavizzari, Sharma and Lacaita15,Reference Karpov, Mitra, Kau, Spadini, Kryokov and Karpov35 there are other authors who claim an increasing defect state distribution with time.Reference Pirovano, Lacaita, Pellizzer, Kostylev, Benvenuti and Bez14
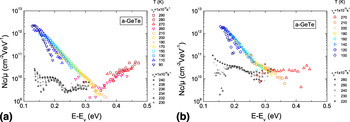
In this section, the temporal evolution of the defect state density in a-GeTe thin films is studied to identify a possible link between trap kinetics and resistance drift. Figure 3 presents MPC spectra taken on the same a-GeTe thin film for different sample ages. To facilitate a better interpretation of data both spectra in Fig. 5 are scaled according to Eq. (5) like all spectra in Fig. 3.
Defect state densities Nc/μ measured by MPC experiments in the same a-GeTe thin film at different sample ages of 29 days (a) and 108 days (b) after deposition. The MPC spectra shown here are scaled according to Eq. (5) taking the influence of a temperature-dependent band gap into account. The temporal change in defect state density shows no simple picture: Whereas deep in the gap a lower trap state density is detected, the density of shallow L1 defects is observed to increase with time as well as the MPC DOS at ∼0.35 eV. In contrast, no drastic change in the valence band tail density can be stated. However, the stronger bending of the MPC curves taken from 100 to 180 K indicates an eventual change of the ξ parameter upon aging which describes the parabolic decrease of the optical band gap with increasing temperature.

Aging demonstrates to have a significant influence on the measured MPC spectra, in particular on the defect levels. With increasing sample age a lower density of deep states is observed as predicted by Ielmini.Reference Ielmini, Lavizzari, Sharma and Lacaita15 At a sample age of 29 days the MPC curves taken from 260 to 290 K describe a clear distribution of deep L2 defect states with a maximum value of Nc/μ = 5 × 10¹⁰/cm2 V/eV. However, 108 days after deposition the MPC curve taken at 270 K describes a broad and flat plateau with Nc/μ = 2 × 10¹⁰/cm2 V/eV. Nevertheless, the temporal evolution of the defect state distribution shows no simple picture. On the one hand, MPC detects a lower deep state density, which favors the model of defect annihilation proposed by Ielmini. On the other hand, MPC reveals an increasing density of shallow L1 defects as proposed by Pirovano.Reference Pirovano, Lacaita, Pellizzer, Kostylev, Benvenuti and Bez14 The maximum value of the MPC DOS describing shallow L1 defects increases from Nc/μ = 1 × 10¹⁰/cm2 V/eV to Nc/μ = 4 × 10¹⁰/cm2 V/eV with increasing sample age. Furthermore, these shallow defect levels are detected in a larger temperature window ranging from 220 to 260 K at an older sample age, indicating a broadening of the L1 defect distribution. Furthermore, the narrow gap between valence band tail and deep L2 states appearing ∼0.35 eV above the valence band edge [see Fig. 5(a)] seems to have disappeared and filled up to a value of 2 × 10¹⁰/cm2 V/eV during aging [see Fig. 5(b)]. In contrast with those deep L2 and shallow L1 defect levels the Nc/μ values describing the valence band tail show no significant change. However, at a sample age of 108 days the envelope describing the valence band shows a slight bending around 0.2 eV, see Fig. 5(b). This bending may indicate that the ξ-value used in the corrected energy scale according to Eq. (5) may have changed slightly upon aging.
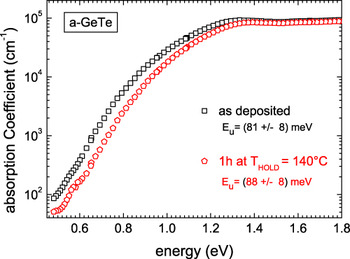
The evolution of band tail state densities was studied further by means of PDS, see Fig. 6. This technique enables a sophisticated measurement of the absorption coefficient α as a function of photon energy E of the incident light. Near the optical band gap (E g∼ 0.8 eV) the absorption coefficient shows an exponential dependence:
 $${\rm{\alpha (}}E{\rm{) = \alpha }}_{\rm{0}} \cdot \exp (E/E_{\rm{u}} )\quad.$$
Absorption coefficient α(E) measured by photothermal spectroscopy (PDS) in amorphous as-deposited and postannealed a-GeTe thin films. The postannealed sample has been heated for 1 h at T HOLD = 140 °C. In both investigated amorphous samples the absorption coefficient α increases first exponentially with increasing photon energy E, i.e., α(E) ∼ exp(E/E u). Annealing shows no significant influence on the Urbach energy E u, which reflects the width of the valence and conduction band tails. Even though no drastic change in the band tail states upon annealing could be verified by PDS, these measurements reveal a shift of α(E) toward higher photon energies. This shift upon annealing is caused by band gap opening.Reference Krebs, Schmidt, Klomfaß, Luckas, Bruns, Schlockermann, Salinga, Carius and Wuttig16

The Urbach energy E u describing the exponential increase of absorption coefficient reflects the width of the exponentially decaying valence and conduction band tails.Reference John, Soukhoulis, Cohen and Economou36 However, even though annealing for 1 h at 140 °C shows a significant increase in the amorphous state resistivity no clear change of the Urbach energy E u can be measured. Together with the MPC results presented in Fig. 5 this finding indicates that neither the valence band nor the conduction band changes upon resistance drift. Even though no change in the Urbach energy E u could be detected, our PDS measurements clearly demonstrate a shift of α(E) toward higher photon energies. This shift indicates an opening of the optical band gap upon annealing. In amorphous materials the optical band gap can be identified with that energy E g at which the absorption coefficient equals α(E) = 104/cm.Reference Stuke37 Using this definition of an optical band gap for disordered structures the band gap increases from E g = 0.85 to E g = 0.93 eV. This band gap widening has a strong influence on the activation energy of conduction E a describing the thermally activated behavior of the amorphous state resistivity ρ:
 $${\rm{\rho }} = {\rm{\rho }}_0 \exp (E_{\rm{a}} /k_{\rm{b}} T)\quad.$$
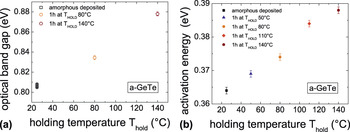
Figure 7 compares optical band gaps with activation energies E a in amorphous-deposited and postannealed a-GeTe thin films annealed for 1 h at the indicated holding temperature T HOLD. Upon annealing the optical band gap E g and the activation energy of conduction E a are observed to increase leading to an increasing amorphous state resistivity according to Eq. (8). These results clearly show the impact of band gap opening on resistance drift. The impact of band gap widening has also been verified for a-Ge2Sb2Te5 in recent studies.Reference Fantini, Brazzelli, Cazzini and Mani38
Optical band gaps E g and activation energies of conductivity E a measured in amorphous deposited and postannealed GeTe-thin films heated for 1 h at the indicated holding temperature T HOLD. Optical band gaps and activation energy increase upon annealing, where the increase is linear with increasing holding temperature T HOLD.

Crystalline and amorphous PCMs demonstrate a very different bonding character. Resonant bonding in their crystalline phase leads to ordering and alignment of p-orbitals on adjacent molecular units. In this symmetric atomic arrangement, the valence electrons resonate between bonds of the original cubic lattice. For normal two-center bonds, the matrix element M is about one bond length. In consequence of resonance bonding the aligned chains yield to M values of typical two bond lengths giving rise to high transition matrix elements and coordination numbers higher than expected from the 8-N rule.Reference Shportko, Kremers, Woda, Lencer, Robertson and Wuttig26,Reference Lencer, Salinga and Wuttig39,Reference Huang and Robertson40
However, in disordered PCMs the resonant bonding character breaks down and consequently the band gap in the amorphous phase becomes larger than in the crystalline state due to different extensions of the atomic wave function. Furthermore, Edwards et al.Reference Edwards, Pineda, Schultz, Martin, Thompson and Hjalmarson41 have shown that the free carrier transport in c-GeTe is determined by the Ge vacancy. The Ge vacancy is the most easily formed defect in rhombohedral GeTe pinning the Fermi level close to the valence band edge. In contrast the Fermi level in a-GeTe is pinned near the middle of the forbidden energy gap. The Fermi level pinning in amorphous PCMs most probably originates from defects having a negative electron correlation energy, i.e., negative-U, hindering to detect those defects by Electron Spin Resonance.
IV. CONCLUSION
This work has demonstrated the role of localized defect states on threshold switching and resistance drift phenomena in amorphous PCMs. In chalcogenides with similar optical band gaps a strong correlation between threshold field and trap state density is found: Those alloys which show a high electrical threshold field also show a high density of shallow and deep trap states. This result supports a generation and recombination model of electrical switching. In addition we provide direct experimental proof for a decreasing deep defect concentration as proposed in the Ielmini model. However, no simple evolution of defect state density with time is observed in a-GeTe. Whereas the density of deep states near the Fermi energy decreases, the density of shallow defects increases with increasing sample age. In contrast to the deep L2 and shallow L1 defect levels no drastic change in the band tail densities is observed. Nevertheless, even though band tail state densities remain unchanged the resistance drift effect in a-GeTe is strongly linked to band gap opening.