I. INTRODUCTION
Polymer based nanocomposites, both thermosetting and thermoplastic, find application in various engineering fields, including electronics, aeronautical, and biomedical applications. Reference Qian, Greenhalgh, Shaffer and Bismarck1 Carbon nanotube (CNT) reinforced polymers offer functional properties through improved electrical conductivity, mechanical reinforcement, and better thermal dimensional stability of the nanocomposite. The combination of high performance properties of polymers with mechanical, thermal, and electrical properties of CNTs can lead to nanocomposites exhibiting light weight, mechanical strength, and enough electrical conductivity to prevent charge build-up. Furthermore, CNT nanocomposites incorporating microscopic fibers in a hierarchical multiscale composite can potentially improve the thermal dimensional stability by reducing the mismatch in thermo-elastic properties of the nanoreinforced matrix and the fibers, resulting in lower thermal residual stresses in multiscale composite materials. Reference Qian, Greenhalgh, Shaffer and Bismarck1,Reference Kravchenko, Misiego, Qian, Kravchenko, Pips and Manas-Zloczower2
The effective thermal expansion behavior of nanocomposites below glass transition temperature, T g, is controlled by the coefficient of thermal expansion (CTE) of the system, which is a function of elastic and thermal expansion properties of the constituents. Previously, a significant reduction of CTE in the range of 20–40% with 1 wt% was reported for CNT/epoxy nanocomposites. Reference Wang, Liang, Gonnet, Liao, Wang and Zhang3 The reduction in the nanocomposite CTE is due to the significantly higher elastic modulus and low CTE of the individual nanotubes in comparison to the neat polymer properties. To better understand and predict the nanocomposite structure-property relationships, material models incorporating micromechanical relations can be used, but they have to be validated for a range of CNT volume contents and for different material systems. Two different polymer matrices were considered in the present work, namely, polyimide (PI) and epoxy. PI matrices offer chemical inertness and high temperature resistance, while incorporation of carbon fibers within the PI matrix shows promise for tough and strong laminates. Reference Jiang, Bin and Matsuo4,Reference Hou, Johnston and Clair5 Similarly, epoxy resins are widely used in fabricating various composite structures.
Predictive micromechanical material models offer a design tool in fabrication of functional materials. However, the micromechanical prediction of the effective properties solely based on the volume fraction of the constituents cannot usually capture the experimentally observed behavior due to the complex morphologies observed in CNT/polymer nanocomposites. Reference Jiang, Bin and Matsuo4,Reference Misiego and Pipes6,Reference Ogasawara, Ishida, Ishikawa and Yokota7 The pathway to establish consistent micromechanical models is to incorporate morphological features observed in nanocomposites. Various experimental studies over the years have reported the bundle morphology of polymer nanocomposites. Reference Misiego and Pipes6,Reference Paiva, Zhou, Fernando, Lin, Kennedy and Sun8,Reference Guo, Sreekumar, Liu, Minus and Kumar9 Some of the existing models focus primarily on incorporating various aspects of the CNT-bundle morphology like waviness, reduced aspect ratio, and agglomeration. Reference Fisher, Bradshaw and Brinson10–Reference Shi, Feng, Huang, Hwang and Gao12
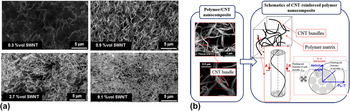
The present study considered a PI CNT based nanocomposite with different volume contents of nanofillers. The dispersion of CNTs was found to be uniform and forming noticeable bundles composed of individual CNTs at higher concentrations (Fig. 1). Reference Misiego Arpa13 A hierarchical model of the CNT bundle structure including the effect of individual CNT helicity within the CNT bundle was proposed recently. Reference Kravchenko, Misiego, Kravchenko, Pipes and Manas-Zloczower14 The helicity in CNT bundles was related to the percolation threshold assuming that the tangent of the helix angle changes linearly with the bundle diameter [Fig. 1(b)]. The proposed hierarchical model of the bundle yielded close correlation with the experimental data for the bundle diameter and effective Young’s modulus for a wide range of CNT volume fractions in a PI matrix. The proposed model determined the parameters influencing the mechanical reinforcement of CNTs, such as the volume content at percolation, CNT agglomeration into bundles with helical morphology, and the resulting bundle volume fraction.
(a) Dispersion quality of CNTs in PI at different CNT volume contents; (b) schematics of the bundle morphology in polymer/CNT nanocomposites showing helical hierarchy.

In the present work, the hierarchical model of CNT bundles was used to predict the effective CTE of PI based CNT nanocomposites. The proposed model yielded close predictions with the experimental data within a range of CNT content up to 9 vol%. Experimental data were obtained using a digital image correlation (DIC) setup Reference Kravchenko, Kravchenko, Casares and Pipes15 to measure the thermal strain and differential scanning calorimetry (DSC) with dynamic mechanical analysis (DMA) to determine the glass transition temperature, T g. Previously published results for the CTE of epoxy/CNT systems Reference Wang, Liang, Gonnet, Liao, Wang and Zhang3 were used to discuss the role of the aspect ratio of CNTs on the CTE of the nanocomposite. The present work introduces a comprehensive relation between the morphology of the CNT nanocomposite and the resulting effective thermal expansion behavior.
II. MATERIALS
PI/CNT nanocomposites were synthesized by in situ polymerization under sonication. Reference Park, Ounaies, Watson, Crooks, Smith, Lowther, Connell, Siochi, Harrison and Clair16 Single wall CNTs used in nanocomposites were supplied by Carbon Nanotechnologies, Inc. (Houston, Texas), and manufactured by high-pressure catalytic decomposition of carbon monoxide (HiPCO process). Anhydrous grade N,N′-dimethylacetamide (DMAc) was used as a solvent. After 3 h of polymerization under sonication, films were cast on glass plates and DMAc was removed at 80 °C under vacuum; the polymer was thermally imidized by a series of isothermal steps at 150, 250, 300, and 350 °C, thereby obtaining PI-CNT films of 25–35 μm in thickness. Details of the experimental procedure for the preparation of nanocomposite films are described in Appendix.
III. EXPERIMENTAL METHODS: DIGITAL IMAGE CORRELATION MEASUREMENT OF THERMAL DEFORMATION
The CTE of nanocomposites was measured using a DIC procedure previously proposed for measuring the unconstrained dilatational strain in unfilled polymers. Reference Kravchenko, Kravchenko, Casares and Pipes15 A rubber stamp with white paint was used to create a random circle speckle pattern on the surface of the nanocomposite film. The stamp with white paint was applied on the surface of the film and carefully removed. The stamping procedure allowed creating a speckle pattern on the top surface of the film and was used for DIC analysis. The thickness of the sample was measured before and after stamping to ensure that the layer of the white paint was not causing significant increase in the film thickness. Increase in the sample thickness was undesired to avoid interference with the experimental measurements and to complicate the interpretation of the results. The thickness of the layer of paint was found to be significantly small (less than 1 μm) compared with the average thickness (25–35 μm) of the nanocomposite film.
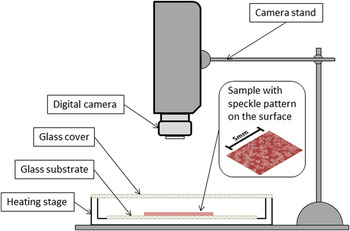
After creating a random pattern, a rectangular sample was cut from the nanocomposite film with dimensions of about 15 mm by 20 mm. Next, the sample was placed on the glass substrate to allow frictionless sliding during the thermal expansion through heating. The glass substrate was placed inside the heating stage, which was covered with transparent glass to allow recording of the sample deformation during the experiment (Fig. 2). A thermocouple was placed in the proximity of the sample to enable more accurate temperature reading. The experimental procedure included increasing the temperature inside of the heating stage and allowing sufficient time for the sample to reach thermal equilibrium (10–15 min). A number of incremental temperature steps were completed, ranging from 25 to 125 °C. For each equilibrated temperature, a picture was taken by using the digital camera placed over the sample (Fig. 2). The pictures corresponding to different temperatures were analyzed using DIC software together with the reference image of the sample corresponding to ambient temperature conditions. The software used in this work incorporated free access DIC code.
Reference Eberl, Gianola and Bundschuh17
The unconstrained thermal expansion of the polymeric film induced constant free thermal expansion which was calculated using the DIC data reduction procedure. The average thermal strain,
 ${\varepsilon _{\rm{T}}}^{(av)}$
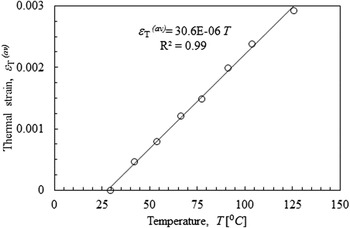
, in the sample was calculated and plotted as a function of temperature, rendering CTE of the CNT-PI film given by the slope of the line in Fig. 3.
Digital image correlation experimental setup.

Representative thermal expansion strain data.

IV. RESULTS AND DISCUSSION
Controlling the thermal expansion of polymeric systems has many practical applications. For example, decrease in the CTE of nanocomposites can be useful in reducing thermal deformation and stresses. Reference Kravchenko, Misiego, Qian, Kravchenko, Pips and Manas-Zloczower2,Reference Kravchenko, Li, Strachan, Kravchenko and Pipes18 Such thermal residual stresses are known to adversely affect the strength of the composite materials. Reference Agius, Joosten, Trippit, Wang and Hilditch19,Reference Zhao, Warrior and Long20 Incorporation of CNTs within fiber reinforced polymer composites can lower temperature induced residual stresses by reducing the mismatch in thermo-elastic properties between the nanocomposite matrix, continuous fiber reinforcement, and adhesively bonded joints. Reference Qian, Greenhalgh, Shaffer and Bismarck1,Reference Kravchenko, Misiego, Qian, Kravchenko, Pips and Manas-Zloczower2 On the other hand, the operational temperature range of the polymer nanocomposite is determined by T g, below which the composite displays material stiffness. Therefore, it is important to ensure that nanocomposite T g is not reduced by the incorporation of CNTs.
A. Thermal expansion coefficient and glass transition temperature of polymer nanocomposites
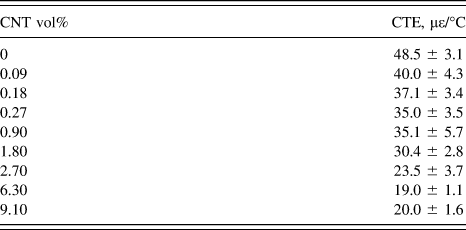
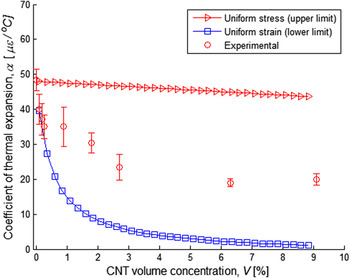
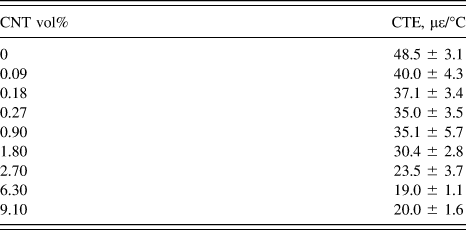
The CTE experiment was repeated up to 5 times for the different PI/CNT nanocomposites. The average values and corresponding standard deviation of CTEs are given in Table I. The thermal expansion of PI/CNT films decreased with the increasing CNT content for all samples up to 6.3 vol% CNT (as much as 60% when comparing with the neat PI films); however, addition of CNTs above 6.3 vol% resulted in a slight increase in the CTE. Furthermore, the glass transition behavior of PI/CNT nanocomposite was investigated. Previous studies indicated that the incorporation of CNTs into PI matrix can result in increase Reference Ogasawara, Ishida, Ishikawa and Yokota7,Reference Mo, Wang, Chen and Yeh21 or decrease Reference Siochi, Working, Park, Lillehei, Rouse, Topping, Bhattacharyya and Kumar22,Reference Yuen, Ma, Chiang, Lin and Teng23 of the glass transition temperature. The effect of CNTs on T g depends on the nanofiller dispersion and interfacial bonding with the polymer. Proper dispersion of CNTs results in reduction in chain flexibility from increased constraints of polymer chain movement causing increased T g.
CTE and glass transition temperature for PI/CNT nanocomposites.
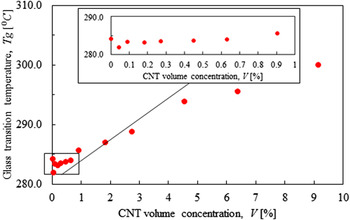
DSC was used to measure the glass transition temperature following ASTM E1356-08 procedure. 24 The middle point T g was determined from a dynamic heating ramp for the films with different CNT volume contents. The DSC allowed investigating how the incorporation of CNTs affected the glass transition temperature of nanocomposite. Reference Misiego Arpa13 The glass transition temperature of PI/CNT films showed a small decrease by about 1 °C for CNT concentrations below 0.27 vol% which can be related to fluctuations in monomer ratio used in PI synthesis (Fig. 4). However, the gradual increase in T g with the CNT volume content above 0.27 vol% was observed. When the distance between CNTs in a nanocomposite is reduced, the polymer chain movement is more constrained, which produced an increase in T g.
Glass transition temperature of the PI/CNT nanocomposite.

B. Micromechanical analytical model of nanocomposite thermal expansion behavior
A micromechanical model of nanocomposite should provide a comprehensive relation between the individual mechanical and thermal properties of the constituents, CNT and polymer matrix, respectively. The observed CNT bundle morphology in polymer/CNT nanocomposites (Fig. 1) should be incorporated into the micromechanical model to allow the accurate prediction of the composite thermal expansion behavior. In the present work, the CNT bundle morphology was modeled as helical CNT structures and was used to determine the effective CNT bundle properties. The effective bundle properties were then used to predict the thermal expansion coefficient of the polymer nanocomposite.
Following work of Schapery,
Reference Schapery25
the lower and upper bounds of the thermal expansion of two phase composite material can be estimated using the simplifying assumptions of the homogenized stress,
 ${\alpha ^{(\bar \sigma )}}$
, and homogenized strain,
 ${\alpha ^{{\rm{(}}\bar \varepsilon {\rm{)}}}}$
, in the nanocomposite using Eqs. (1) and (2). Experimental studies of SWNT thermal expansion using the X-ray diffraction technique reported the coefficient of radial thermal expansion to be equal to −1.52 με/°C.
Reference Yosida26
Furthermore, earlier studies by Ruoff et al.
Reference Ruoff and Lorents27
on carbon nanotube thermal expansion indicated the isotropy of the thermal expansion in radial and axial directions; therefore, values reported in Ref. Reference Yosida26 were used herein,
 $${\alpha ^{{\rm{(}}\bar \sigma {\rm{)}}}} = {\alpha _{{\rm{CNT}}}}{V_{{\rm{CNT}}}} + {\alpha _{\rm{m}}}{V_{\rm{m}}}\quad ,$$
 $${\alpha ^{\left( {\bar \varepsilon } \right)}} = {{{\alpha _{{\rm{CNT}}}}{E_{{\rm{CNT}}}}{V_{{\rm{CNT}}}} + {\alpha _{\rm{m}}}{E_{\rm{m}}}{V_{\rm{m}}}} \over {{E_{{\rm{CNT}}}}{V_{{\rm{CNT}}}} + {E_{\rm{m}}}{V_{\rm{m}}}}}\quad ,$$
where subscripts CNT and m denote the material properties of CNT and polymer matrix, respectively; α and E are CTE and the Young’s modulus, respectively: αCNT = −1.5 με/°C; E CNT = 742 GPa Reference Misiego and Pipes6,Reference Pipes and Hubert11 ; αm = 48.5 με/°C, E m = 3.6 GPa Reference Misiego and Pipes6 ; V denotes the volume fraction of the corresponding component of the composite.
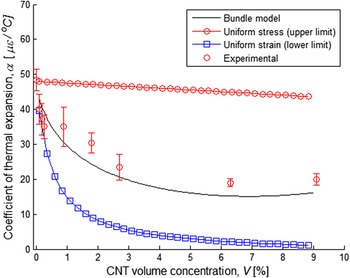
In Fig. 5 the upper and lower bounds of CTE as a function of the CNT volume content are plotted for a PI/CNT system. The expressions (1) and (2) impose strong assumptions of either homogenized stress or strain in the composite, respectively, that can only serve as an approximation to the composite thermo-mechanical response. However, these expressions do not reflect the arrangement or morphology of the individual CNTs in nanocomposite, specifically the existence of CNT bundles. Therefore, it is not surprising that these model approximations do not yield a close estimation of the experimentally determined CTEs in the whole range of the CNT volume content. The wide range of CTE values as defined by the homogenized stress and strain conditions is also due to the significant difference in the thermo-mechanical properties between CNT and polymer. The Young’s modulus of PI is over two orders of magnitude lower than the Young’s modulus of CNT. Consequently, the micromechanical prediction which is based on the assumption of homogenized stress significantly overestimates the nanocomposites effective CTE, whereas the prediction based on homogenized strain underestimates the CTE. The experimental data shown in Fig. 5 compare closely with the homogenized strain prediction at low CNT content (<1 vol%) and resembles the overall homogenized strain prediction: the sharp decrease of CTE at low concentrations of CNTs is followed by a plateau behavior at higher CNT concentration. As noted by Schapery, Reference Schapery25 the uniform strain assumption is more appropriate for the random arrangement of stiff fibers, which represents the case of CNT bundles in a polymeric matrix. Therefore, it is evident that the micromechanical model given by Eq. (2) has to be corrected to reflect the actual nanocomposite morphology to capture the experimental trend in the thermal expansion behavior found for PI/CNT nanocomposites.
Experimental results with upper and lower bounds for nanocomposites’ CTE.

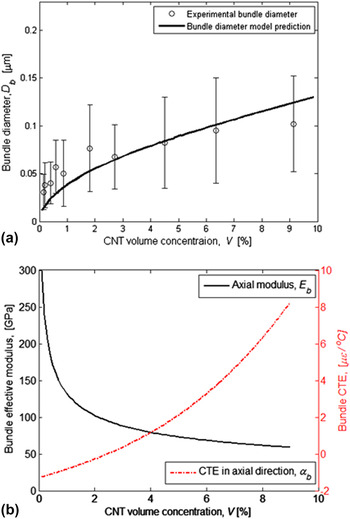
To account for the actual bundle morphology in the homogenized strain expression, effective bundle properties need to be determined. The diameters of CNT bundles were found to increase with the CNT volume content [Fig. 6(a)]. Reference Misiego and Pipes6 The CNT bundles in PI nanocomposite were measured experimentally by voltage contrast scanning electron microscopy (SEM) in a FEI NOVA nanoSEM field emission SEM using the through-the-lens detector, operating at 10–20 kV accelerating voltage (20 kV for low CNT concentration samples), ∼5 mm working distance, and 30 μm aperture. The CNT bundle diameter was determined from high magnification images (50,000×) from a minimum of 40 measurements. Reference Misiego and Pipes6
CNT bundle diameter (a) and the effective thermo-elastic properties of CNT bundle (b) as a function of individual CNT volume content in polymer nanocomposite (PI/SWCNT).

The agglomeration of the individual nanotubes resulted in twisting of CNTs inside the bundle. A hierarchical CNT bundle model was previously proposed to phenomenologically incorporate the effect of bundle morphology on the effective properties of nanocomposites and showed close correlation between predicted and the experimentally measured bundle diameters [Fig. 6(a)]. Reference Kravchenko, Misiego, Kravchenko, Pipes and Manas-Zloczower14 The bundle model considers the helical arrangement of individual CNTs and shows direct correlations between the CNT volume content, bundle diameter, and the volume fraction occupied by the bundles. A bundle diameter increase was related to the percolation of CNTs that marks the formation of the global connectivity/network of CNTs in the nanocomposite. Reference Nan, Shen and Ma28 As shown in the schematics in Fig. 1(b), the bundle is formed by individual CNTs that wrap around neighboring CNTs to create helical like structures. A simplifying assumption was made regarding the tangent of the helical angle, which was assumed to increase linearly with the bundle radius. The assumption is based on the textile fiber analogy, in which fibers are assumed to follow helical paths along the length of the yarn. Reference Pipes and Hubert11 In the present case, fibers are replaced with CNT bundles. Therefore, the bundles themselves become substructures, which are composite in nature. Consequently, the effective properties of the bundle need to be calculated. To predict bundle properties, the model based on the layered cylinder analogy Reference Pipes and Hubert11,Reference Pipes and Hubert29 was used. The model presents an analytical elasticity based solution of the composite with helical anisotropy and was shown to predict the thermo-mechanical response of the CNT based nanocomposites. Reference Kravchenko, Misiego, Kravchenko, Pipes and Manas-Zloczower14 The layered cylinder model provided a convenient modeling approach to incorporate the CNT bundle geometry within the micromechanical model.
Utilizing a homogenization approach, the effective thermo-mechanical properties of the bundle were determined [Fig. 6(b)]. Reference Pipes and Hubert11,Reference Pipes and Hubert29 The increased angle of helicity caused the axial stiffness of the bundle to decrease nonlinearly with the CNT content. Consequently, the axial CTE of the bundle increased at higher CNT content.
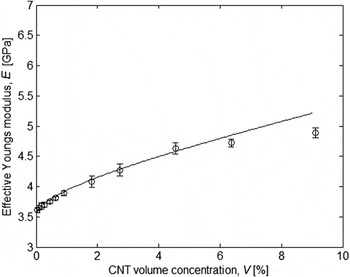
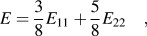
Concurrently, the nanocomposites modulus, E, was calculated considering the proposed CNT bundle morphology using the Halpin–Tsai Reference Tsai, Halpin and Pagano30 model for the random orientation of reinforcement and accounted for bundle waviness and aspect ratio (Fig. 7),
 $$E = {3 \over 8}{E_{11}} + {5 \over 8}{E_{22}}\quad ,$$
where E 11 and E 22 are the effective moduli for the aligned bundle in the longitudinal and transverse bundle directions given by the self-consistent micromechanical relations. Reference Pipes and Hubert29 The details of the micromechanical relationships are given in Ref. Reference Kravchenko, Misiego, Kravchenko, Pipes and Manas-Zloczower14.
PI/CNT nanocomposite Young’s modulus: hierarchical bundle model and experimental results.

The morphological attributes of CNT bundles were implemented into the micromechanical model of the thermal expansion behavior by using the layered cylinder model which predicted the nonlinear behavior of the effective thermo-elastic bundle properties with CNT concentration. Axial thermal expansion and the modulus of bundle as a function of CNT volume content were used instead of the respective properties of CNTs in Eq. (2). Therefore, the uniform strain model, which predicts the experimentally observed trend in the CTE behavior of nanocomposite (Fig. 5), was modified to incorporate the bundle effective properties. The denominator in Eq. (2) was replaced with nanocomposite Young’s modulus prediction (Fig. 7). As a result, the proposed model, given by Eq. (4) and denoted as the hierarchical bundle model, yielded significantly improved prediction of nanocomposite CTE (Fig. 8),
 $$\alpha = {{{\alpha _{\rm{b}}}{E_{\rm{b}}}{V_{\rm{b}}} + {\alpha _{\rm{m}}}{E_{\rm{m}}}{V_{\rm{m}}}} \over E}\quad ,$$
where αb is the bundle axial CTE, E b is the bundle axial effective modulus, V b = V/(f s.b f b) is the bundle volume fraction where f s.b = 0.65 and f b = 0.74 are subbundle and bundle packing volume fractions (Fig. 1) and V is the CNT volume content, E is the Young’s modulus of nanocomposite determined using Eq. (3) and the self-consistent micromechanical model. Reference Kravchenko, Misiego, Kravchenko, Pipes and Manas-Zloczower14,Reference Hashin31
Comparison between model prediction and experimental data for CTE of PI/CNT nanocomposites.

As depicted in Fig. 8, a slight increase in the nanocomposite CTE was observed both experimentally and from the hierarchical bundle model prediction at CNT volume fractions exceeding 6 vol%. This behavior was attributed to an increased helicity of the outer CNT layers in the bundle at higher CNT concentrations, limiting the effectiveness of the CNT reinforcement.
C. Analysis
The proposed morphological model of CNT bundles suggested that percolation in the nanocomposite system occurs by the microscopic bundles rather than the individual CNTs. The onset of percolation is strongly related to the bundle aspect ratio, AR, i.e., the ratio between bundle length and diameter. Percolation also affects helicity of the bundle that in turn controls the effective properties of CNT based nanocomposite. Therefore, the main features of the proposed micromechanical models are (i) higher volume fraction of the bundle when compared with individual CNTs and (ii) bundle effective properties, which change with the CNT volume content due to the increased helicity.
The present model allows studying how percolation, bundle effective properties, and aspect ratio affect the nanocomposites effective CTE. As predicted by the layered cylinder model, the CNT bundle effective properties strongly decrease with increased entanglement in the bundle in a nonlinear fashion. Therefore, it would be possible to obtain greater mechanical reinforcement and greater reduction in the nanocomposites CTE by simply decreasing helicity in the bundle as a result of using CNTs with lower AR.
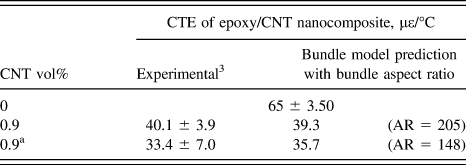
Previously reported results confirm this hypothesis. A greater reduction in the CTE of oxidized-CNT/epoxy nanocomposites at the same CNT volume fraction was achieved, when reducing the CNT aspect ratio through a milling procedure. Reference Wang, Liang, Gonnet, Liao, Wang and Zhang3 The smaller value of CTE for nanocomposites containing CNTs that underwent milling is counter-intuitive. However, using the hierarchical helical bundle model to evaluate the effect of a reduced filler aspect ratio on nanocomposites CTE can explain the results. Higher aspect ratio results in lower filler volume content at percolation as predicted by the percolation theory. The proposed hierarchical CNT bundle model connects the higher volume fraction at percolation to the lower bundle helicity which has critical effects on the thermo-elastic bundle properties. Therefore, the bundle model provides an explanation for the experimentally observed phenomena of reduced nanocomposite (CNT/epoxy) CTE after mechanical chopping (Table II), attributing it to the lower aspect ratio of the bundle which translates into reduced helicity inside the CNT bundle and, therefore, higher mechanical properties above percolation threshold.
Epoxy-CNT nanocomposite experimental results obtained by Wang et al. Reference Wang, Liang, Gonnet, Liao, Wang and Zhang3 and model prediction for CTE.
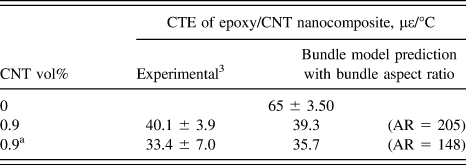
a After mechanical chopping of CNTs.
V. CONCLUSIONS
The presented micromechanical model based on the simple homogenized strain condition provided close correlation with the experimental data when real morphology attributes, like hierarchical bundle morphology with twisted (helical) CNT arrangement inside the bundle, was accounted for. Incorporation of CNT helical bundle morphology in the micromechanical model explained the experimentally observed nonlinear trend in the coefficient of the thermal expansion behavior of PI/CNT nanocomposites with variable CNT concentration. The minimum CTE of CNT/PI nanocomposite as measured experimentally and predicted by the micromechanical model occurred at around 6 vol% CNT. The effective bundle properties were calculated by the layered cylinder analogy method. The presented model provided an approach to consider the effect of the CNT volume content at percolation, CNT bundle volume fraction, and helicity on the thermal expansion behavior of polymer nanocomposites.
Furthermore, the model yielded an explanation for the lower reported CTE values in epoxy nanocomposites using mechanically chopped CNTs. This phenomenon was attributed to the lower CNT aspect ratio, which resulted in an increase in CNT volume content at percolation leading to smaller degree of entanglement (helicity) inside the bundle, thus rendering improved bundle mechanical properties. Therefore, reduced bundle helicity to further reduce CTE of nanocomposite can be achieved through better CNT dispersion to reduce bundle diameter and by controlling the bundle aspect ratio.
The glass transition temperature of PI/CNT nanocomposites showed a slight reduction (1 °C) at low CNT concentration (up to 0.27 vol%) with a steady increase (up to 14 °C) at higher CNT volume fraction. The combination of reduced effective CTE and preserved or improved T g renders nanocomposites suitable for various engineering applications. Such functional composite materials offer improved the thermal dimensional stability with reduced residual thermal stresses from processing and during lifetime. The micromechanical model for thermal expansion behavior offers a tool for better understanding the thermo-mechanical structure–property relationships in polymer nanocomposites.
ACKNOWLEDGMENT
Oleksandr G. Kravchenko, Xin Qian and Ica Manas-Zloczower acknowledge the financial support of the National Science Foundation through grant PIRE-1243313.
APPENDIX
The monomers used for PI synthesis were 3,3′,4,4′-benzophenonetetracarboxilic dianhydride (BTDA) and 4,4′-oxydianiline (ODA). The surfactant used for nanotube dispersion was sodiumdodecylbenzene sulfonate (SDBS). For a composite with 25 wt% polymer in solution, containing 1 wt% CNTs and 0.2 wt% SDBS with respect to polymer, 0.13 g of CNTs was first dispersed in 39 g of anhydrous DMAc for 2 h under bath sonication, with mechanical stirring under constant nitrogen flow. 4.925 g of ODA (99.96% pure, 0.025 mol) and 0.026 g of SDBS were added to the CNT suspension and sonicated for 30 min before adding 8 g of BTDA (99% pure, 0.025 mol). For nanocomposites with high CNT concentration, solution viscosity was significantly increased and homogeneous mixing of polymer solutions containing 25 wt% polymer was not possible. Polymer concentration was accordingly reduced from 25 wt% to 20, 15, and 10% for composites containing 5, 7, and 10 wt% CNTs, respectively. The general synthesis protocol described above was designed for optimum CNT dispersion and processability after testing the effect of polymer concentration, amount of surfactant, and sonication time. Reference Misiego Arpa13 The values for CNT concentration in units of vol% were determined from the actual mass of raw CNTs added to the composite and the density of SWNTs based on the measured diameter. Reference Misiego Arpa13