Implications
Near-infrared reflectance spectroscopy (NIRS) was evaluated as a technique to assess alpaca fibre diameter, staple length and other related traits, measured in greasy samples. The best calibration models, developed by a multivariate regression method, were able to obtain useful predictions for fibre diameter and spinning fineness. Other variables were poorly predicted. As diameter of fibre is one of the most important variables related to textile quality, NIRS can be employed as an effective technique to evaluate the product and to assist alpaca breeders in the identification of superior animals.
Introduction
Alpaca (Vicugna pacos) is the most important domestic species among South American camelids for commercial fibre production, particularly in the Andean high plateau. The ability of alpacas to adapt to high altitudes allows the use of extensive areas of natural pastures, which represent a difficult environment for other domestic species. Alpaca fibre is highly appreciated by the textile industry and competes well with cashmere and mohair, having worldwide acceptance because of its high textile quality (Frank et al., Reference Frank, Hick, Gauna, Lamas, Renieri and Antonini2006). There are several traits of commercial importance in alpaca fibre, depending on the textile industrial stage, some being more important in early, for example, scouring; other in latter processes, for example, fabric properties such as ‘comfort factor (CF)’, that is, percentage of fibres with diameter<30 μm (McGregor et al., Reference McGregor2006). However, some traits are important throughout the whole process such as fibre diameter. Diameter is the main criterion to determine the price, processing performance and end-use in most animal fibres, such as sheep wool (Stobart et al., Reference Stobart, Russell, Larsen, Johnson and Kinnison1986), mohair (Hunter, Reference Hunter1993) and alpaca fibre (Frank et al., Reference Frank, Hick, Gauna, Lamas, Renieri and Antonini2006). Hence, much effort has been invested to develop measurement methods for fibre diameter that are rapid, precise and efficient. Among the methods used to measure sheep's wool fibre diameter and its parameters are the projection microscope, Airflow, Laserscan and Optical Fiber Diameter Analyzer (OFDA), whose specifications are given by agencies such as The International Wool Textiles Organization (IWTO). However, despite the fact that these methods are the most commonly employed, they have the disadvantage of being expensive and in some cases slow and tedious.
Near-infrared reflectance spectroscopy (NIRS) is a technique that is non-destructive, fast and multiple, as several traits can be predicted simultaneously. Samples can be scanned without any pre-processing, and it has low operation costs (Givens et al., Reference Givens, De Boever and Deaville1997). High precision and accuracy can be attained if appropriate predictive equations are developed. It also has a low environmental impact, as it requires no chemicals for the determinations. It is a technique that can measure the chemical composition of biological substances based on the NIR absorption spectra, through H-related bonds, such as C–H, O–H and N–H groups. Such links generally possess high vibrational frequencies and result in overtones and combinations (stretching and bending) of active fundamental vibrations in the mid-infrared region (Shenk et al., Reference Shenk, Workman and Westerhaus2008). With these mixed signals, overlapping absorption bands are common, particularly in complex molecules. Appropriate calibration methods are therefore required to extract relevant information and develop useful models to predict the analyte of interest, or a particular quality of the samples (Bosco, Reference Bosco2010). This technique has been studied in the wool textile industry mainly for measurements of residual grease, moisture content, wool contamination (Slack-Smith et al., Reference Slack-Smith, Fong and Douglas1979; Hammersley et al., Reference Hammersley, Townsend, Graystone and Ranford1995; Church and O'Neill, Reference Church and O'Neill1999) and mean fibre diameter (MFD) in both clean and greasy Merino wool (Cozzolino et al., Reference Cozzolino, Montossi and San Julian2005). In a preliminary study with alpacas in Australia (Gishen and Cozzolino, Reference Gishen and Cozzolino2007), NIRS was evaluated to predict the fibre diameter and other characteristics of the fibre of this South American camelid. Calibration equations of moderately predictive quality were obtained and the authors concluded that NIRS is a potential analytical method that can be used as a rapid semi-quantitative ranking tool for shorn fleeces and to assist in the selection of superior animals. They also advocated for further research in this area to develop improved calibrations.
As little information exists on the prediction of fibre diameter and other traits in alpacas with NIRS, and none developed with animals from the centre of origin of this species, the aim of this research was to expand the study of the application of NIRS technology to predict fibre diameter and other textile properties in unprocessed fibre samples of alpacas.
Material and methods
Samples
Samples of alpaca fibre (n = 291) of ∼10 g each were taken from the mid-side of the animals, which presents more uniformity with respect to the MFD (Aylan-Parker and McGregor, Reference Aylan-Parker and McGregor2002). The alpacas, males and females, of three different ages (1, 2 and 3 years old) and four different colours, that is, white, black, light fawn (LF) and brown, were all of the Huacaya breed, from two alpaca-producing zones in Peru (Puno and Huancavelica). Samples from Puno were provided by the Estación Experimental Quimsachata, INIA, Illpa, located at 4025 m.a.s.l., latitude 15°41′39″S, longitude 70°36′24″W. Samples from Huancavelica were provided by the Centro de Investigación y Desarrollo de Camélidos Sudamericanos Lachocc, Universidad Nacional de Huancavelica, located at 3860 m.a.s.l., latitude 12°47′06″S, longitude 74°58′17″W.
Reference analysis
To obtain the reference data, samples were analysed at the Textile Fibre Laboratory of the Instituto Nacional de Tecnología Agropecuaria (INTA), Bariloche, Argentina, using OFDA (OFDA-2000, Interactive Wool Group (IWG) Pty, Australia). Variables analysed included MFD, standard deviation of fibre diameter (SDFD), coefficient of variation of fibre diameter (CVFD), mean fibre curvature (MFC), standard deviation of fibre curvature (SDFC), CF, spinning fineness (SF) and staple length (SL).
Spectra collection and analysis
Spectral measurements, analysis and calibrations were carried out at the NIRS Laboratory, Institute of Animal Production, Faculty of Agricultural Sciences, Universidad Austral de Chile, at Valdivia, Chile. Spectra were collected in reflectance through the visible (VIS) and near-infrared (NIR) region (400 to 2498 nm) at 2 nm intervals, producing a total of 1050 data points. Each sample was divided into three sub-samples, which were placed in circular cells of 35 mm diameter and 10 mm depth, inserted in a spinning module and scanned in an NIRSystems 6500 (NIRSystems, Silver Springs, MD, USA) monochromator. Average reflectance spectrum for each sample was stored as log (1/R) for further analysis and calibrations.
A principal component analysis (PCA) was applied to the spectral data to highlight relevant absorption patterns. This technique reduces absorbance data to a few ‘synthetic’ variables – linear combinations of the original data – called PCs, which are uncorrelated, preserving the main variation of the spectra (Robert et al., Reference Robert, Devaux M and Bertrand1996). The first PCs reveal the main information in the data, whereas the last ones contain mostly noise. In this way, patterns of variability (loadings) can be related to relevant absorption bands.
A personal computer and the software WINISI II v. 1.04 (Infrasoft International, ISI, Port Matilda, PA, USA) was employed to operate the spectrometer, collect the spectra and for the handling and analysis of the optical data.
Calibrations
Prediction models were developed by modified partial least squares regression (Shenk and Westerhaus, Reference Shenk and Westerhaus1993). Various mathematical treatments were applied to the spectral data, testing none, first or second derivative order (‘Norris’ derivative), with different subtraction gaps and smoothing segments. Treatments are described by four digits (e.g. 2, 4, 4 and 1), where the first digit indicates the derivative order (two is the second derivative of log [1/R]). The second number is the gap or interval in data points over which the derivative or subtraction is performed. The third and fourth digits are the segments in number of data points for the first and second smoothing of the spectral data (Shenk and Westerhaus, Reference Shenk and Westerhaus1993). Derivatives are applied to resolve overlapping peaks and to remove linear baselines. In addition, standard normal variate (SNV) and detrend were also tested to enhance useful spectral features of the samples. SNV is applied to scale each spectrum by its own standard deviation and to correct shifts in the y-axis. Detrend removes base-line curvature caused by interactions of moisture and particular effects across the NIR spectral range (Barnes et al., Reference Barnes, Dhanoa and Lister1993).
Full one-out cross-validation was applied to limit the number of PLS terms in the calibration model and to calculate a standard error of cross-validation, also referred to as root mean square error of cross-validation (RMSECV) and a coefficient of determination of cross-validation (R 2CV; Shenk and Westerhaus, Reference Shenk and Westerhaus1993). The best models were those with lowest RMSECV and a highest residual predictive deviation (RPD), that is, the ratio of standard deviation to RMSECV. An RPD value greater than three has been considered adequate for analytical purposes in most NIRS applications for agricultural products (Williams, Reference Williams2001). Equations with RPD values between two and three can be used for classification (ranking) purposes.
For those variables that presented encouraging results (RPD ⩾ 2) an external validation was performed by splitting the original calibration set in a new calibration (n = 200) and a validation (n = 91) set. Selection of samples was accomplished according to the neighbourhood H limit (Shenk and Westerhaus, Reference Shenk and Westerhaus1994). The same mathematical treatments selected in the first calibration phase were employed. Prediction performance against reference values was evaluated by control limits suggested for the coefficient of determination (R 2), standard error of prediction (SEP), slope and bias. According to Shenk and Westerhaus (Reference Shenk and Westerhaus1994), the SEP and bias should not exceed 1.3 and 0.6 times the SEC, respectively.
The calibration procedures were developed with the above-mentioned WinISI II software.
Results
Sample characteristics
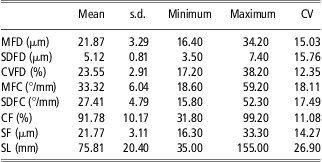
All the alpaca fibre traits evaluated show wide ranges (Table 1) with coefficients of variation over 10%, the lowest being CF and the highest SL.
Statistical parameters for the variables measured in alpaca fibre samples
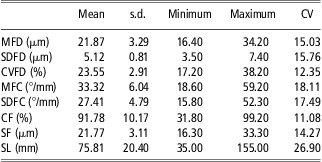
CV = coefficient of variation (%) = (s.d./mean) × 100; MFD = mean fibre diameter; SDFD = standard deviation of fibre diameter; CVFD = coefficient of variation of fibre diameter; MFC = curvature degree; SDFC = standard deviation of curvature degree; CF = comfort factor; SF = spinning fineness; SL = staple length.
NIRS spectra of samples
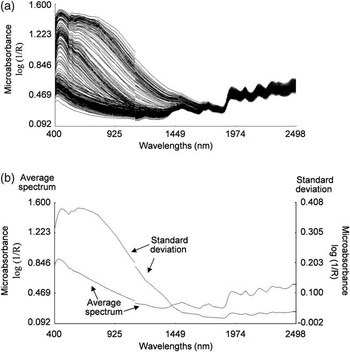
The absorbance data for the whole calibration set of samples (Figure 1a) show a remarkable variability, particularly in the segment that includes the VIS region (400 to 1100 nm). In the NIR region (1100 to 2500 nm), several absorption bands are also shown. The average spectra and the standard deviation of the absorption data for the whole VIS and NIR region (400 to 2500 nm) are shown in Figure 1b. The mean spectrum (data in the left y-axis) shows absorption bands in the NIR region at 1500 and 1740 nm corresponding to stretch first overtones of N–H and S–H groups, respectively. In addition, absorption bands around 1940 nm were observed, corresponding to second overtones of OH groups, related to the moisture content of the fibres. Likewise, absorption bands at 2170 and 2280 nm were observed, which are related to deformation and combination of C–H groups associated with amino acids. A band at 2055 nm can be related to a combination band of N–H groups present in protein compounds in the fibres.
Near-infrared reflectance spectra (microabsorbance data) of all samples (a) of alpaca fibre used in the calibration set. Average spectrum and standard deviation of the absorbance data (b).

The standard deviation of the spectrum (absorption data in the right y-axis) shows prominent values in the VIS range, explained by important differences in colours, with decreasing variability as wavelengths increase. In the NIR range, smaller variations may be noted at some points, mostly related to the main absorption bands in the average spectrum.
PCA
The whole set of spectral data was restructured into seven new synthetic, uncorrelated variables (PCs), which comprised 100% of the spectral variation. Of these, the first four PCs explained 99.97% of total spectral variability (PC1: 95.58%, PC2: 3.66%, PC3: 0.60% and PC4: 0.13%).
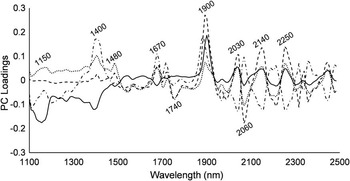
The patterns of spectral variation, or loadings, explained by the first four PCs are depicted in Figure 2 for the NIR range, showing several bands. Positive loadings for PC1 are found at around 1900, 2030, 2140, 2246 and 2438 nm. Negative bands are apparent at 1150 and 1390 nm. PC2 shows a higher number of small positive and negative bands along the NIR range. PC3 presents a rather flat tendency, with a few positive peaks (at 1890, 2030, 2140 and 2250 nm) and one negative band at 2060 nm. PC4 also shows several positive and negative bands. Positive loadings are seen at 1400, 1670, 1880, 2060, 2180, with a double band between 2310 and 2350 nm. Negative signals are apparent at 2030 and 2140 nm.
Loadings for principal component PC1 (—), PC2 (⋯), PC3 (– – –) and PC4 (–·–) of alpaca fibre in the near-infrared (NIR) range.

NIR prediction of fibre variables
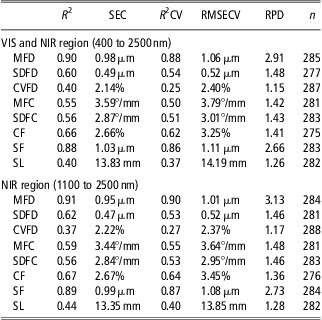
The best calibrations obtained in different traits for alpaca fibre using the whole VIS–NIR or only the NIR regions are presented in Table 2, which includes certainty (R 2CV) and uncertainty (RMSECV) parameters for the equations, determined by cross-validation. The best equations were selected by means of the ratio between the standard deviation of the reference values in the calibration set and the RMSECV, ratio known as the RPD.
Statistical parameters of the best calibrations obtained for the prediction of variables determined in alpaca fibre samples

R 2 = coefficient of determination in calibration; SEC = standard error of calibration; R 2CV = coefficient of determination in cross-validation; RMSECV = standard error of cross validation; RPD = residual predictive deviation (s.d./RMSECV); n = number of samples remaining in calibration, after removing outliers; VIS = visible range of the spectrum; NIR = near infrared range of the spectrum; MFD = mean fibre diameter; SDFD = standard deviation of fibre diameter; CVFD = coefficient of variation of fibre diameter; MFC = mean fibre curvature; SDFC = standard deviation of fibre curvature; CF = comfort factor; SF = spinning fineness; SL = staple length.
Most equations obtained with the NIR region resulted slightly better than those obtained with the complete range (VIS–NIR). The best calibration models tested by cross-validation for predicting the MFD (RPD = 3.13) and SF (RPD =2.73) restricted to the NIR region, were obtained with mathematical treatments that did not require any derivative or the scatter correction of spectral data (0, 0, 9, 1 and 0, 0, 10, 1, respectively).
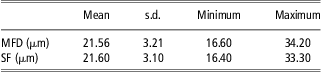
External validation was performed for MFD and SF, which were the only variables with promising results in cross-validation. The reference values of the above variables in the set of samples (n = 91) selected for prediction (Table 3) are similar to the MFD and SF in the original calibration set (Table 1).
Statistical parameters for MFD and SF for the external validation set of samples (n = 91)
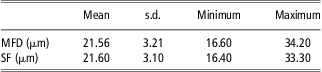
MFD = mean fibre diameter; SF = spinning fineness.
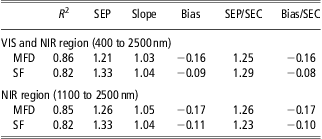
Results of validation (Table 4) were very similar when using the whole spectra (VIS–NIR) or only the NIR segment, and marginally poorer to those obtained by cross-validation.
Statistical parameters obtained for the prediction of MFD and SF in external validation

MFD = mean fibre diameter; SF = spinning fineness; R 2 = coefficient of determination in validation; SEP = standard error of prediction (or performance); SEC = standard error of calibration; VIS = visible range of the spectrum; NIR = near infrared range of the spectrum.
Discussion
In this work, NIR spectroscopy was evaluated as a tool to predict relevant textile traits in raw staples of fibre of Huacaya alpacas from two important South American centres of alpaca production, located in Perú.
Sample set description
The high variability found in the fibre traits is characteristic of this species. This variability is encouraging because to develop dependable NIRS equations an important condition is to have a wide and also even distribution of values. It is important as well to have a calibration set of samples representing the variability to be met when performing routine analysis (Murray, Reference Murray1986).
The wide variation of MFD (16.4 to 34.2 μm) was comparable to that reported (16 to 31 μm) by Huanca et al. (Reference Huanca, Apaza and Lazo2007) for alpacas from two communities (Cojata and Santa Rosa) in Puno, Perú. Likewise, MFD variations between 17 and 31 μm in alpacas from Huancavelica were reported by Montes et al. (Reference Montes, Quicaño, Quispe, Quispe and Alfonso2008). In other countries, moderate ranges between 23 and 34 μm in Huacaya alpacas have been found (Lupton et al., Reference Lupton, McColl and Stobart2006; Gishen and Cozzolino, Reference Gishen and Cozzolino2007). Differences in MFD can be attributed to genetic and non-genetic effects such as age of the animals and the environment in which they are raised.
Spectra
In general, the absorption bands in the sample set were similar to those reported for sheep wool (Cozzolino et al., Reference Cozzolino, Montossi and San Julian2005) and alpaca fibre in Australia (Gishen and Cozzolino, Reference Gishen and Cozzolino2007). The different absorption bands observed are consistent with different components expected in fibres. Moisture at 1940 nm and protein-related compounds at 2055, 2170 and 2280 nm (Murray, Reference Murray1986; Cozzolino et al., Reference Cozzolino, Montossi and San Julian2005; Gishen and Cozzolino, Reference Gishen and Cozzolino2007) are expected, as fibres are highly hygroscopic and mostly made from a complex set of proteins. Thus, high absorption bands of amines and sulphur compounds are not unusual, as sheep wool contains more than 170 proteins, comprising 18 of the 22 naturally occurring amino acids; the same is the case for alpaca fibres. Several of these proteins present a higher content of sulphur amino acids compared with other proteins, and an important degree of cross-linking explained mainly by disulfide bonds, which are formed during keratinisation of the fibre (Rippon, Reference Rippon1992). Variations in absorption bands in the VIS range result from changes in colours, accounted for by differences in the presence, type and concentration of pigments. In this region, the eumelanin and pheomelanin pigments might have a strong absorption (Ozeki et al., Reference Ozeki, Ito, Wakamatsu and Thody1996). A high variability in alpaca colour for the Huacaya breed has been described, and although white animals have been increasing in numbers, efforts are being made to conserve different colours (Oria et al., Reference Oria, Quicaño, Quispe and Alfonso2009).
The loadings of the four first PCs in the NIR range (Figure 2) show several absorption bands explaining the contribution, positive or negative, of each PC to the average spectral variation. These can be assigned to water, at around 1400, 1900, 2030 and 2140 nm; to proteins and related compounds, at 1480 to 1530, 1920, 2030 to 2060, 2180 to 2200 and at 2310 nm; to lipids at 1150, 1400, 1700 to 1750, 2140, 2250 and 2350 nm. Associated to proteins are signals from disulfide bonds in the range of 1890 to 1920 nm. Several of these absorption bands have been detected for alpaca fibre (Gishen and Cozzolino, Reference Gishen and Cozzolino2007) and sheep wool (Cozzolino et al., Reference Cozzolino, Montossi and San Julian2005) samples. Loadings for different PCs are coincident in few bands, for example, all positive (and strong) at around 1900 nm, where water and disulfide bonds are absorbing. In several bands, PCs show diverging values for their loadings. That is the case at around 1400 nm (water and lipids) and at 1670 nm, with negative loadings for PC1 and positive for the rest. At 2030 nm (protein), 2150 nm (water, lipids) and 2250 nm (lipids) only PC4 show negative loadings, whereas at 2060 nm PC4 is the only PC with positive loadings. These differences are consistent with the uncorrelated nature of PCs and can be helpful when assessing to which extent original variables, namely wavelengths and respective absorbing bonds (as overtones or combinations) explain the relationship between each PC and these variables.
NIRS predictions
It is noteworthy that after testing different scatter correction methods and mathematical treatments, the best calibrations (for MFD and SF) were obtained when neither a scatter correction nor any derivatives were applied to the spectra. Many reports have successfully used mathematical treatments with the first- or second-order derivative and a scatter correction method to reduce noise, to decrease the effects of particle size and to enhance useful spectral information. However, Shenk and Westerhaus (Reference Shenk and Westerhaus1994) suggest that the best mathematical treatment can only be attained by trial and error. In fact, the same authors maintain that the above corrections not always improve the accuracy of NIRS analysis, as particle size may provide useful information related to physical features for calibration.
Efficient NIR predictions can be obtained with RPD values of at least three, that is, when standard deviation of reference data at least triplicates the SEP (Williams, Reference Williams2001). Although the above stands for external validation, the same criterion has been assumed in several works to select the best model in cross-validation (Cozzolino and Murray, Reference Cozzolino and Murray2002; Cozzolino et al., Reference Cozzolino, Montossi and San Julian2005; Gishen and Cozzolino, Reference Gishen and Cozzolino2007; Alomar et al., Reference Alomar, Mera, Errandonea and Miranda2010). According to this relationship, the calibration models using the VIS–NIR or the NIR only regions to predict SDFD, CVFD, MFC, SDFC, CF and SL were very poor in their predictive quality with values of R 2CV < 0.65 and RPD <1.5. This was confirmed by obtaining low correlations between reference values and spectral data for the variables indicated above (r < 0.67, data not shown). Comparable results were reported in other study on alpaca (Gishen and Cozzolino, Reference Gishen and Cozzolino2007). Although the former statistics reveal an association between optical data and measured traits, this relationship does not show any prediction capacity.
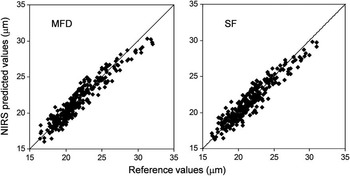
Models for MFD and SF, on the other hand, resulted in predictive quality rated as moderate to high according to their values of R 2CV (0.88 and 0.86, respectively) and RPD (2.91 and 2.66) in the VIS–NIR region and even better when models considered only the NIR region (R 2CV = 0.90 and 0.87; and RPD = 3.13 and 2.73, respectively) for the same variables. The high R 2CV values (⩾0.88) for the MFD reported in the present study reveal a strong relationship between spectral information and reference data. Besides, these equations were developed with few (6 to 8) outlier samples eliminated in the calibration procedure, which was restricted to two elimination passes. Therefore, these could be considered as good quantitative calibrations (Shenk and Westerhaus, Reference Shenk and Westerhaus1996) and, together with the low RMSECV values reported (<1.1 μm), we can affirm that the equations developed in the NIRS range could achieve the prediction of alpaca fibre diameter with acceptable accuracy and precision (Figure 3). Comparable results were reported by Coleman et al. (Reference Coleman, Lupton, Pfeiffer, Minikhiem and Hart1999) on Angora goat fleeces. These authors, using NIRS, found values of RMSECV = 1.13 μm, R 2CV = 0.79 and RPD = 3.31 for fibre diameter. Our results are encouraging as well, when compared with those reported by Cozzolino et al. (Reference Cozzolino, Montossi and San Julian2005), who obtained values of R 2 in calibration =0.35, RMSECV = 11 and RPD = 0.6 for fibre diameter in greasy wool samples from Merino sheep; and better than those of Gishen and Cozzolino (Reference Gishen and Cozzolino2007) who reported values of R 2CV = 0.88, RMSECV = 2.62 and RPD = 2 for fibre diameter of alpacas in the NIR region. The better predictive quality found in the present work could be explained in part by a larger sample size (291 v. 149), although a wider range (18.6 to 41.8 μm) in MFD was present in the calibration set of samples employed in the study of Gishen and Cozzolino. However, a high number of samples is not a warranty of success. In the work of Cozzolino et al. (Reference Cozzolino, Montossi and San Julian2005), high values of RMSECV were obtained for greasy wool, despite a considerably larger number of samples (n = 400). These differences could be attributed to the smaller variation in the data (e.g. 21.3 to 14.6 v. 34.2 to 16.4 μm for fibre diameter in the present work). On the other hand, for clean wool they obtained acceptable predictions, although only 50 samples, albeit with a wider range (19.3 to 29.6 μm) were employed. To obtain good predictions, that is, high correlations between reference and spectral data, and low standard errors of cross-validation, it is desirable to have a large set of calibration samples and a wide distribution of the variable under study (Murray, Reference Murray1986).
Reference and near-infrared reflectance spectra (NIRS) predicted values (μm) for mean fibre diameter (MFD) and spinning fineness (SF) of alpaca samples with best calibrations developed in the near-infrared (NIR) range.

In the external validation, MFD and SF were predicted on 91 samples with a calibration performed with 200 samples. Taking into account the control limits proposed by Shenk, et al. (Reference Shenk, Workman and Westerhaus2008) to monitor NIRS analysis, results are again encouraging (Table 4) as the SEP is near, but lower than 1.3 times the SEC and bias is lower than 0.6 times (in this case, better than −0.6 times) the SEC. Besides, slope is close to 1 and the coefficient of determination (R 2) is >0.8, which denotes a strong relationship between NIR and reference analysis.
As alpaca fibre diameter is one of the most important commercial attributes and its heritability is considered medium to high (Frank et al., Reference Frank, Hick, Gauna, Lamas, Renieri and Antonini2006), NIRS predictions of fibre diameter could be used as a valuable tool in breeding programs to improve fibre quality.
We conclude that reflectance spectroscopy in the NIR region can be used as a useful, fast, reliable and non-destructive tool to predict the average fibre diameter of Huacaya alpacas, at least for ranking purposes. Besides, this can be accomplished without any special preparation of the samples. Additional research is encouraged to enhance the calibration equations obtained in this study. Collaborative work with researchers and alpaca producers from different parts of the world could allow to enhance variability on different fibre traits and to establish large sample sets, which could contribute to develop more robust prediction models.
Acknowledgements
The authors express their appreciation to the staff of Estación Experimental INIA Quimsachata, Puno, Perú; and to the Centro de Investigación y Desarrollo de Camélidos Sudamericanos Lachocc, from the Universidad Nacional de Huancavelica, for supplying the samples used in this study. Financial support for sample analysis by the reference method, provided by the Graduate School of the Faculty of Agricultural Sciences, Universidad Austral de Chile, at Valdivia, is also gratefully acknowledged.