Overview
The first genome-wide association study (GWAS, ‘jē' wŏs’) of age-related macular degeneration appeared in 2005 (Klein et al. Reference Klein, Zeiss, Chew, Tsai, Sackler, Haynes, Henning, Sangiovanni, Mane, Mayne, Bracken, Ferris, Ott, Barnstable and Hoh2005). Since then, nearly 400 GWAS articles have been published in the National Human Genome Research Institute (NHGRI) GWAS Catalog (www.genome.gov/26525384, accessed 20 September 2009). The GWAS approach has been exceptionally successful in identifying common genetic variants that predispose to a variety of complex human diseases and biochemical and anthropometric traits and was named the ‘breakthrough’ of 2007 by the journal Science. Indeed, the GWAS method has performed beyond expectations.
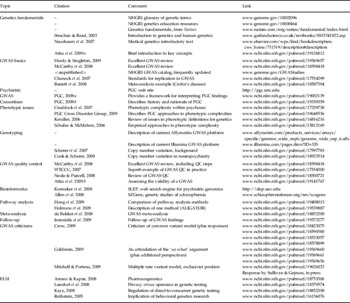
Although the GWAS approach is relatively new, many excellent reviews of various components of the GWAS method have already been published. Indeed, the GWAS review literature is of such singular quality that another review would be redundant. Therefore, instead of another review, our aim is to provide a primer, an annotated overview of the entire approach with particular reference to psychiatric genetics. Our aim is dissemination of information about this methodology in order for a motivated reader to become more expert. We dissect the GWAS methodology into its components and, for each component, provide a brief description and citations and links to reviews that cover the topic in detail (Table 1).
Further primer information by topic

GWAS, Genome-wide association study; ELSI, ethical, legal and social implications; PGC, Psychiatric GWAS Consortium; WTCCC, Wellcome Trust Case Control Consortium; NHGRI, National Human Genome Research Institute; QC, quality control.
An introduction to GWAS methodology
Basic principles in genetics
It is beyond the scope of this review to cover fundamental topics in genetics, but some useful starting points are shown in Table 1.
Definition
A GWAS for a disease is usually a variant of a cross-sectional case-control study, the study design that is the familiar workhorse in biomedicine and epidemiology (Schlesselman, Reference Schlesselman1982). Another term for GWAS is whole-genome association study (WGAS, ‘dŭb' əl-yōō găs’). Cases are defined as individuals who meet lifetime criteria for a disease, for example Crohn's disease, type 2 diabetes mellitus (T2DM), or schizophrenia. Controls should have never met criteria for the disease and, ideally, be through the period of risk. Moreover, for case-control comparisons to be as unbiased as possible, controls should be drawn from the same population as cases, particularly with respect to exposure to any potentially relevant risk factors (Rothman, Reference Rothman1986). Each individual in the sample is assayed (i.e. genotyped) for a comprehensive set of genetic markers scattered across the genome. The genetic markers are single nucleotide polymorphisms (SNPs, ‘snips’), which are relatively straightforward to assay. The two major current GWAS technological platforms contain 906000 (Affymetrix 6.0) and 1199187 SNPs (Illumina 1M) spaced across the 22 autosomes (chr1–chr22), the sex chromosomes (chrX and chrY) and the mitochondrial genome (chrM).
The key analysis in a GWAS for a disease is logistic regression with the dependent variable case-control status (1=case, 0=control) and a SNP genotype as an independent variable [coded as the number of copies of the minor or less frequent allele, 1 degree of freedom (df)]. The output of a logistic regression is identity of the reference allele and an odds ratio with its standard error (or confidence intervals) along with a statistic and a p value that tests whether the odds ratio differs from unity.
Standard of evidence
In a GWAS, logistic regressions are done for every SNP (i.e. a total of ~1 million regression models). Given the number of statistical tests, p values that are very small by traditional standards are to be expected merely by the play of chance (e.g. 10 p values <0.00001 and 100 p values <0.0001). Thus, the standard of evidence that has emerged for a compelling GWAS finding is rigorous: (a) a strong association in an initial sample, (b) precise replication in one or more independent samples (i.e. the same SNP, allele, and direction of association), and (c) a cumulative p value <5×10⁻⁸ (Chanock et al. Reference Chanock, Manolio, Boehnke, Boerwinkle, Hunter, Thomas, Hirschhorn, Abecasis, Altshuler, Bailey-Wilson, Brooks, Cardon, Daly, Donnelly, Fraumeni, Freimer, Gerhard, Gunter, Guttmacher, Guyer, Harris, Hoh, Hoover, Kong, Merikangas, Morton, Palmer, Phimister, Rice, Roberts, Rotimi, Tucker, Vogan, Wacholder, Wijsman, Winn and Collins2007). The 5×10⁻⁸ threshold is akin to a Bonferroni correction of the traditional 0.05 Type 1 error level for 1 000 000 statistical tests (although the full argument is more complex as some of these tests are not independent because of linkage disequilibrium) (Pe'er et al. Reference Pe'er, Yelensky, Altshuler and Daly2008). p values that are smaller than expected by chance and that replicate well in other samples highlight a genomic region associated with a disorder (and potentially causal).
Statistical power
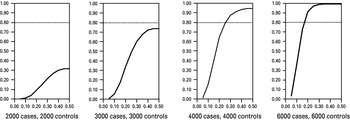
Because of the requirement to adjust for the large number of statistical tests to control Type 1 error, adequate statistical power (to minimize Type 2 error) is crucial, particularly given the small genetic effect sizes typical for human GWAS findings (discussed later). Fig. 1 shows power curves for four different sample sizes. Given the large number of statistical tests and because the genetic effects are likely to be subtle, power is inadequate unless very large numbers of cases and controls are studied.
Statistical power in a genome-wide association study (GWAS) for four different sample sizes assuming a discrete trait with lifetime prevalence of 0.01 (similar to schizophrenia, bipolar disorder or anorexia nervosa), a log additive genetic model, and a genotypic relative risk of 1.25 (typical for GWAS for human complex diseases), and two-tailed α=5×10⁻⁸. The x axis shows minor allele frequency and the y axis statistical power.

GWAS statistics
We illustrate here some properties of published GWAS in biomedicine from the NHGRI GWAS Catalog (accessed 20 September 2009). Of 396 published GWAS, there were 238 studies reporting 693 SNP associations with p<5×10⁻⁸. These associations were for 59 human diseases and 61 other quantitative traits. The diseases with the greatest number of associations were Crohn's disease, T1DM, T2DM, prostate cancer, and rheumatoid arthritis. The top quantitative traits were height, lipid levels [triglycerides, high density lipoprotein (HDL) and low density lipoprotein (LDL) cholesterol], QT interval, and body mass index.
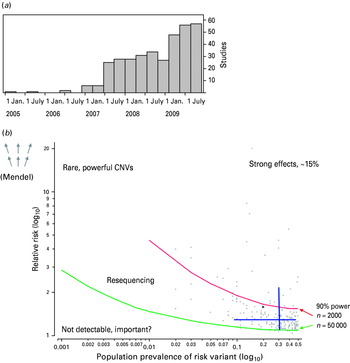
Fig. 2 a shows the temporal trends in the publication dates for these studies. Fig. 2 b illustrates some of the properties of the findings from the literature. Note that only about 15% of the SNP–disease associations are detectible with 90% power, with a sample of 1000 cases and 1000 controls, whereas only about 4% would not be detected with 25 000 cases and 25 000 controls (the estimated number of GWAS samples available for schizophrenia and bipolar disorder by 2014). This is an important point: based on power calculations and empirical findings for other disorders, ‘failure’ to detect an association is meaningful only if the sample size is very large.
Properties of genome-wide association study (GWAS) findings from the literature. (a) Quarterly temporal trends in the publication of GWAS. (b) The accumulated GWAS literature on human diseases. The x axis is the population prevalence of a risk variant and the y axis the relative risk conferred (both using a log10 scale to provide separation). The gray points show the prevalence–risk combination for all single nucleotide polymorphism (SNP) associations for human complex diseases with p<5×10⁻⁸. Power curves are shown for 1000 cases/1000 controls (red line) and 25 000 cases/25 000 controls (green line). The blue lines depict the 10th–90th percentiles from the GWAS literature for allele frequency (horizontal line) and relative risk (vertical line). The intersection of the blue lines is the median population prevalence (0.3) and relative risk (1.25).

Several intriguing trends were evident in these data on human diseases. First, with few exceptions [e.g. Alzheimer's disease and the apolipoprotein E gene (APOE)], the regions implicated by GWAS were not previously known. Candidate genes based on prior knowledge of pathophysiology or intuition have usually not been identified. Second, the majority of these findings (90%) were not in the coding region of a gene, and only 8% were non-synonymous variants (i.e. DNA variants that change the amino acid sequence of the corresponding protein). Indeed, 43% were not in a known gene and 23% were not within 20 000 bases of a known gene. Common variation underlying complex human diseases is dissimilar to that underlying Mendelian diseases where major changes to proteins are typical.
Meta-analysis
Given the requirement for historically large sample sizes, it has become typical for primary studies to band together to form meta-analytic consortia. This has proven to be a crucial step in achieving sufficient statistical power. For example, two primary T2DM GWAS were unremarkable individually and yet, after meta-analysis, multiple highly significant and replicated findings emerged (Saxena et al. Reference Saxena, Voight, Lyssenko, Burtt, de Bakker, Chen, Roix, Kathiresan, Hirschhorn, Daly, Hughes, Groop, Altshuler, Almgren, Florez, Meyer, Ardlie, Bengtsson, Isomaa, Lettre, Lindblad, Lyon, Melander, Newton-Cheh, Nilsson, Orho-Melander, Rastam, Speliotes, Taskinen, Tuomi, Guiducci, Berglund, Carlson, Gianniny, Hackett, Hall, Holmkvist, Laurila, Sjogren, Sterner, Surti, Svensson, Tewhey, Blumenstiel, Parkin, Defelice, Barry, Brodeur, Camarata, Chia, Fava, Gibbons, Handsaker, Healy, Nguyen, Gates, Sougnez, Gage, Nizzari, Gabriel, Chirn, Ma, Parikh, Richardson, Ricke and Purcell2007; Scott et al. Reference Scott, Mohlke, Bonnycastle, Willer, Li, Duren, Erdos, Stringham, Chines, Jackson, Prokunina-Olsson, Ding, Swift, Narisu, Hu, Pruim, Xiao, Li, Conneely, Riebow, Sprau, Tong, White, Hetrick, Barnhart, Bark, Goldstein, Watkins, Xiang, Saramies, Buchanan, Watanabe, Valle, Kinnunen, Abecasis, Pugh, Doheny, Bergman, Tuomilehto, Collins and Boehnke2007).
GWAS for psychiatric disorders
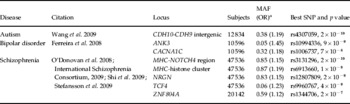
Multiple GWAS for psychiatric disorders have been published, are in progress, or are planned. The disorders include anorexia nervosa, attention deficit hyperactivity disorder (ADHD), autism, bipolar disorder, drug use disorders (smoking behavior and alcohol dependence), major depressive disorder, obsessive–compulsive disorder, and schizophrenia. There are more than 50 primary samples, mostly in subjects of European ancestry but with increasing numbers of subjects of African and East Asian ancestry. Prominent examples of GWAS findings for psychiatric disorders are described in Table 2. This area is expanding rapidly, and additional findings are known to be in the publication pipeline.
Notable psychiatric GWAS findings (as of September 2009)

a Illustrative minor allele frequency (MAF) in controls and odds ratio (OR).
The Psychiatric GWAS Consortium (PGC) was formed in 2007 to conduct a ‘mega-analysis’ of individual genotype and phenotype data, and is described in detail elsewhere (Cross-Disorder Phenotype Group of the Psychiatric GWAS Consortium, 2009; Psychiatric GWAS Consortium, 2009a, b). GWAS data for ADHD, autism, bipolar disorder, major depressive disorder and schizophrenia from European subjects are being analyzed as of this writing in September 2009. To our knowledge, this study of >59 000 independent cases and controls and >7700 family trios will be the largest biological experiment conducted in psychiatry.
The PGC has two major aims. The first is to conduct five separate GWAS mega-analyses for ADHD, autism, bipolar disorder, major depressive disorder, and schizophrenia. The second comprises cross-disorder mega-analyses with two components. The ‘nosological’ subaim takes cases as defined by DSM-IV criteria and looks for SNPs that are compellingly associated with two or more disorders and effectively searches for genomic regions with pleomorphic effects. The ‘heterogeneity’ subaim reclassifies subjects according to prespecified phenotypic characteristics (e.g. subjects with bipolar disorder with two manic episodes and many depressive episodes should be more major depression-like than bipolar-like). This is a convenient segue to the next issue: are psychiatric phenotypes qualitatively different from other biomedical diseases?
Genetic models
One of the major unknowns for psychiatric disorders is the nature of the genetic models by which variation at the DNA level increases risk for the clinical phenotype. For Mendelian disorders, a genetic model can be hypothesized by examination of pedigrees (e.g. dominant, recessive or sex-linked) and knowledge of prevalence. For psychiatric diseases, we assume complex inheritance (allowing for mixtures of genetic and environmental effects along with diagnostic imprecision). Two genetic models have received particular attention: that complex traits are caused by common versus rare genetic variation. In the former, psychiatric disease results from the cumulative effect of many genetic variants, each of which is common in the population and confers subtle genetic risk [the common disease/common variant model (CDCV)]. In the latter, psychiatric disease results from many different mutations, each of which is rare but of powerful effect [the multiple rare variant model (MRV)].
Some commentators hold extremist views, for example that psychiatric diseases arise only from an MRV model (see the Controversies section below). However, empirical results to date are consistent with a place for both MRV and CDCV models. For schizophrenia, bipolar disorder and autism, the data are consistent with the presence of multiple common variants of subtle effect in some patients and rare variants in others. More examples are likely to emerge with improved technologies and larger sample sizes.
One fascinating empirical development has been the emergence of the ‘profile score’ concept, an extreme form of the CDCV model. In a recent Nature paper (International Schizophrenia Consortium, 2009), the authors developed a list of approximately 30 000 SNPs and their risk alleles in one large schizophrenia case-control sample. This list can be used to compute a risk profile for each person in independent samples (i.e. the number of schizophrenia risk alleles). The score from the initial sample significantly predicted schizophrenia risk in three independent samples (p values 2×10⁻²⁸, 5×10⁻¹¹, and 0.008), bipolar risk in two independent samples (p values 1×10⁻¹² and 9×10⁻⁹), and, importantly, was not associated with risk of six non-psychiatric biomedical disorders (Crohn's disease, T1DM, T2DM, coronary artery disease, hypertension and rheumatoid arthritis). These data strongly support the CDCV model and also suggest genetic overlap between schizophrenia and bipolar disorder.
From these basic models, multiple elaborations are possible. For example, different genetic variants in the same gene could be associated with a disease in different populations.
As an example of MRV, copy number variation (CNV) has emerged as a rare but powerful risk factor for neuropsychiatric disorders. CNVs are segments of the genome >1000 bases where the number of copies of this segment is different from the expected number. Down's syndrome is an example where three copies (instead of two) of chr21 are present. The chr22q11 hemi-deletion (one copy of chr22 from 17.3–20.3 million bases) is another example, and has been associated with multiple neuropsychiatric disorders. GWAS chips also contain many CNV probes, leading to increasing interest in this topic.
The phenotype
The most important issue in a case-control study is how to define cases and controls, and this is particularly so in psychiatric genetics. This is more difficult to define and measure than for most non-psychiatric disorders. Furthermore, we have less knowledge of the causes and mechanisms of pathogenesis. Our current official classification systems, DSM and ICD, are descriptive systems that were developed to have clinical utility and acceptable reliability, but with no expectation that the categories represented valid entities with respect to etiology. Although these phenotype definitions are moderately to highly heritable and hence sensible starting points for genetic research, it is generally agreed that the most useful biological categories and/or dimensional definitions and measures are still unknown. The strikingly high level of co-occurrence of different diagnoses within the same individual (‘co-morbidity’) almost certainly reflects a substantial overlap in the underlying biology of currently defined syndromes. This is further evidenced by family studies demonstrating shared familial liability across diagnostic boundaries (e.g. schizophrenia and bipolar disorder) (Lichtenstein et al. Reference Lichtenstein, Yip, Bjork, Pawitan, Cannon, Sullivan and Hultman2009). It is interesting to note that some of the strongest association signals to emerge from GWAS of schizophrenia and bipolar disorder show an overlap across traditional disorder categories (International Schizophrenia Consortium, 2009).
In view of these observations, it can be expected that a range of approaches to the clinical phenotype may be required to maximize the potential from molecular genetic studies. This includes analyses across the traditional illness categories (‘lumping’) and analyses of clinically meaningful subsets within a category or set of categories (‘splitting’). It is also possible to use approaches that are not based on any specific prior model of the clinical phenotype and to seek clinical entities (whether they are categories or dimensions) that would ‘make more sense’ from a genetic perspective. For example, for a highly significant and consistently replicated genetic association, cases with and without the genetic variant can be investigated in an to attempt to identify the phenotypic consequences of the variant: do cases with the variant have earlier onset, more severe symptoms, worse response to treatment, or alter brain structure or function? This is also know as ‘reverse phenotyping’ or ‘phenotype refinement’. Another analytic possibility, which will be particularly valuable if there is a high degree of polygenicity (i.e. hundreds or thousands of susceptibility alleles of small effect), will be to consider a large set of polymorphisms and use aggregate measures of their overall contribution to phenotypic susceptibility to seek to define ‘signatures’ of genetic variants, the patterns of which could be compared across phenotypes.
Molecular genetics will certainly not provide a simple, gene-based classification of psychiatric illness. However, it can be expected that establishing the relationship between genotypes and psychiatric phenotypes will inform understanding of psychiatric nosology and move psychiatry towards a diagnostic classification that is much closer to the underlying pathophysiology than are the current descriptive classifications. This may well be a relatively early and clinically important ‘pay-off’ from the major research investment in molecular genetic research in psychiatry.
GWAS genotyping
Source of DNA
DNA samples are readily obtainable from multiple sites although most studies use peripheral blood lymphocytes from venous samples. Some studies use samples from the oral cavity (buccal scrapings or epithelial cells in saliva) but these samples can be plagued by smaller DNA quantity, inferior DNA quality, and interference of DNA from oral microbial flora. Some samples are derived from lymphocytes transformed by Epstein–Barr virus into immortalized cell lines but such samples can have artifacts that complicate some analyses (e.g. trisomy 12 in copy number analyses). Although some investigators advocate using DNA pooling due to lower cost (i.e. genotyping aggregated cases and aggregated controls), this approach can have serious issues with accuracy and reliability and has not entered wide usage.
Genotyping
The cost of genotyping has decreased by a factor of 2000 in the past decade with the development of reliable, robust and highly multiplexed genotyping systems (meaning that many genetic markers are genotyped simultaneously) and because of competition between multiple companies. As of this writing in mid-2009, Affymetrix and Illumina are the main suppliers of GWAS genotyping platforms. Each uses different technologies and each has advantages and disadvantages in regard to genotyping accuracy, genomic coverage, ease of use, and total cost. Both platforms genotype a predefined set of SNPs, an important reason why cost has decreased. SNPs are genotyped as they are relatively common in the human genome and relatively straightforward to assay.
For each platform, genotyping takes 3 or 4 days per sample, and most laboratories run tens or even hundreds of samples simultaneously. Such high throughput means that even large-scale projects can be completed in under a year. In practice, there are always numerous issues to resolve, such as subjects whose stated sex does not match patterns of chrX and chrY SNPs or samples that are unexpectedly identical.
Genotype calling
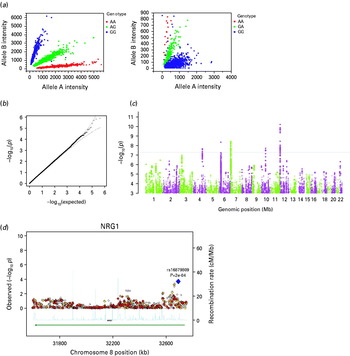
For each SNP, GWAS platforms assess each of the two possible alleles with independent assays that can be viewed as a scatter plot. Fig. 3 a depicts a scatter plots for two SNPs in a GWAS. The scatter plots show the intensity values for one SNP allele plotted by the intensity values for the other SNP allele with each point corresponding to one subject. In the scatter plot on the left of Fig. 3 a, the points fall into three well-defined clusters, and individuals in each cluster are ‘called’ as having the same genotype for that SNP (i.e. GG, AG or AA). A genotype calling algorithm is used to assign these clusters into genotypes for each subject. The scatter plot on the right shows an example of poor cluster separation, and this SNP should be excluded from analysis.
Images important for assessing a genome-wide association study (GWAS). These figures are from different studies. (a) The allele intensity plots for two single nucleotide polymorphisms (SNPs) from which SNP genotype calls are generated. (b) A quantile–quantile plot in which the observed p values are plotted against the p value distribution expected by chance (on −log10 scale). (c) A Manhattan plot. (d) An expanded set of findings in the region of neuregulin 1 (NRG1). See text for more detailed description.

GWAS analysis
Quality control (QC)
One of the most important and time-consuming steps in conducting a GWAS is QC, the removal of SNPs and subjects with unreliable data plus assessment of biases that might lead to spurious results. Excellent reviews of GWAS QC are available (McCarthy et al. Reference McCarthy, Abecasis, Cardon, Goldstein, Little, Ioannidis and Hirschhorn2008; Neale & Purcell, Reference Neale and Purcell2008; Attia et al. Reference Attia, Ioannidis, Thakkinstian, McEvoy, Scott, Minelli, Thompson, Infante-Rivard and Guyatt2009b).
Individual SNPs are removed for any of the following reasons:
• Imprecise mapping to the genome (some SNPs map to multiple places).
• Excessive disagreement among duplicated samples.
• Excessive missing genotypes on subjects (e.g. >5%).
• Low minor allele frequency (e.g. <1%).
• Observed genotype frequencies deviate markedly from expectations (e.g. Hardy–Weinberg equilibrium p<1×10⁻⁶).
After SNP removal, subjects are dropped for any of the following:
• Disagreement between chrX/chrY genotypes and phenotypic sex (usually indicating an unreliable link between genotype and phenotype data).
• Excessive missing data (e.g. >5%).
• Inadvertent sample duplication or close relation (monozygotic twin or first- or second-degree relative) to some other subject.
• Ancestry outlier.
Bias
As there are hundreds of thousands of SNPs per subject, relatives are readily identified and excluded as their presence can lead to inflation of Type 1 error. Similarly, genome-wide data allow identification and control for the most infamous bias of a case-control study, inflation of Type 1 error due to population stratification. This occurs when cases and controls are mismatched by ancestry and disease prevalence differs by ancestry, and has been responsible for numerous false-positive findings in the literature. With genome-wide SNP data, it is possible to identify individuals with divergent ancestry (even within a continental population); these individuals can be excluded or a statistical method used to control for this bias.
In addition, important bias can be introduced if samples from cases and controls are handled differently; for example if samples from cases are older, if DNA has been extracted with a different method from controls, or if cases are genotyped at a different place and time from controls. Careful assessment of these and other sources of bias is crucial to understanding the impact of a range of method artifacts.
Statistical testing
Using the SNPs and subjects that passed QC, investigators generally use logistic regression with case-control status as the dependent variable and a single SNP as the predictor. The SNP is coded as 0, 1 or 2 (i.e. the number of copies of one of the two alleles) for an additive test with 1 df. This analysis is repeated for each SNP for a million or more statistical tests. Some investigators include covariates in the logistic regression model such as age, sex or indicators of ancestry. In some instances, alternative genetic models are used (e.g. recessive or dominant) but most studies use a 1 df additive test as the primary statistical test.
Multiple testing
A typical GWAS for one disease includes one logistic regression per SNP, or at least 500 000 statistical tests. These tests are not all independent as SNPs that are located close to one another can be correlated because of linkage disequilibrium. Even so, with 105–106 statistical tests, very small p values by conventional standards are expected by chance. As noted earlier, p values <5×10⁻⁸ (akin to a Bonferroni correction of the traditional 0.05 Type 1 error level for 1 000 000 statistical tests) (Pe'er et al. Reference Pe'er, Yelensky, Altshuler and Daly2008) are generally required for significance. Experience suggests that findings more significant than this threshold tend to replicate well across studies. However, unless power is exceptional, it is generally incorrect to exclude a SNP from consideration if does not exceed this threshold. Indeed, some SNPs that are unimpressive in an initial study (e.g. p=0.001) can eventually replicate well and exceed the critical threshold. As emphasized above, replication is essential.
Visualization
The scale of a GWAS can be overwhelming, and many find it helpful to use graphics to depict certain results. Fig. 3 b shows a quantile–quantile plot, a scatter plot of the p values observed in a GWAS versus that expected by chance. To spread the graph out, the points are transformed using −log10(p value) (e.g. 0.0001 or 10−4 becomes +4.0). In this instance, the plot shows that the observed p values conform closely to the expected, suggesting that no finding is individually impressive after accounting for multiple comparisons. Fig. 3 c shows a ‘Manhattan plot’ (to some eyes, this resembles the night skyline of the Manhattan borough of New York City viewed from across the Hudson River), a depiction of all small p values by genomic position. These results (from a different study than in Fig. 3 b) suggest that genomic regions on chromosomes 4, 6, 7, 10 and 12 exceed genome-wide significance. Fig. 3 d (again from a different study) shows an expanded view of a genomic region of interest [neuregulin 1 (NRG1)]. The region of maximum signal on the right-hand side of the graph is quite far from the region suggested as a risk factor for schizophrenia (on the far left-hand side of the figure).
Imputation
Samples from the HapMap project have been genotyped for a very large number of SNPs. Under the assumption that these samples (e.g. the northern European subset) are comparable to members of a case-control collection, the combination of these datasets can be used to estimate (impute) genotypes in the case-control collection by treating it as a missing data problem. Thus, it is possible to increase the number of available genotypes from, for example, 500 000 directly assessed SNPs to 2 million directly genotyped and imputed SNPs. A major use of imputation is to allow direct comparison of case-control studies that were genotyped using different GWAS platforms. For many of the Affymetrix and Illumina platforms, the number of SNPs directly genotyped on both platforms is <20%. Imputation is often an essential precursor for meta-analysis.
Bioinformatics
Two web resources for investigating psychiatric genetics findings are shown in Table 1 (Allen et al. Reference Allen, Bagade, McQueen, Ioannidis, Kavvoura, Khoury, Tanzi and Bertram2008; Konneker et al. Reference Konneker, Barnes, Furberg, Losh, Bulik and Sullivan2008). GWAS analyses described above take an agnostic approach to GWAS data. Experience gleaned from other diseases indicates that SNPs identified and confirmed by replication are not necessarily those with the smallest p values in an initial study. Bioinformatics approaches can be useful in annotating and organizing GWAS SNP data to identify SNPs for replication. SNPs may be prioritized based on many additional types of information: previous genetic association data; by location in exons, putative functional regions of the genome, or in brain-expressed genes; or on the basis that the identified SNP allele has an effect on gene expression in brain (Xu & Taylor, Reference Xu and Taylor2009).
Pathway analysis
Pathway analysis represents an alternative analytical approach to interrogating GWAS data. Several formal pathway-based analytical methods have been described (Hong et al. Reference Hong, Pawitan, Magnusson and Prince2009). Essentially, these methods attempt to establish whether SNPs mapping to genes in a pathway show more evidence of association with a disorder than other SNPs in the GWAS, or SNPs mapping to other pathways. Pathway refers to groups of genes that are similar in some way, for example highly expressed in a tissue such as prefrontal cortex, or crucial to a biological process such as neuronal differentiation. The approach can be applied to test for involvement of specific pathways, to perform a hypothesis-free test of many different pathways, or to investigate whether pre-identified risk genes may be involved in the same molecular pathway or process. Investigating at the level of molecular pathways rather than individual risk variants may offer several potential advantages by being robust to the effects of genetic heterogeneity or in reducing the total multiple testing burden in analysis. However, this approach is dependent on the quality of annotation of the pathways being investigated (which can be uncertain) and assumes that risk variation falls within genes. As mentioned in our description of GWAS for human diseases, a large subset of identified genetic risk variation (43%) fell outside gene boundaries. Arguably the principal advantage of this approach is to establish additional information relating to function over and above the statistical SNP GWAS data. Implicating a molecular pathway in a disease process is likely to be more biologically informative than interpreting evidence of involvement of an anonymous genetic marker.
Meta-analysis
Conducting a meta-analysis, the combined analysis of summary results from multiple primary studies, is now known to be crucial in the identification of robust genetic signals. This general principle has been identified on multiple occasions, as evidenced by studies of Crohn's disease, T1DM and T2DM (Barrett et al. Reference Barrett, Hansoul, Nicolae, Cho, Duerr, Rioux, Brant, Silverberg, Taylor, Barmada, Bitton, Dassopoulos, Datta, Green, Griffiths, Kistner, Murtha, Regueiro, Rotter, Schumm, Steinhart, Targan, Xavier, Libioulle, Sandor, Lathrop, Belaiche, Dewit, Gut, Heath, Laukens, Mni, Rutgeerts, Van Gossum, Zelenika, Franchimont, Hugot, de Vos, Vermeire, Louis, Cardon, Anderson, Drummond, Nimmo, Ahmad, Prescott, Onnie, Fisher, Marchini, Ghori, Bumpstead, Gwilliam, Tremelling, Deloukas, Mansfield, Jewell, Satsangi, Mathew, Parkes, Georges and Daly2008, Reference Barrett, Clayton, Concannon, Akolkar, Cooper, Erlich, Julier, Morahan, Nerup, Nierras, Plagnol, Pociot, Schuilenburg, Smyth, Stevens, Todd, Walker and Rich2009; Zeggini et al. Reference Zeggini, Scott, Saxena, Voight, Marchini, Hu, de Bakker, Abecasis, Almgren, Andersen, Ardlie, Bostrom, Bergman, Bonnycastle, Borch-Johnsen, Burtt, Chen, Chines, Daly, Deodhar, Ding, Doney, Duren, Elliott, Erdos, Frayling, Freathy, Gianniny, Grallert, Grarup, Groves, Guiducci, Hansen, Herder, Hitman, Hughes, Isomaa, Jackson, Jorgensen, Kong, Kubalanza, Kuruvilla, Kuusisto, Langenberg, Lango, Lauritzen, Li, Lindgren, Lyssenko, Marvelle, Meisinger, Midthjell, Mohlke, Morken, Morris, Narisu, Nilsson, Owen, Palmer, Payne, Perry, Pettersen, Platou, Prokopenko, Qi, Qin, Rayner, Rees, Roix, Sandbaek, Shields, Sjogren, Steinthorsdottir, Stringham, Swift, Thorleifsson, Thorsteinsdottir, Timpson, Tuomi, Tuomilehto, Walker, Watanabe, Weedon, Willer, Illig, Hveem, Hu, Laakso, Stefansson, Pedersen, Wareham, Barroso, Hattersley, Collins, Groop, McCarthy, Boehnke and Altshuler2008). As discussed earlier, the PGC is conducting such analyses for psychiatric disorders.
However, a high-quality meta-analysis must confront and surmount numerous conceptual and technical issues. These issues include: the comparability of samples and phenotype definitions; quality control; imputation to a common genotype set with attention to strand and allele issues; statistical methods to combine data; visualization; bioinformatics; and follow-up strategies. de Bakker et al. (Reference de Bakker, Ferreira, Jia, Neale, Raychaudhuri and Voight2008) provide a practical treatment of these issues.
Follow-up strategies
Assuming that a GWAS identifies a highly reproducible and consistently replicated association with a genomic region: what next? The implications are discussed in the next section (ELSI) and additional follow-up experiments are described here (Ioannidis et al. Reference Ioannidis, Thomas and Daly2009). The fundamental idea is to design experiments to develop a detailed understanding of how changes at the genetic level act and interact with the environment to alter risk of a psychiatric disorder. These experiments should be at multiple levels: DNA, RNA, protein, biological process, cell, local cell systems, organ, organ system, organism, and community levels are all potentially relevant.
These associations could be direct (i.e. the identified variant is the causal variant) but are more likely to be associated indirectly in that the identified variant is correlated with some other genomic variant. For indirect association, the causal variant could be some other SNP, a set of interacting SNPs, a haplotype, an insertion/deletion polymorphism, a CNV, or a more complex type of genetic variant. It is also wise to leave open the possibility of a causal genetic mechanism that is currently unknown. The genetic effects are highly likely to be subtle and probabilistic (and even conditionally dependent on external influences) rather than deterministic as with classical Mendelian disorders.
DNA
Broadly, genetic follow-up aims to validate and refine notable SNP associations to identify underlying causal variants and map their relationship to clinical phenotypes. One approach, beyond simple replication, is to investigate an implicated genomic region at higher marker density to refine the association signal (fine-mapping). For other complex diseases this approach has met with mixed results, suggesting that in many cases the impact of risk variants on common disease phenotypes is complex and not necessarily related to obvious effects on gene function, such as alteration of protein structure. This may relate to the limited coverage achieved by these studies, but it has been estimated that by direct genotyping and imputation a large percentage (>85%) of common SNP variation is already being assayed by GWAS, although this can vary markedly by genomic region.
Many investigators would conduct regional ‘deep’ resequencing of large numbers of cases and controls to discover previously unknown genetic variants. The emerging technology of genome resequencing has shown that there is usually an array of undiscovered genetic variants. A more detailed understanding of genetic variation in human populations will soon be available through the 1000 Genomes Project (www.1000genomes.org), which is performing genomic resequencing of >1000 people from around the world. This is likely to prove very informative in guiding fine-mapping studies and potentially untangling more complex effects on phenotype.
Alternative genetic mechanisms may also contribute to disease, and disruption of the same genes or molecular pathways by different mechanisms is likely to be relevant to the consequent phenotype. Follow-up strategies are increasingly using GWAS results to test other genetic risk mechanisms such as involvement of CNV, the cumulative impact of CNV burden (e.g. the number of CNVs), and the cumulative impact of hundreds or thousands of SNP genotypes. In addition, investigators are actively working to assess the cumulative impact of individually rare risk alleles and epigenetic phenomena such as methylation.
RNA
A potentially useful gene annotation is whether a genetic variant leads to changes in RNA abundance or structure. This so-called quantitative trait loci (QTL) approach is in its early stages, but refinement and larger studies could give investigators a useful set of initial hypotheses should an associated region be shown to alter messenger RNA for a nearby gene. These data can also be used to answer the question: to what gene does an associated SNP ‘belong’? Investigators usually assume that a SNP exerts its immediate effect on a gene it is in or near. In general, this assumption may be reasonable, but there are examples where this assumption is incorrect (e.g. lactase persistence is due to MCM6 intronic variation, ~14 kb from the lactase gene). Moreover, 23% of GWAS hits are >20 kb from known genes. Fascinating examples include the 8q24 ‘gene desert’ (30–500 kb from MYC) that is robustly associated with multiple different cancers and a 5p14 region with replicated associations with autism but ~1 Mb from the nearest gene.
Molecular and cellular biology
There are many powerful technologies that could be brought to bear. These approaches are too numerous to describe succinctly and their choice depends on the details of a genomic variant. In many instances, use of transgenic manipulation (knock-out or humanizing knock-in approaches) of non-human model organisms (mouse or worm in particular) might be used to gain greater understanding of the impact of a genomic variant.
Clinical
Risk variants identified by GWAS are individually likely to be of modest effect, which poses challenges for clinical follow-up studies. These are not insurmountable, but are at present dependent on the availability of detailed phenotypic information from subjects involved in GWAS or the ability to recontact subjects for additional studies. Recent efforts in schizophrenia demonstrate the application of a phenotype refinement approach, in this case identifying a disturbed neural connectivity phenotype in carriers of the risk allele at ZNF804A using a neuroimaging approach (Esslinger et al. Reference Esslinger, Walter, Kirsch, Erk, Schnell, Arnold, Haddad, Mier, Opitz von Boberfeld, Raab, Witt, Rietschel, Cichon and Meyer-Lindenberg2009). If disorders are highly polygenic it might be possible to group participants into classes based on total burden of risk variation or contribution from different functional pathways. Such groupings could than be used within a disorder, or across current diagnostic boundaries, to investigate clinical profiles, cognitive functioning, drug response or clinical outcome. By extension, such approaches could also be applied to investigate gene–environment interaction in risk. The optimum approach would be integration of genetic and epidemiological research to investigate, prospectively, the effects of risk genes and gene–environment interaction in prospective studies or within high-risk groups.
Controversies
GWAS efforts have been subject to multiple criticisms, both for the method generally and with respect to psychiatric disorders. Criticism has been welcomed, particularly when it is based on empirical data and not opinion. One initial criticism – that GWAS will not work in the sense of identifying any replicable associations – has been robustly disproved, as GWAS clearly ‘works’ for a broad range of biomedical disorders. The crucial question for our field is whether GWAS will ‘work’ for psychiatric disorders (as discussed above, there is positive evidence that it has). Common criticisms of GWAS are listed below. All have been articulated at length and strong counter-arguments are available (see Table 1 for citations).
• Phenotype criticisms: the clinically derived DSM and ICD systems are merely descriptive. The disorders are too heterogeneous and imprecisely defined; that is investigating ‘schizophrenia’ is like studying ‘cancer’ or ‘fever’.
• Genetic model criticisms. The vast majority of GWAS use perhaps the simplest conceivable model, a test for the additive effect of a single, relatively common SNP variant on the phenotype. Some have argued that this model is completely wrong, that risk for psychiatric disease is entirely something else, that is risk is entirely due to rare variants, epigenetic modifications, etc.
• The ‘so what’ criticism. Some have argued that robust GWAS findings cannot contribute to individualized medicine and thus do not matter.
• An empirically based criticism of GWAS is that the current genotyping technologies miss potentially important genetic variation (e.g. a subset of common variants, a large proportion of rare variants, non-SNP genetic variants such as insertion–deletion polymorphisms, and are not optimal for CNV detection).
Ethical, legal and social implications (ELSI)
Major scientific advances in the molecular genetic understanding of psychiatric illness are associated with important ethical issues that must be considered carefully. Although many issues in psychiatric genetics are no different from those for other complex disorders, this combination of genetics and mental illness justifiably receives close scrutiny of ethical and psychosocial issues. It is well known that behavior genetics research has been misused in the past, most notoriously to support Nazi claims of racial superiority, which had an important role in the Holocaust. It is therefore extremely important that relevant issues are considered and debated as early as possible and, where appropriate, ethical guidance and legal frameworks put in place to protect individuals and society against potential misuse of the new technologies and data. In recognition of its major importance, ELSI was an integral component of the Human Genome Project from its inception.
Key ethical issues under current debate include the need for new approaches to informed consent for large-scale genetic studies and consideration of the legal issues relating to confidentiality and use of genetic data. For example, under what circumstances (if any) might it be useful or appropriate to use genetic data in a court case to support an argument about responsibility for a behavior? Should insurance companies or employers have access to genetic data that inform risk of mental illness? How can we prevent genetic results being used to reify racist, sexist or other stigmatizing biases? Quite apart from these potential non-medical uses of genetic data, there is the important question of whether and when genetic tests may be useful clinically: to help in confirming diagnosis; to direct management in a patient with signs of illness; or to predict risk in a person without signs of illness. At present, risk variants have not been robustly established that would provide clinically useful individual predictive power and it may well be many years in the future before this is possible. Nonetheless, we need to think through the issues in advance of the scientific and technical reality. It is highly desirable that the clinical usefulness of any genetic test is demonstrated before it is made widely available. ‘Direct to consumer’ genetic tests of spurious clinical usefulness are already available commercially so there is an urgent need to develop frameworks and guidelines for best practice.
In addition to the continuing public debate, consultation and education on these issues, there is a need for scrupulous integrity by scientists in the way they present research findings. Reports should be appropriately cautious, balanced and free from ‘hype’, ‘spin’ or commercial bias.
The exciting challenge for psychiatry in the coming years is to ensure that a revolution in understanding of the biology of mental illness is translated into a revolution in clinical care. The important challenge for society is to ensure that new knowledge and powerful technologies are not misused.
Acknowledgments
Funding was from the US National Institute of Mental Health (MH085520, MH080403, MH077139, MH081802 and MH074027).
Declaration of Interest
Dr Sullivan reports receiving unrestricted research funding from Eli Lilly for genetic research on schizophrenia.