Introduction
Why are some non-democratic regimes governed better than others? What role does a ruling party's strength play in explaining the variation in authoritarian governance? At a time when rising one-party regimes pose grave challenges to the liberal democratic model, answering these questions is of great academic and practical importance. It has been argued that because stronger parties have greater capacity to pursue collective action, discipline party members, and gather information, they are more capable of maintaining political stability (Brownlee Reference Brownlee2007; Geddes Reference Geddes1999; Levitsky and Way Reference Levitsky and Way2010; Magaloni Reference Magaloni2006; Magaloni Reference Magaloni2008; Reuter Reference Reuter2017; Svolik Reference Svolik2012), stimulating economic growth (Bizzarro et al. Reference Bizzarro, Gerring and Knutsen2018; Popa Reference Popa2021), implementing redistributive policies (Pelke Reference Pelke2020; Rasmussen and Knutsen Reference Rasmussen and Knutsen2021), and improving citizens well-being (Bellinger Reference Bellinger2021).
There are, however, two major gaps in our knowledge of authoritarian parties. First, existing studies assume that the effects of strong parties on regime performance are homogenous across party-based autocracies. Regardless of how parties originated or gained power, their strength would invariably contribute to positive outcomes. In this article, I argue that the relationship between party strength and governance outcomes critically depends on party origins. When parties originate as social movements seeking to overthrow the existing political system, their organizations are created primarily to mobilize mass support in the power struggle. After seizing power, the operation of party organizations tends to follow a path-dependent logic as party leaders continue to see party strength as a tool to cement popular support. As a result, strong party organizations lead to more public goods provision and better governance outcomes. For parties that gain power through other means (coup d'état, election, foreign imposition, etc.), their leaders have less incentive to utilize party organizations to improve citizen well-being. Absent the close party-mass linkage forged during an anti-regime-struggle period, parties are more likely to be employed as a machine to co-opt powerful local elites or repress the opposition.
Second, while existing theories recognize party strength as a multidimensional concept, they tend to examine the overall impact of the phenomenon without clarifying which aspect of party strength matters most for the outcome of interest (Reuter Reference Reuter2022 is an important exception). This neglect is mainly driven by the assumption that different sub-dimensions of party strength always vary together and affect regime outcomes similarly (Levitsky Reference Levitsky1998). I argue that the ruling party's infrastructural strength – the ability of grassroots party organizations to penetrate the society and build linkage with the masses – contributes to positive governance outcomes, especially in regimes with social movement origins. By contrast, other aspects of party strength, such as institutionalized power-sharing and internal cohesiveness, have far less bearing on good governance.
My theory explains how party infrastructural strength (henceforth PIS) can improve a regime's capacity to realize ‘good governance’, defined as the delivery of essential public goods for average citizens (Rotberg Reference Rotberg2014). It also elucidates why movement parties are more inclined to utilize infrastructural strength toward governance improvement than other authoritarian parties. To test the theory's main implications, the study draws on multiple datasets to identify all autocratic ruling parties during the post-Second World War period and gather rich information about their characteristics. The empirical analysis finds evidence that PIS, rather than other aspects of party strength, increases the provision of public goods such as health care and education. Moreover, this result is driven by the association between party strength and good governance in movement-party regimes. Tests using different governance indicators generate similar findings that strongly support my theory. In addition, I provide case narratives of three ruling parties to illustrate the causal mechanism and address potential endogeneity challenges.
This study should be relevant to several subfields of comparative political research. First, it contributes to the literature on how authoritarian institutions shape a wide range of important outcomes, such as regime survival (for example, Gandhi Reference Gandhi2008; Geddes Reference Geddes1999; Svolik Reference Svolik2012) and economic development (Gehlbach and Keefer Reference Gehlbach and Keefer2012; Wright Reference Wright2008). It identifies a specific feature of ruling parties and explains how its effect on governance varies across party types. Second, it adds to the vast literature on governance, which has so far focused on factors such as power-constraining institutions (Acemoglu and Robinson Reference Acemoglu and Robinson2012), the level of democracy (Blaydes and Kayser Reference Blaydes and Kayser2011; Ishiyama Reference Ishiyama2019), and state capacity (Fukuyama Reference Fukuyama2013). This article brings to attention the impact of PIS, which has largely been ignored in previous studies. Crucially, I argue that a perspective of state capacity that leaves out party strength at the grassroots fails to grasp a key instrument with which autocrats govern their societies. Third, existing studies on political parties have classified them into externally and internally mobilized ones based on whether they occupy a leadership position in the regime at the time of organizing a mass constituency (Duverger Reference Duverger1959; Shefter Reference Shefter1994). While useful, this approach was developed to understand competitive party systems. On the other hand, my theory borrows this framework to explain how parties' formative experiences can leave enduring legacies in the authoritarian context.
The rest of the article starts with a critical review of existing studies that examine the effects of ruling parties on important political outcomes in autocracies. This is followed by an attempt to theorize the relationship between PIS and the quality of governance. The article then proceeds to introduce the empirical research design and data sources, followed by the presentation of the main findings and robustness tests. After a deeper engagement with the causal process in the case studies, the concluding section discusses the study's implications.
Relevant Literature
Early studies of parties mostly focused on developed countries and emphasized the important functions they serve for the operation of representative democracies (Duverger Reference Duverger1959; Sartori Reference Sartori1976; Schattschneider Reference Schattschneider1942). In the political development literature that flourished after the Second World War, strong political parties were considered vital for achieving national integration and modernization (Huntington 1968; La Palombara and Weiner Reference La Palombara and Weiner2015[1969]; Zolberg Reference Zolberg1966). With the advent of the third wave of democratization, scholars gradually agreed that strong parties and stable party systems are invaluable for successful democratic consolidation (Ishiyama Reference Ishiyama2008; Mainwaring and Scully Reference Mainwaring and Scully1995; Randall and Svåsand Reference Randall and Svåsand2002; Wahman Reference Wahman2014).
As the expansion of democracy came to a halt in the mid-2000s (Carothers Reference Carothers2002; Diamond, Plattner, and Rice Reference Diamond, Plattner and Rice2015), a new academic genre devoted to explaining ‘authoritarian resilience’ emerged (Nathan Reference Nathan2003). A vast literature examined how nominally democratic institutions such as legislatures and parties can help authoritarian rulers withstand democratizing pressures. These studies have consistently shown that parties play a central role in prolonging non-democratic rule. Both large-N studies and case analyses have found that party-based regimes are more resilient than those without parties (Geddes Reference Geddes1999; Svolik Reference Svolik2012; Wright and Escribà-Folch Reference Wright and Escribà-Folch2012) and that regimes with strong parties are more resilient than those with weak parties (Brownlee Reference Brownlee2007; Kavasoglu Reference Kavasoglu2022; Levitsky and Way Reference Levitsky and Way2010; Slater Reference Slater2010). To explain the regime-bolstering effects of parties, existing works point to two possible mechanisms: first, parties create credible power-sharing deals among elites; second, party machines enhance regimes' ability to mobilize societal support, monitor mass behaviour, and punish dissent (Magaloni and Kricheli Reference Magaloni and Kricheli2010).
In addition to regime survival, scholars have also investigated how ruling parties affect the overall governance of societies. Some believe that party institutions may encourage economic growth by constraining the predatory behaviour of autocrats (Gehlbach and Keefer Reference Gehlbach and Keefer2012; Popa Reference Popa2021). Others posit that strong parties enable regimes to implement redistributive policies and improve the welfare of the governed (Bellinger Reference Bellinger2021; Pelke Reference Pelke2020; Rasmussen and Knutsen Reference Rasmussen and Knutsen2021). This strand of literature has identified two main mechanisms that link party strength and positive socioeconomic outcomes. The first ‘bottom-up’ mechanism focuses on the parties' capacity to gather information at the local level and then aggregate demands into national policies. In essence, local party branches can maintain close links with society, making it easier for ruling parties to understand citizens' demands and respond to their grievances. According to the second ‘top-down’ mechanism, strong parties allow leaders to employ party discipline and/or candidate screening to overcome opposition to welfare-enhancing policies within the incumbent party.
Despite major breakthroughs, current inquiries into the relationship between party strength and non-democratic governance still leave many questions unresolved. For one thing, existing studies mostly focus on how parties increase the capacity of regimes to provide public goods but speak much less about why authoritarian regimes would have any incentive to pursue policies that benefit all citizens. After all, the accountability mechanisms that ensure responsive governance, such as freedom of speech and electoral competition are, by definition, absent in non-democratic states. The studies reviewed above ignored this question or provided explanations extraneous to party strength. For example, Bellinger (Reference Bellinger2021) argued that autocracies must cater to citizens to enhance their legitimacy and ensure regime survival. Pelke (Reference Pelke2020) based his analysis on the selectorate theory (Bueno de Mesquita et al. Reference De Mesquita, Smith and Siverson2005), arguing that the incentives to provide social welfare ultimately depend on the size of the winning coalition. It is notable that these studies all assumed that authoritarian regimes face similar incentive structures when it comes to social welfare provision, regardless of their origins and history. None entertained the possibility that the motivations of party leaders to improve governance may depend on the purposes for which the party organizations were first created.
Previous studies also treat party strength as a composite index that reflects diverse aspects of party organizations and their relations with society. Bizzarro et al. (Reference Bizzarro, Gerring and Knutsen2018) combined six indicators to measure party strength: national party organizations, local party branches, centralized candidate selection mechanisms, legislative cohesion, minimal party switching, and programmatic linkages to the social base. Similarly, Kavasoglu (Reference Kavasoglu2022) employed five indicators: personalism, internal party cohesiveness, local party branches, the activity of local party personnel, and ties to social organizations. This approach assumes that the index's components are partially substitutable and that weakness in one dimension can be compensated by strength in another. However, these indicators capture very different features of party organizations and do not always vary together (Levitsky Reference Levitsky1998). A party's elite-level dynamics can be quite detached from its mass-level institutions (Slater Reference Slater2003), and the consequences of elite- and mass-level strength can be quite different (Koss Reference Koss2018; Reuter Reference Reuter2022). What is needed is an approach that can specify which aspect of party strength matters most for the interested outcome.
A Theory of Party Strength and Autocratic Governance
I argue that the infrastructural strength of ruling parties determines governance outcomes in non-democratic societies, conditional on the origins of party organizations. The theory-building exercise consists of four steps. I first explain why PIS increases the capacity of ruling parties to deliver essential services to citizens. The second part contends that whether rulers are incentivized to employ PIS to improve citizen well-being depends on party origins. The theory then explains why, in authoritarian regimes, PIS plays a role in governance that is distinct from and independent of state capacity. The final part clarifies why PIS matters more for governance outcomes than other aspects of party strength, such as impersonalization and elite cohesion.
PIS and Governing Capacity
PIS refers to the ability of grassroots party organizations to penetrate the territory and maintain active interaction with the citizenry. The concept is an adaptation of Michael Mann's idea of state infrastructural power (1984), which captures the ability of the state to radiate out from the centre and implement its decisions across the country. My theory, however, is concerned with the spread and vitality of local party organizations rather than the state apparatus. Parties have strong infrastructural strength when their local branches are permanent rather than being maintained only during special events such as elections. They can reach a large proportion of the nation's territory and interact actively with civil society. These interactions can take the form of organizing political activities such as rallies and protests, exerting influence over prominent social groups, and propagating the party's message (Esen Reference Esen2014; Gibson et al. Reference Gibson, Cotter and Bibby1985; Tavits Reference Tavits2011). Infrastructurally strong parties can enhance the regime's governing capacity in two ways: by facilitating information transmission between the centre and periphery and by improving the ability to deliver essential goods to the citizens.
First, governments can more effectively improve citizen well-being when channels exist for local communities to convey valuable information to the authorities (Kosec and Wantchekon Reference Kosec and Wantchekon2020; Peisakhin and Pinto Reference Peisakhin and Pinto2010; Wantchekon and Riaz Reference Wantchekon and Riaz2019). Existing studies have underscored the role of elections and legislatures in gathering information for autocrats (Malesky and Schuler Reference Malesky and Schuler2011; Manion Reference Manion2015; Miller Reference Miller2015), but concerns about regime safety often lead to severe restrictions on these institutions and their informational functions (Knutsen, Nygård, and Wig Reference Knutsen, Nygård and Wig2017). By comparison, local party branches can be particularly important channels for information collection as they have a more widespread presence in society and contain fewer risks of triggering democratic transitions. Specifically, there are three types of information that PIS can help gather to improve governance. The first is information about pressing shortages in providing certain public goods (Miller Reference Miller2015; Rosenzweig Reference Rosenzweig2015). The second is information that some unpopular policies have generated widespread discontent within a local community (Martinez-Bravo et al. Reference Martinez-Bravo, Padró I Miquel and Qian2022). The third is information about the corruption and incompetence of particular local leaders (Malesky and Schuler Reference Malesky and Schuler2011). This body of knowledge enables regimes to better target in-need populations and tailor economic and personnel policies to local conditions.
Local party officials who reside in and have various ties to the area are under pressure to relay citizen demands and complaints to higher authorities to improve their moral standing in the communities (Nye and Vasilyeva Reference Nye and Vasilyeva2015; Tsai Reference Tsai2007). For example, the Singapore's People's Action Party (PAP) established a branch in every constituency. One of the major branch activities is the Member of Parliament's Meet-the-People Session, which takes place once a week and allows the people to bring their problems to the party, seeking assistance. The PAP treats these sessions seriously because the MPs are usually present with their entire branch committee (Chan Reference Chan1976, 105–9; Mauzy and Milne Reference Mauzy and Milne2002, 43). In the absence of such local presence, parties are less likely to learn the preferences of citizens, especially those living in poor and remote areas.
Second, PIS improves the capacity to implement social and economic policies that directly benefit citizens. Delivering public goods such as education and health care to citizens requires the presence of competent personnel throughout the country. When local party branches are permanent, party cadres experience fewer personnel turnovers and are more likely to interact with citizens on a consistent basis. This gives them more opportunities to accumulate expertise in service delivery compared with members of organizations that have only seasonal existence (Gibson et al. Reference Gibson, Cotter and Bibby1985). In China's recent anti-poverty campaign, Communist Party cadres dispatched to villages played a pivotal role in delivering subsidies and assistance to poor peasants (Zuo, Wang, and Zeng Reference Zuo, Wang and Zeng2023). They were able to do so largely due to their extensive work experience in grassroots party organizations and familiarity with rural issues. In addition, local party organizations can take advantage of their ‘embeddedness’ in society to obtain the collaboration of civil society groups in the delivery of public services (Evans Reference Evans1995). For example, after Tanzania gained independence, the ruling party, the Tanganyika African National Union (TANU), established several mass organizations for social mobilization and transformation tasks. During the rural collectivization campaign of the early 1970s, the TANU worked with the Tanzania Youth League to build roads, expand primary education, and build basic clinics in the newly constructed villages (Morse Reference Morse2013, 98).
It is worth noting that my definition of PIS involves two dimensions. First, it requires investment in permanent party structures. Second, it requires local party offices to reach a large portion of national territory. My argument implies that strengths on both dimensions are necessary conditions for good governance. On the one hand, when a party's national coverage is limited, permanent structures can raise capacity in areas where they are present but not in other areas (Liu Reference Liu2022). This will likely result in geographically unbalanced development and tension between regional groups, dampening a country's long-term governance prospects. On the other hand, absent permanent structures, party nationalization tends to produce local branches that are dormant except during elections and unable to perform governing tasks with consistency. In short, permanent structures and nationalization are necessary to provide national public goods and reduce regional favouritism (Castañeda-Angarita Reference Castañeda-Angarita2013; Franck and Rainer Reference Franck and Rainer2012; Hicken, Kollman, and Simmons Reference Hicken, Kollman and Simmons2016). This implication will be tested in the empirical analysis.
Party Origins and Authoritarian Governance
It is one thing for ruling parties to have the infrastructure to gather information and implement policies. Whether they will have any incentive to use this strength to improve citizen well-being is a different matter. Like state capacity, PIS may be deployed by political agents for both benign and malign purposes (Centeno et al. Reference Centeno, Kohli, Yashar, Centeno, Kohli and Yashar2017, 11). Conventional wisdom holds that ruling parties are more likely to employ their local branches to repress dissent (Koss Reference Koss2018; Levitsky and Way Reference Levitsky and Way2010; Slater Reference Slater2003) or co-opt selective groups whose support is necessary for regime survival (Diaz-Cayeros, Estévez, and Magaloni Reference Diaz-Cayeros, Estévez and Magaloni2016; Magaloni Reference Magaloni2006; Stokes Reference Stokes2005; Wintrobe Reference Wintrobe2000).
Several studies have shown that ruling parties' formative experiences powerfully shape subsequent regime strength, but it is less clear how party origins affect everyday governance. Levitsky and Way (Reference Levitsky and Way2013, Reference Levitsky and Way2022) argued that revolutions give rise to parties with strong mass organizations and elite cohesion. More generally, seizure groups born out of insurgency tend to develop more sophisticated organizations to reach most citizens and incorporate them into the regime's project (Geddes et al. Reference Geddes, Wright and Wright2018, 40). Slater (Reference Slater2009; Reference Slater2010) underscored the importance of politically autonomous communal elites for overthrowing old regimes and building state infrastructural power. Together, these works suggest that the experience of contentious politics leaves behind strong PIS, but whether and why parties in power will deploy PIS for ‘good’ purposes is rarely discussed.
I argue that the main functions served by PIS depend on the historical contexts in which party organizations first emerged. For parties that originated as social movements to overthrow the existing political system, their histories of anti-regime struggle can give leaders strong incentives to improve citizen welfare on a broad basis. Historically, movement parties were organized as political groups that pursued different forms of contentious politics to seek political change, ranging from strikes and boycotts to more violent means such as urban insurgency and guerrilla warfare.Footnote 1 These parties started from positions of weakness in comparison to the regimes they sought to replace, whether they were personalist dictatorships, one-party governments, or colonial authorities. Lacking financial and technological resources, movement parties often resorted to mobilizing mass support to match the strength of incumbent regimes.
On the way to seizing power, the daunting challenges faced by movement parties sometimes forced them to be ‘mass-regarding’; that is, responsive to popular interests and demands without being formally accountable to them (Womack Reference Womack1987). For these parties, an important goal of developing party organizations was to forge bonds with the masses to extract support and increase their chances of survival. Recent civil war studies reveal that some rebel groups provided a wide range of social services for the masses in areas under their control (Arjona Reference Arjona2014; Huang Reference Huang2016; Thaler Reference Thaler2018; Zaks Reference Zaks2017). In return, residents of the ‘liberated areas’ contributed manpower, supplies, and spiritual support that sustained the resistance movements. Mobilizing popular support was equally important for nationalist groups agitating to end colonial rule through peaceful means. In Ivory Coast, for example, the PDCI strengthened its organizations to mobilize pro-independence activities and to compete with the chiefs and the colonial administration for popular allegiance. By 1949, it had been organized with an articulated hierarchy with cell-like base units, establishing committees in half of the country's 8,000 or so villages (Zolberg Reference Zolberg1964, 117).
Drawing on insights about the path-dependent nature of social processes, I argue that the party-mass linkage formed prior to the seizure of power makes movement parties more likely to employ PIS to provide public goods. Path-dependent explanations focus on how decisions made at critical juncture points lead to the formation of institutions that have self-reinforcing properties (Mahoney Reference Mahoney2000; Mahoney Reference Mahoney2001; Pierson Reference Pierson2004). After the critical juncture, institutions continue to evolve in response to changing environmental conditions but in ways that are constrained by past trajectories. For movement parties, the period leading up to the capture of national power represents the crucial moments when structural constraints on decision-making are temporarily loosened, and party leaders enjoy rare freedom to build the prototype of governing institutions. In this period, party leaders may choose not to develop the party's organizational strength but may strike bargains with various elite groups or rely on the military for support. However, once they decide on infrastructural strength as the party's survival strategy, the choice tends to leave enduring legacies. Therefore, the burden of analysis is to identify the ‘mechanisms of reproduction’ (Thelen Reference Thelen1999, 390), namely how the interaction between PIS and mass-regarding governance continued into the post-seizure period.
At least two mechanisms explain the enduring importance of PIS for public goods provision. The first mechanism operates through the process of increasing legitimization wherein the ideas and practices that provided legitimacy for an organization in the past form a basis for making future decisions about what is appropriate (Mahoney Reference Mahoney2000, 523). Like other organizations, parties strive to confer legitimacy on their activities, and this effort profoundly affects their behaviours (Dowling and Pfeffer Reference Dowling and Pfeffer1975; Hall and Taylor Reference Hall and Taylor1996, 946–50). Once an institution is chosen to provide organizational legitimacy in a party's formative period, it is likely that it will continue to be seen as legitimate. This is because social actors operating in complex environments tend to filter information into existing ‘mental maps’ while the development of ‘norms of appropriateness’ typically follows a self-reinforcing process (Pierson Reference Pierson2004, 38–9). Thus, the close ties between the party and the masses forged during the revolutionary days became an important part of the party's founding myth, something party elites will constantly invoke in the future to legitimize their hold on power. Assuming that human behaviour is driven in part by norms and moral templates, a mass-oriented legitimating discourse can induce ruling parties to maintain their responsiveness to citizens.
The second mechanism of reproduction focuses on learning effects. Once an institution is in place, social actors will learn how to operate in the existing system. The skills and strategies they develop allow them to navigate the system more effectively, making them vested in the current institutional environment (Pierson Reference Pierson2004, 24; Thelen Reference Thelen1999, 392). As mentioned, movement parties have typically developed a grassroots network to perform governance tasks such as revenue collection and welfare distribution prior to the power seizure. This process required the recruitment of committed party militants who have developed skills of mass mobilization, ranging from the basic routines of distributing pamphlets and posting posters to the more challenging tasks such as organizing rallies and helping the disadvantaged. Having large numbers of militants familiar with mass work tends to bias regime policies in a mass-regarding direction since such policies are conducive to maximizing the value of their skills. Moreover, rank-and-file party members who are better at providing the mundane service of mobilization enjoy better promotion prospects within the party hierarchy (Svolik Reference Svolik2012, 169). Therefore, top party leaders who rose through the ranks because of their professional investment in skills and ‘sticky’ organizational resources may continue to deploy party-led mobilization as a key solution to various problems faced by the regime.
Due to the legitimization and learning effects mechanisms, the connection between grassroots party strength and responsiveness can be reinforced over the regime's duration. The argument is NOT that movement parties always maintain high PIS; these may decline over time due to the presence of resource rents and international forces (Zeng Reference Zeng2021). Such a decline is likely to negatively affect governance because the rulers have lost an important tool for gathering information and delivering public goods.
I also argue that while non-movement parties may strengthen their PIS, this is less likely to contribute to governance because the preceding argument about path dependence does not apply. These parties, especially those created from above by a dictator, generally lack a formative period during which party organizations penetrate society and forge bonds with the population (Geddes et al. Reference Geddes, Wright and Wright2018). For this reason, autocrats cannot credibly invoke the myth of a mass-serving party to gain legitimacy, which may come from personal charisma, performance, or nationalism (Burnell Reference Burnell2006; von Soest and Grauvogel Reference Von Soest and Grauvogel2017). Likewise, non-movement parties are not endowed with an army of party militants deeply invested in delivering public services. Therefore, autocrats are more likely to deploy their rank-and-file members to conduct electoral manipulation, repress opponents, and/or build a patronage network that benefits selective groups. To sum up, while infrastructural strength promotes governing capacity across party types, movement parties have much stronger incentives to apply this power to providing public goods than parties with other origins.
PIS and State Capacity
Having elaborated on why PIS enhances a regime's capacity and incentive to improve governance, one additional point needs to be clarified: is PIS distinct from the more familiar concept of state capacity, and does the former hold explanatory power independent from the latter? State capacity involves the state's ability to ‘process information, implement policies, and maintain governing systems’ (Centeno et al. Reference Centeno, Kohli, Yashar, Centeno, Kohli and Yashar2017, 9). Since a key dimension of state capacity is the degree to which the state can penetrate society and make effective contact with citizens (Hanson and Sigman Reference Hanson and Sigman2021), there is apparently significant overlap between party and state infrastructural power. What distinguishes the two concepts is that, in the former, the protagonists who exercise the organizing capacity are rank-and-file members of the ruling party rather than state employees.
There are three reasons why authoritarian rulers sometimes rely on party organizations instead of state agencies to perform governing tasks. First, authoritarian parties are unwilling to accept a peaceful transfer of power. As a result, they are deeply interested in ‘credit claiming’ (Mayhew Reference Mayhew1974), making sure that citizens attribute welfare-enhancing policies to the ruling party. Indeed, party leaders may be reluctant to develop popular and effective state agencies because, in the unwelcome scenario of a party turnover, such agencies would become assets of another party. In particular, the movement parties tend to emphasize that they are the founders of a new political era, bringing more participation opportunities and socioeconomic benefits to the people. Therefore, it is imperative that the rank-and-file members ‘wear a party hat’, even if most of the services they deliver come from state resources. In this context, the conventional focus on state capacity tends to overlook an important channel through which regimes maintain connections to their citizens.
Second, compared with state employees, party members are uniquely suited for mass mobilization. Whereas state agencies suffer from an innate tendency towards bureaucratization, party organizations tend to socialize its members through ideological beliefs. Thus, when ruling parties launch major projects of social transformation, idealism is usually prominent in motivating party militants to accept overtime, low-pay, or entirely voluntary mass work. For example, immediately after the 1979 Nicaragua revolution, the victorious Sandinistas mobilized approximately 80,000 literacy crusade workers who helped reduce the country's illiteracy rate from 52 per cent to less than 13 per cent in just one year (Vilas Reference Vilas1986, 218). It would be politically undesirable and financially unrealistic to rely solely on paid government workers to carry out such missions.
Third, party organizations can establish a permanent presence in territories and social sectors in a way that is rarely possible for state agencies. In peripheral territories and grassroots social units, such as residential communities and private firms, it is costly and ineffective to maintain state agencies for the purpose of information gathering and regulation. By contrast, party cells composed of ordinary residents, workers, and managers are in a much more natural position to perform these tasks. Because primary party units are answerable to their superiors in the party hierarchy, they ensure that ‘the reach of the party is greater than the reach of the state’ (Koss Reference Koss2018, 57). In the case of China, the organizational hierarchy of state organs ends at the township level, but that of the party reaches further down to villages. Similarly, while the Chinese state's relationship with the private sector mainly comprises its regulatory role, party branches are established in most private firms to perform political and service-oriented functions (Han Reference Han2015; Zhang Reference Zhang2018).
It should be recognized that many autocratic parties have infiltrated and dominated the state, blurring the distinction between the two sets of institutions. This is particularly true in Leninist ‘party-states’ where the party organizations deeply penetrate the state apparatus and party and state activities are intertwined (Priestland Reference Priestland1997; Zheng Reference Zheng1997, 9). However, many of these former party-states have implemented reforms to more clearly separate the ruling party and the state in response to the democratizing pressures of the 1990s (Hadenius in Nagel Reference Hadenius and Nagel1994; Magaloni and Kricheli Reference Magaloni and Kricheli2010; Sumich Reference Sumich2010). Even in orthodox party states, rank-and-file party members routinely formed grassroots organizations and performed tasks where the state apparatus was absent (Koss Reference Koss2018; Morse Reference Morse2019). Therefore, the argument that PIS can play an active role in governance independently of state capacity is applicable to most party-based regimes.
Mass vs. Elite-Level Dimensions of Party Strength
The final building block of the theory is to explain why, among the many aspects of party strength, infrastructural strength is the most important in determining governing outcomes. There are two major additional indicators of party strength to which scholars have attributed much explanatory power, both occurring at the elite level. The first can be called de-personalization, or the ability of the ruling party to maintain its integrity and operation without relying on a charismatic leader. This requires the party to develop impersonal rules and procedures that regulate recruitment and decision-making (Geddes et al. Reference Geddes, Wright and Wright2018; Meng Reference Meng2021). These rules allow the dictator to make a credible commitment to rivalling elites that their service and loyalty will be rewarded with rents and promotion, thereby reducing the uncertainty of a power struggle (Brownlee Reference Brownlee2007; Magaloni Reference Magaloni2008; Svolik Reference Svolik2012). The second is party cohesion, which refers to the unity and solidarity that enables the party to act collectively. Cohesive parties demonstrate strict discipline and facilitate the making and implementation of major policy initiatives (Bizzarro et al. Reference Bizzarro, Gerring and Knutsen2018, 8).
There are reasons to expect these elite-level factors to have less of an impact on citizen well-being. First, whereas grassroots party members interact directly with citizens, elite-level factors need to operate through a longer causal chain to have any tangible effect on society. For example, power-sharing institutions must credibly guarantee the safety of rivalling elites, who will develop a vested interest in the regime's longevity. This could lead elites to make policies that enhance the long-term health of the regime, although these policies will need to be implemented by ‘street-level bureaucrats’ (Lipsky Reference Lipsky1971). With a long causal process, it is more likely that part(s) of the causal path will be blocked by context-specific factors, reducing any effect on the outcomes. Indeed, the overall record of party institutions to prevent elite splits is rather mixed. For example, a study of 227 elections in competitive authoritarian regimes found that in 19 per cent of the cases, a member of the hegemonic party defected to run against the regime's official candidate (Reuter and Gandhi Reference Reuter and Gandhi2011).
Second, significant tension exists between de-personalization and party cohesion, as what indicates strength on one dimension may result from serious weakness on the other. Thus, a highly de-personalized and rule-based party may breed intense factional struggles since each faction can exploit power-sharing rules to promote its own interest, thereby hampering party cohesion. On the other hand, the apparent unity and solidarity of a party could reflect the fact that a paramount leader has consolidated his grip on the party and has managed to repress any dissent. The point is that what constitutes authoritarian party strength at the elite level still seems to be an unresolved theoretical question, and it is hard to pinpoint how these elite-level dynamics will affect governing outcomes in one way or another.
The theoretical discussion leads to three primary hypotheses:
H1: PIS is positively associated with governance outcomes in autocratic regimes ruled by movement parties.
H2: In autocratic regimes ruled by non-movement parties, PIS is not associated with governance outcomes.
H3: In party-based autocratic regimes, party de-personalization and cohesion are not associated with governance outcomes.
Data and Research Design
Sample and Variables
To test these hypotheses, I draw on the Autocratic Ruling Parties Dataset (ARPD) developed by Michael Miller (Reference Miller2020), which includes all autocratic ruling parties in power between 1940 and 2015. Autocracy is defined using Boix, Miller, and Rosato's (Reference Boix, Miller and Rosato2013) binary measure, and a ruling party is defined as a political party that is either the supreme ruling power or is used as a significant vehicle of power by the regime and is clearly preeminent among all parties. Given that the aim is to explore how ruling party strength affects governance outcomes, it makes sense to exclude autocracies wherein ruling parties are absent. The APRD is in country year format and tracks continuous party spells in power. One country may have multiple ruling party spells; more rarely, one party may have multiple spells in power. The sample includes 279 ruling party spells across 262 distinct parties and 133 countries. Table 10 in the Appendix provides a full list of these parties.
The outcome to be explained is the regime's performance in providing essential public goods for average citizens. I have selected six indicators to measure such governance quality. The first is average daily calorie consumption, which some scholars have argued is a good proxy for material distribution to the poor (Bellinger Reference Bellinger2021; Blaydes and Kayser Reference Blaydes and Kayser2011). The next four indicators are life expectancy, infant mortality (per 1,000 live births), GDP growth, and schooling, which capture the government's ability to deliver health services, economic development, and education.Footnote 2 Finally, I use the Human Development Index (HDI), a summary measure of income, education, and health to further corroborate the results. While an element of arbitrariness is inevitable in the selection of indicators, the ones chosen here cover the most basic aspects of material well-being. Thus, if an explanatory variable displays a significant impact on most of these indicators, there is reason to consider it an important determinant of general social welfare.
My main explanatory variable, PIS, comes from the V-Party project (Luhrmann et al. Reference Luhrmann, Dupont and Higashijima2020). Until very recently, studies on authoritarian ruling parties have been hampered by the lack of data on internal organizational characteristics at the party level. Consequently, previous studies have relied on crude proxies of party strength such as regime types (Magaloni Reference Magaloni2008; Wright and Escribà-Folch Reference Wright and Escribà-Folch2012), party ages (Gehlbach and Keefer Reference Gehlbach and Keefer2012), or the ability to survive leadership changes (Meng Reference Meng2021; Zeng Reference Zeng2020). Information on parties' grassroots organizations and their social roots has been very difficult to come by, which partly explains why existing theories of authoritarian parties tend to stress elite-level dynamics. The V-Party project has the potential to fill this gap as it offers expert-coded assessments of party organization and identity for parties in most countries from 1970–2019. A total of 665 experts coded parties that reached more than 5 per cent of the vote share at a given election, with at least four experts coding for each observation. These expert-coded data were then aggregated using the Bayesian Item Response Theory measurement model.
I used three indicators from the V-Party dataset to construct the PIS variable. The first indicator is Permanent Local Presence, which measures the degree to which party activists and personnel are permanently active in local communities. The second is Local Organizational Extensiveness, which measures the geographical coverage of permanent party offices. Together, these indicators reflect party strength in organizing an active network of personnel and branches at the grassroots, covering large parts of the territory. The third indicator, Ties to Social Organizations, focuses on the degree to which the party maintains ties to prominent social organizations. Collaborating with or, in the case of communist regimes, controlling civil society groups can greatly enhance parties' ability to mobilize the masses. I performed a principal component analysis to see if the three indicators can be aggregated into one variable. As it turned out, there was one underlying factor with an eigenvalue of 2.40, far exceeding that of the secondary factor (0.37). This strongly suggests that the variations in the three indicators mainly reflect variations in just one latent variable. Therefore, Factor 1 was retained as the index of PIS.
The V-Party dataset also contains two elite-level variables often associated with party strength. Personalization of a party measures the extent to which the party is focused on the personal will and priorities of one individual leader. Internal cohesion indicates the extent to which party elites disagree over party strategies and how many have left the party over such disagreement. According to hypothesis 3, these two variables should have less effect on governance than PIS. The V-Party variables were collected for election years only (whether single-party or multiparty). For each non-election year, I used values from the last or the next election year, whichever was closer in time.
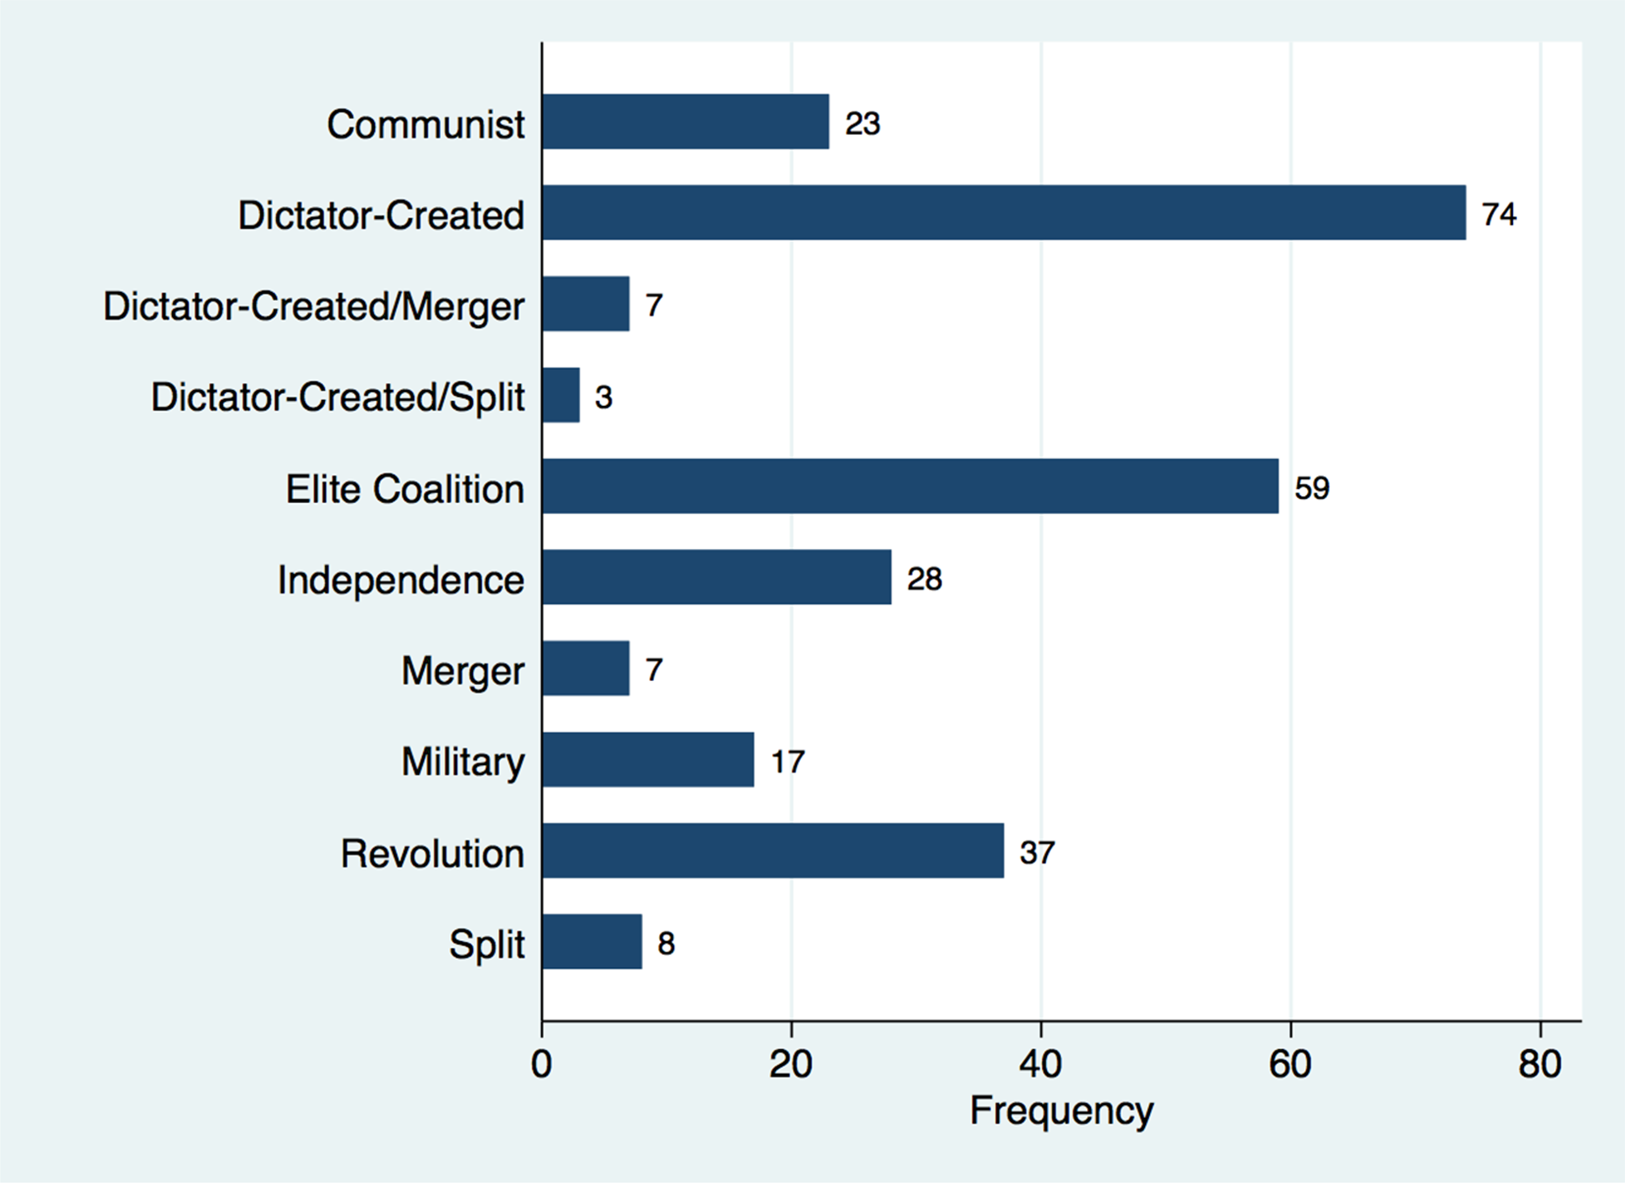
To operationalize the key concept of movement parties, I drew upon the APRD's coding of parties' founding origins. The dataset conceptualized ten categories of party origins, as shown in Fig. 1. Among these categories, two correspond closely to the idea of a movement party: Revolution (parties organized as a violent revolutionary organization) and Independence (parties organized as a non-revolutionary pro-independence organization). Parties in both categories were organized as social movements that pursued contentious politics to seek fundamental political changes. Therefore, I created a dummy variable called movement party, which takes the value of one if the ruling party has one of the two origins.Footnote 3 The dataset includes forty-four revolutionary parties and twenty-eight pro-independence parties, making movement parties account for 25.9 per cent (72/278) of all ruling parties.
The frequency of different categories of authoritarian party origins as classified by Miller (Reference Miller2020)

Figure 2 displays the average value of PIS over time for movement and non-movement parties, respectively. Consistent with previous findings (Levitsky and Way Reference Levitsky and Way2013; Zeng Reference Zeng2021), movement parties tend to have higher PIS than non-movement parties. It also shows substantial temporal variation in the key independent variable for both types of party, lending more statistical power to the analysis.
Party infrastructural strength over time: movement vs. non-movement parties
Note: This figure shows the average values of party infrastructural strength (as measured by Luhrmann et al. (Reference Luhrmann, Dupont and Higashijima2020)) across time for movement and non-movement parties. The shaded areas signify one standard deviation around the mean.

The control variables account for several alternative explanations of governance outcomes. First, a regime's access to natural resources may have important governance implications. Thus, I control for resource dependence, operationalized as the sum of oil and gas production as a proportion of GDP (Ross and Mahdavi Reference Ross and Mahdavi2015). Second, I control for two socioeconomic variables, GDP per capita and total population, with both variables logged to normalize their distribution. Third, the occurrence of civil wars and coups may impede development. Therefore, all models include a 0–10 rating for civil war intensity and a dummy variable indicating a successful coup.Footnote 4 Fourth, I control for the number of years a party has been in power. This addresses the possibility that both dependent and independent variables may follow a trend that increases over time.
In more extensive specifications, I also control for several features of political institutions. First, since state capacity is widely believed to exert considerable influence on political and economic outcomes, I include a new measure of state capacity developed by Hanson and Sigman (Reference Hanson and Sigman2021). Controlling for this variable is also important for testing my claim that PIS has explanatory power independent of state capacity. Second, it is widely accepted that features of liberal democracy promote good governance (Acemoglu and Robinson Reference Acemoglu and Robinson2006; Blaydes and Kayser Reference Blaydes and Kayser2011; Kaufmann, Kraay and Zoido Reference Kaufmann, Kraay and Zoido1999). Therefore, the analysis controls for a country's Polity IV scores, with higher values indicating more democratic regimes. Finally, previous studies have shown that the overall strength of a country's political parties is positively associated with development outcomes (Bellinger Reference Bellinger2021; Bizzarro et al. Reference Bizzarro, Gerring and Knutsen2018; Rasmussen and Knutsen Reference Rasmussen and Knutsen2021). My theory contends that, at least among autocratic regimes, the strength of the ruling party matters most. To adjudicate these competing claims, I control for the index of overall party strength developed by Bizzarro et al. (Reference Bizzarro, Gerring and Knutsen2018).
The Empirical Setup
The main analysis estimates the following regression:

Here, Outcomeit represents development outcomes for country i in year t. The main independent variables are PIS and movement party, and their interaction term. This setup will allow the testing of hypotheses 1 and 2, as we expect α to be zero or negative and δ to be positive (we expect the opposite when the DV is infant mortality, as lower values indicate better outcomes). All independent variables are lagged by one year to reduce the concern of reverse causality.
Because the values of development outcomes are often slow-moving and dependent on their past levels, a lagged dependent variable is included to eliminate autocorrelation (Wilkins Reference Wilkins2018). However, this tends to bias the coefficients of other variables downwards (Achen Reference Achen2000), creating a hard test of my hypotheses. One of the robustness tests will estimate the models without the lagged DVs. Xit−1 represents the control variables. The baseline model controls for socioeconomic backgrounds and political conflicts. Because the variables related to political institutions (state capacity, democracy, etc.) are often correlated and may introduce multicollinearity, they are only included in a more extensive specification as a robustness check. The regression also includes country fixed effects, μ i, to capture unobserved heterogeneity across countries and year fixed effects, η t. All standard errors are clustered at the country level.
Empirical Results
Main Results
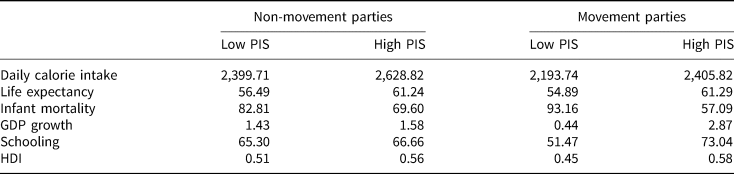
As a plausibility probe, Table 1 presents the average values of the dependent variables across four categories of country-year observations: (1) non-movement party with low PIS, (2) non-movement party with high PIS, (3) movement party with low PIS, and (4) movement party with high PIS. The median value of PIS is chosen as the cutoff point that divides high and low PIS. With the exception of daily calorie intake, the best governance outcomes are achieved under movement parties with high PIS. More relevant to my hypotheses, high PIS is associated with better outcomes in general, but its positive effects are more pronounced for movement parties. For example, the difference in GDP growth rate is 2.43 percentage points for movement parties but only 0.15 for other parties.
Descriptive statistics for different governance outcomes

Note: This table shows the means of the six governance outcomes across four categories of country year observations: (1) non-movement party with low party infrastructural strength, (2) non-movement party with high PIS, (3) movement party with low PIS, and (4) movement party with high PIS. The median value of PIS is chosen as the cutoff point that divides high and low PIS. The six dependent variables are: daily calorie intake retrieved from the FAO, life expectancy, GDP growth, HDI retrieved from Teorell et al. (Reference Teorell, Sundström and Holmberg2018), infant mortality, and schooling retrieved from Miller (Reference Miller2015).
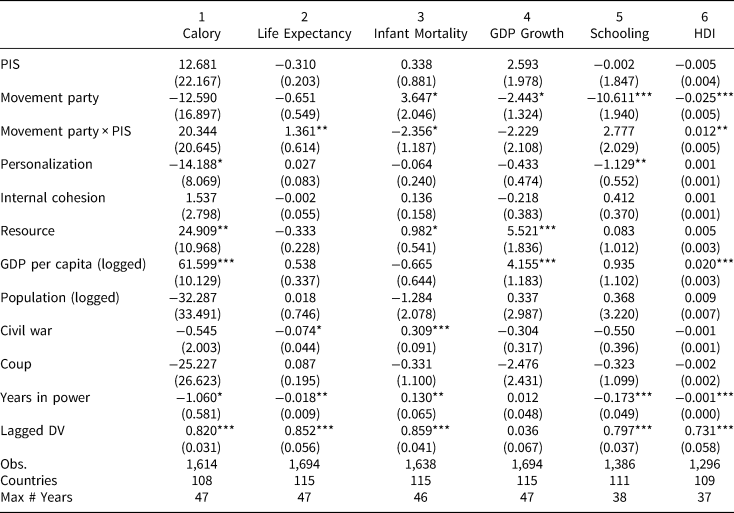
The primary results are reported in Table 2. The main effects of PIS are insignificant in all models, suggesting that it had little impact on development outcomes for non-movement parties. Meanwhile, the coefficients for the interaction term have the expected signs in five of the six models and are statistically significant in three models. Thus, with life expectancy, infant mortality, and HDI, the positive effects of PIS on governance are significantly greater for movement parties. This finding is visualized in Fig. 3, which shows the stark contrast in the PIS's coefficients and 95 per cent confidence intervals between parties of different origins. Hypotheses 1 and 2 are therefore corroborated. The analysis also provides partial support for hypothesis 3: personalization matters for some of the governance outcomes, but the effects are not as wide-ranging as PIS, while party cohesion is inconsequential. As expected, countries with higher levels of development, larger size, and fewer political conflicts tend to provide more public goods.
Impact of PIS on governance (baseline models)

Note: Models 1–6 use each of the six governance indicators as the dependent variables. The row ‘Max # Years’ indicates the maximum number of observations for a country in the panel. Estimator: OLS with country and year fixed effects. Standard errors are clustered by country. Unit of analysis: country year. All right-side variables lagged by one year.
Standard errors in parentheses. * p < 0.10, ** p < 0.05, *** p < 0.01.
Marginal effect of PIS on governance
Note: The titles of sub-graphs indicate the outcome variables. The vertical bars indicate 95 per cent confidence intervals of the coefficient estimates.

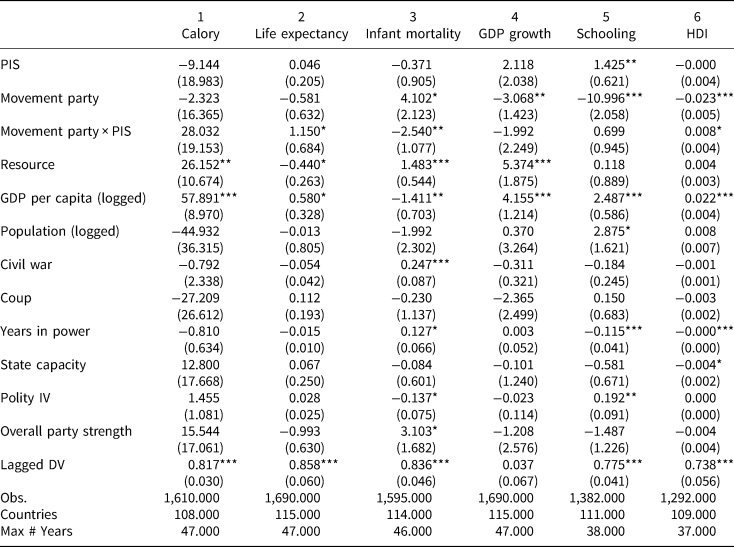
Table 3 presents the results from more extensive specifications, adding the three institutional variables. Because the elite-level variables are already captured in the overall party strength variable, they are not included in this exercise. The interactive effects remain significant and in the right direction in three models. Turning to the institutional variables, the all-encompassing index of party strength does not seem to have any positive effect on citizens' well-being. This further corroborates the view that PIS is more important than other aspects of party strength in determining governance. Higher levels of democracy are associated with better outcomes in some models, while the benefits of strong state capacity are less visible. This is consistent with my argument that autocratic parties are more incentivized to use the ruling party than state institutions to project their power across the realm.
Impact of PIS on governance (extensive models)

Note: Models 1–6 use each of the six governance indicators as the dependent variables. The row ‘Max # Years’ indicates the maximum number of observations for a country in the panel. Estimator: OLS with country and year fixed effects. Standard errors are clustered by country. Unit of analysis: country year. All right-side variables lagged by one year.
Standard errors in parentheses. * p < 0.10, ** p < 0.05, *** p < 0.01.
Robustness Tests and Extension
Additional tests were performed to estimate the robustness of the main findings, which are presented in the Appendix. The first test drops the lagged dependent variables and only uses standard errors clustered at the country level to deal with autocorrelation (Table 1A). Second, governance outcomes may not just be a function of PIS in the previous year but a country's overall experience with grassroots party strength in recent years. To account for this possibility, I measure PIS with a stock variable that takes the mean of PIS values of the past two years. The substantive results still hold with this measurement (Table 2A) and, to a lesser extent, when PIS is averaged over the past three years (Table 2B). Third, I run two regressions on the movement-party and non-movement-party samples, respectively. The split-sample approach confirms the results from the interaction-term analysis: PIS improves multiple governance indicators for movement parties but has little positive effect on non-movement parties (Tables 3A and 3B). Fourth, I replicate the analysis on a full sample of authoritarian regimes, including ones without a support party (Table 4A). The PIS of these ‘party-less’ regimes is imputed to be zero. Fifth, to show that the results are not sensitive to how the PIS index is aggregated, I repeat the analysis by replacing PIS with each of its three component variables (Tables 5A and 5B). Sixth, I test the implication that permanent structures and nationalization are necessary to realize good governance in movement-party regimes. Fortunately, the V-Party indicators of Permanent Local Presence and Local Organizational Extensiveness correspond well with these two dimensions. Table 6A examines the effects of party nationalization on governance when permanent presence is low (defined as below the median value). By contrast, Table 6B explores the situation when only permanent structures are present. The results suggest that strengthening PIS on one dimension alone does not generate better outcomes. This is consistent with the view that permanent structures and nationalization are mutually dependent on their positive effects on governance.
The next test examines an alternative explanation for the main findings. Since most twentieth-century revolutions and independence movements were inspired by leftist ideologies that advocated egalitarianism and redistribution, it may be the case that these socialist/Marxist ideologies explain the welfare implications of PIS, not the mass-mobilizing experience highlighted by my theory. The model added an interaction term between PIS and a party's left-right ideological stance to test this hypothesis. However, as shown in Table 7A, none of the models suggest that the effects of PIS are greater for more left-wing parties. Another way to test the alternative hypothesis is to analyze only parties with right-leaning ideologies, operationalized as observations with ideological scores greater than the mean. Results from Table 7B show that the key results hold even for these ‘rightist’ parties. Thus, the evidence suggests that the welfare-improving properties of PIS stem from the party-mass linkage forged during the seizure period, regardless of the party's ideological stance.
To further corroborate this claim, I take the PIS score of the year when a ruling party came to power as a proxy for party strength forged during the seizure period and examine whether it can predict citizen well-being over a regime's lifespan. Since first-year PIS is time-invariant, I collapsed the panel data to create one observation for each ruling party that contained the mean value of all variables over a party's ruling period. Table 8A shows that first-year PIS is a strong determinant of governance outcomes in the cross-sectional analysis.
Testing the Legitimization Mechanism
My theory proposed two causal mechanisms – increasing legitimization and learning effects – to explain why the party-mass ties formed during the period of power seizure may persist and induce ruling parties to provide public goods. Existing data allows for a preliminary test of the legitimization mechanism. I conducted the test here and left a systematic test of the second argument for a future project.
According to the legitimization argument, the experience of mass mobilization places serving the people at the center of the movement parties' legitimizing rhetoric. This will lead parties to prioritize improving governance if only to maintain a basic coherence in their discursive framework. The mechanism implies that movement parties will place more emphasis on ordinary people in their rhetoric than non-movement parties do. In the V-party dataset, the ‘people-centrism’ variable provides a reasonable measure of this aspect of party identity. Specifically, the variable measures the extent to which ‘the party leadership glorifies and identifies with the ordinary people, which they claim to represent’ (Luhrmann et al. Reference Luhrmann, Dupont and Higashijima2020, 24). Table 9A uses cross-sectional data to show that, on average, the rhetoric of movement parties centres around the people much more than that of non-movement parties. Moreover, the mechanism implies that movement parties do not just pay lip service to the people, but the people-centred discourse should motivate them to provide more public goods. Table 9B provides evidence that more people-centred rhetoric is associated with higher life expectancy and school enrollment.
While formative experiences may cast a long shadow over party identity, I expect the effects of party origins to decrease over time. In Table 9C, I included an interactive term to examine whether the difference in people-centrist rhetoric fades away as parties stay longer in power. The negative and statistically significant coefficient for the interactive term supports my theoretical expectation. However, judging by the magnitude of the main and interactive effects, it will take almost thirty-six years (0.431 divided by 0.012) for the difference to disappear completely. This suggests that the legacies of formative years are long-lasting and critical for understanding ruling party behaviour (Duverger Reference Duverger1959; Panebianco Reference Panebianco1988; Shefter Reference Shefter1994).
Assessing Causality with Case Studies
In this section, I provide three brief case narratives to illustrate the nature of the causal process, uncovering with greater precision how PIS affects governance and how such effects are moderated by party origins. The case of United Russia reveals how, for a non-movement party, strengthening its PIS does little to affect governance outcomes. The case of KANU (Kenya) shows that when a movement party ignores its organizational development, this narrows the regime's support base and leads to exclusive development outcomes. By contrast, the experience of the RPF (Rwanda) exemplifies how strong PIS can contribute to citizen well-being in a post-revolutionary context. In addition, the case studies help address the endogeneity problem by considering whether the correlation between key variables results from any confounding effects of background factors.
United Russia
After the disintegration of the Soviet Union in 1991, the first Russian President, Boris Yeltsin, chose not to build a pro-government party out of fear that it would challenge his power (Remington Reference Remington2008). Things changed after the inauguration of Vladimir Putin, who decided to support a dominant party that could facilitate his attempt to centralize power. This effort led to the formation of the United Russia (UR), which soon controlled career advancement in the legislature and served as a stable voting bloc for passing Putin's legislative agenda. At least in form, the UR achieved complete domination in regional and local politics, as most governors, mayors, and legislative members joined the ‘party of power’ (Fauconnier Reference Fauconnier, Jonson and White2012, 171–2). Since its creation, UR has seen a rapid uptake in its infrastructural strength. By 2007, it had established branches in Russia's 83 regions, 2,547 local branches, and 53,740 primary cells. Each regional branch ran a permanent organizational arm called the Regional Executive Committee, staffed by 10–50 employees (Reuter Reference Reuter2017, 134). Leaders of the primary cells constituted the party's activist core, penetrating workplaces and civil institutions to facilitate agitation, voter intimation, and vote buying during elections (Ibid., at 185).
While UR succeeded as the Kremlin's instrument to centralize power and co-opt regional leaders, there is little evidence that it played an independent role in local governance. In most cases, the executive branch dominated the party branches and possessed limited agency to make policies and distribute resources (Isaacs and Whitmore Reference Isaacs and Whitmore2014; Ledyaev and Chirikova Reference Ledyaev and Chirikova2017). As such, the functions of the UR were largely confined to appointing candidates for legislative elections (Kynev Reference Kynev, Ross and Gel'man2010), leaving most of the policymaking and implementation power in the hands of the administrative elites. Moreover, the UR's penetration of sub-national politics was accompanied by the absorption of diverse local interests, seriously undermining the party's internal cohesion. As UR gained a near monopoly over the nomination, local business groups and other leaders began to purchase the right to run in regional elections from the party (Kynev Reference Kynev and Studin2018). The capture of UR's branches by key economic actors made it even less likely to function as a governance-improving institution (Gel'man and Ryzhenkov Reference Gel'man and Ryzhenkov2011).
It is consistent with my theory that UR, despite its increasing PIS, has limited ability to shape Russia's governing process. As a dictator-created party, UR does not possess a founding myth of a heroic struggle that binds the party and the people. The Putin regime derives its legitimacy from Russian conservatism and the idea of ‘sovereign democracy’ rather than a mass party that ‘represents the people’ (Evans Reference Evans2015). Also absent is a formative period when UR's organizations provided public goods for the citizens in exchange for their support. Therefore, the regime is not path-dependent on a constant mass mobilization governance mode.
The Kenya African National Union
Kenya's campaign for independence dates back to the 1940s when the Kenya African Union (KAU) was formed to articulate grievances against the colonial administration. As KAU started to demand independence through a more forceful approach, the organization was banned in 1952, and its leader, Jomo Kenyatta, was imprisoned. In 1960, KAU was resurrected and merged with other nationalist movements to form the Kenya African National Union (KANU), the party that came to power by winning the two national elections prior to the granting of independence.
Kenya inherited a clientelist form of politics from the colonial period wherein local bosses, skilled at creating patronage networks within their communities, dominated the districts (Barkan and Okumu Reference Barkan, Okumu and Hermet1978, 93–4). Its first president, Kenyatta, neglected party-building and relied on clientelism as the main mode of linkage between the centre and the periphery (Morse Reference Morse2013, 111). He gave the local bosses free rein to run their political machines, who appealed to him for assistance in their home areas (Barkan and Okumu Reference Barkan, Okumu and Hermet1978, 96). As a result, KANU as an organization hardly existed in the localities. The number of KANU branches numbered only in the hundreds, but most were inactive; elections at the branch level were intermittent and unorganized. To bolster the perception of branch strength, branch leaders would habitually buy membership cards in bulk and distribute them to supporters (Okumu and Holmquist Reference Okumu, Holmquist, Barkan and Okumu1984, 62–3). A belated attempt to revitalize the party was launched in 1970 but was again undermined by a fragmented distribution of patronage (Collord Reference Collord2019, 80).
KANU's weak PIS significantly affected the country's development outcomes. Its dependence on clientelism meant that resources were disproportionately channelled to ethnic and regional groups close to the premier patron, Kenyatta. The Kikuyu elites of Kiambu became the main beneficiaries of the distribution of land and development funds. When opposition forces called for redistributive policies that would benefit broader segments of the population, KANU did not hesitate to put them to an end by coercion. One such force was the Kenya People's Union (KPU), a populist party based in the Lou community, poised to gather support from the poorest of the Kikuyu, who had grown tired of KANU's empty promises of development. The party was deemed a grave threat to KANU and was harshly repressed (Whitehead Reference Whitehead2009, 71). It is conceivable that had KANU developed a stronger PIS, it would have broadened the regime's support base and led to a more egalitarian distribution of wealth.
The main endogeneity challenge for this account is that some background factors may determine both KANU's party strength and the governance outcomes. In addition to Kenyatta's personal distaste for party-building, scholars have underscored two structural factors that shaped his decisions regarding KANU. First, Kenyatta inherited alternative governing resources, such as a solid civil administration and revenues from export agriculture, making the party less essential for political control (Collord Reference Collord2019, 79; Morse Reference Morse2019, 101). However, it is hard to argue that these governing resources predestined the Kenyan state to distribute wealth along ethnic and kinship lines. Second, on the eve of independence, Kenya was characterized by deep ethnic divisions, particularly among the Kikuyu, Luo, and Kalenjin peoples (Barkan and Okumu Reference Barkan, Okumu and Hermet1978, 89). While such cleavages increased the difficulty of building a national party, the decision to invest in party-building was ultimately contingent and could not be reduced to social structures. The experiences of countries such as Tanzania (Collord Reference Collord2019; Morse Reference Morse2019) and Rwanda (see below) show that, given strong political will, it is possible to construct strong parties in multiethnic societies.
The Rwandan Patriotic Front
Since the late 1950s, Hutu dominance in Rwandan politics forced the Tutsi minority to flee the country in successive waves. The Rwandan Patriotic Front (RPF) was formed within the diaspora community to fight for the return of refugees and social transformation in Rwanda (Reed Reference Reed1996, 485–6). A protracted civil war broke out in 1990 between the RPF guerrillas and the Rwandan government forces, culminating in the RPF's takeover of the country as it ended the genocide in 1994. A party-state was soon established wherein the party structure ran parallel to the state at all administrative levels, and the party established a robust presence in the rural areas (Purdeková Reference Purdeková2011, 480).
As Rwanda's ruling party, the RPF embarked on a comprehensive effort to reconstruct the country; it provided, inter alia, massive social spending to increase living standards and reduce potential unrest. The RPF-led government set out to implement rural land reform, making cash transfers to the poorest and improving the healthcare and education systems (Mann and Berry Reference Mann and Berry2015). During this process, the party's impressive infrastructural strength was key in delivering various services to its citizens. The creation of mutual health insurance programmes, or mutuelles, is a case in point. The RPF managed to use its vast network to inform people about health services and provisions. Societal groups were invited to participate in the oversight and management of health funds. The party also worked closely with local officials and community workers to deliver different nutrition interventions and spread awareness about health issues (Bellinger Reference Bellinger2021).
The RPF's incentives to utilize its PIS for improving governance were rooted in the party's protracted struggle for power. First, as a guerrilla force, the RPF asserted that it represented the ‘people’ and had the right to rule because of its commitment to the common good of all Rwandans (Lyons Reference Lyons2016, 1034). Once in power, delivering the promised social and economic transformation became important for maintaining the party's legitimacy. Second, throughout its multiple attempts to invade Rwanda, the RPF developed skills and institutions to govern the civilian population in the ‘liberated zones’. The RPF cadres focused on positively interacting with the local population, providing food, schools, and improved sanitation (Lakin and Beloff Reference Lakin and Beloff2014, 51–2). As the ruling party, the RPF's dependence on its extensive reach and mass mobilization reflects the enduring legacy of rebel governance.
Again, it could be suspected that some factors determined Rwanda's potential to develop a strong ruling party and achieve good governance. However, there are reasons to believe that the endogeneity hypothesis is not plausible. First, since Rwanda's independence, the Kayibanda and Habyarimana regimes relied on a crippling patronage system to enhance personal wealth, which stoked ethnic conflict (Lakin and Beloff Reference Lakin and Beloff2014). Thus, it is unlikely that Rwanda's endowments were inherently conducive to party and economic development. Second, while the RPF's history of armed struggle contributed to the formation of a strong party, it was far from inevitable that its leaders would continue to invest in party-building as a governing instrument. Many revolutionary parties with similar experiences of guerilla warfare failed to develop into strong ruling parties (Levitsky and Way Reference Levitsky and Way2022). Finally, it seems that contingent events at critical junctures greatly influenced the RPF's long-term development. Tito Rutaremara, one of the RPF's key organizers, was introduced to leftist political parties while studying in France (Lakin and Beloff Reference Lakin and Beloff2014, 50). When undergoing political education, the RPF's cadres were exposed to Lenin's writings, which influenced the party's model of organization.Footnote 5
The Endogeneity Problem of Party Origins
The case narratives also help address the concern that ‘party origins’ itself is an endogenous variable that makes the asserted causal relationship spurious. There is little doubt that structural and contingent factors jointly shape how a party originated. The concern is that these factors would also determine a country's party and socioeconomic development prospects. It would be far-fetched to make this claim, at least in three illustrative cases. In Russia, Putin's decision to form a ‘party of power’ was driven by the need to co-opt other powerful elites, facilitated by increasing oil revenues (Reuter Reference Reuter2017). Forming a party with a strong PIS was not a foregone conclusion from this starting point. Indeed, Smith (Reference Smith2005) has argued that regimes with plenty of resource rents were unlikely to develop robust party organizations. When facing similar elite conflict, Brownlee's comparative study (Reference Brownlee2007) shows that whether regimes can develop strong parties depends heavily on historical contingencies.
For the latter two cases, the question is whether the conditions that brought the movement parties to power also determined the key independent and dependent variables. Existing studies have attributed successful revolutions to causal factors such as economic downturn, political repression, and a favourable international environment (Foran Reference Foran1997; Goldstone Reference Goldstone2014). My theory would be proven wrong if these factors simultaneously determined post-revolutionary party strength and development outcomes. However, our knowledge of revolution suggests otherwise. First, even when conditions for revolutions are ripe, there is no guarantee that elites will resort to party-building to mobilize the masses. It is common for revolutionary actors to tap into other networks, such as worker's guilds and religious organizations. Thus, ‘there is no easy way to predict the form or direction that popular mobilization will take simply from structural factors’ (Goldstone Reference Goldstone2001, 152). Second, as shown in the Kenyan and Rwandan cases, it is uncertain whether the leaders of movement parties will continue to invest in party organizations or let the party atrophy (Collord Reference Collord2019; Morse Reference Morse2019). Finally, the governance outcomes in post-revolutionary societies are mixed and can hardly be explained by the structural causes of revolution. Instead, they are better seen as resulting from the institutions and policies put in place by the new government and the amount of international support it receives (Eckstein Reference Eckstein1982; Weede and Muller Reference Weede and Muller1997; Zimmermann Reference Zimmermann1990).
To sum up, while party origins are certainly not exogenous, their underlying causes do not determine the key variables in a way that makes my causal claim invalid. The primary causal role of party origins is not to determine the values of PIS or governance outcomes but to shape the rulers' incentives to deploy the PIS for governance improvement.
Conclusion
It is now common sense that authoritarian regimes should not be treated as a residual category – that is, simply the absence of democracy. A casual survey of the literature reveals a stark contrast between regimes led by strong parties and those without such organizational instruments. This study builds on previous works that examine how ruling party strength shapes a wide range of important outcomes but presents a more fine-grained causal account. First, it shows that the functions performed by party organizations depend on the historical legacies of power seizure. For movement parties, there exist mechanisms to reproduce the party-mass linkage during the post-seizure period. As a result, whether the ruling party can maintain a strong presence at the grassroots level becomes critical for public goods provision. Second, this study singles out party infrastructural strength among various party features as the most consequential for improving governance outcomes. The local branches and rank-and-file members are pivotal for information circulation and policy implementation. Despite the attention they received in the literature, other aspects of party strength, such as elite power-sharing and cohesion, matter less for governance.
These findings should not be regarded as rationalizations of party-led autocracies or any kind of ‘benign dictatorship’. While strong authoritarian parties may contribute to greater material well-being for citizens, they usually impose substantial restrictions on civil liberties and political rights to maintain power. These measures of authoritarian control are indisputably detrimental to all-around human development. My study does imply that regimes led by infrastructurally strong parties are likely to pose the greatest challenge to western democracy as a model of governance. The extensive infrastructure of mass mobilization allows these parties to develop a responsiveness and adaptability unmatched by other types of autocracies. Consequently, the above-average performance in governance increases the attractiveness of the ‘authoritarian social contract’ by which citizens are willing to give up political rights in exchange for material goods (Desai, Olofsgård, and Yousef Reference Desai, Olofsgård and Yousef2009; Feldmann and Mazepus Reference Feldmann and Mazepus2018). In an era when the ability of democracy to provide effective governance and deliver good outcomes is being seriously questioned (Diamond, Plattner, and Rice Reference Diamond, Plattner and Rice2015; Gandhi Reference Gandhi2019), one should not be surprised if autocracies find success in their global effort to discredit western democracy and promote their models and norms.
This article has several important implications for future research on authoritarian parties. First, while the V-party survey is careful in its design and aggregating procedures, it may still suffer from problems usually associated with expert-based measures: raters could interpret the same survey question differently or exhibit in-group bias in judging targets of interest (for example, Maestas Reference Maestas, Atkeson and Alvarez2018, 587). Using V-party measurement is a reasonable step to examine the question at hand, but future work can collect objective data such as party membership and the number of party branches to replicate my findings or explore other consequences of PIS.
Second, this article has shown the influence of bottom-up social movements over how ruling parties deploy their grassroots organizations, but it has not explained the variation within movement parties in terms of their ability to develop and maintain a strong party presence. Scholars have long noted that some nationalist parties experienced organizational decline soon after winning power (Bienen Reference Bienen, Huntington and Moore1970a, Reference Bienen1970b; Wallerstein Reference Wallerstein, La Palombara and Weiner1969). Future studies should investigate the domestic and international forces that enable movement parties to maintain vital organizations. Finally, while this study has corrected the past neglect of the welfare-enhancing role of PIS, it is not blind to the repressive and extractive functions of authoritarian parties. How do parties balance the roles of public service and repression? Is it possible that these roles are deeply intertwined in the authoritarian context? Does the mass-mobilizing experience of movement parties also give them an edge in repression and extraction? Answering these questions is important for better understanding the intellectual and political challenge posed by well-governed, well-organized one-party regimes.
Supplementary material
The supplementary material for this article can be found at: https://doi.org/10.1017/S0007123423000455.
Data availability statement
Replication Data for this article can be found in Harvard Dataverse at: https://doi.org/10.7910/DVN/7MYOFM.
Acknowledgements
I want to thank my student Liangyuan Zeng for providing invaluable research assistance. I also want to extend my gratitude to the following individuals for their feedback during presentations at Wujiaochang School's Conference, Nanjing University's Zhongshan Forum, and Fudan University's World Party Forum: Shiping Tang, Dingping Guo, Zhouwang Chen, Chao Chen, Lingling Qi, Qi Zhang, Vera Zuo, Yu Zheng, Xiao Ma, Chengyuan Ji, Min Tang, Zhenqian Huang, Zhengxu Wang, Feng Tang, and Zhenda Xie. Their comments have been instrumental in shaping my research and improving its quality. I am especially grateful to the anonymous reviewers for their encouraging and insightful comments that greatly improved my research.
Financial support
None.
Competing interests
None.