Implications
Measuring individual feed intake for dairy cows is expensive and difficult because it requires special equipment and has a high cost. Indirect selection based on moderate to strongly correlated indicators, such as conformation traits, could provide an alternative approach to improve individual animal feed utilisation. The results of this research indicated that residual feed intake, an efficiency trait, was moderately genetically correlated with five conformation traits. Combinations of these traits could be considered as indicators of residual feed intake for the genetic improvement of feed intake and utilisation in the dairy genetic evaluation programme.
Introduction
The relatively high cost of measuring individual feed intake is a primary limiting factor for genetic studies on feed efficiency and for implementing effective genetic improvement programmes for dairy feed utilisation (Hüttmann et al., Reference Hüttmann, Stamer, Junge, Thaller and Kalm2008; Tetens et al., Reference Tetens, Thaller and Krattenmacher2014; Connor, Reference Connor2014; Manzanilla Pech et al., Reference Manzanilla Pech, Verrkamp, Calus, Zom, van Knegsel, Pryce and De Hass2014). Selection based on indicator traits is an alternative approach to improve individual feed intake and utilisation. Indicator traits can be implemented in the selection index to improve the goal traits when data on primary breeding objectives, such as feed utilisation, are limited. Ideally, indicator trait(s) should be moderately to highly heritable, moderately to strongly genetically correlated with the traits of interest, relatively inexpensive and easy to record (Berry and Crowley, Reference Berry, Buckley, Dillon, Evan and Veerkamp2013; Manzanilla Pech et al., Reference Manzanilla Pech, Verrkamp, Calus, Zom, van Knegsel, Pryce and De Hass2014), as well as measurable early in life, specifically before selection decisions are made.
Conformation traits (first classification linear type traits) are heritable (Schaeffer, Reference Schaeffer1983; Miglior et al., Reference Miglior, Van Doormaal and Kistemaker2008), are routinely recorded in a dairy recording programme mostly during the animal’s first lactation, and are easily measurable at a low cost (Canadian Dairy Network, 2006). Researchers (Parke et al., Reference Parke, Kennedy, Dekkers, Moore and Jairah1999; Vallimont et al., Reference Vallimont, Dechow, Daubert, Dekleva, Blum, Barlieb, Liu, Varga, Heinrichs and Baumrucker2010; Berry and Crowley, Reference Berry, Buckley, Dillon, Evan and Veerkamp2013) are interested in using conformation traits as indicators, especially if these traits are correlated to feed intake and BW, and can therefore be used to improve feed efficiency. For example, genetic and phenotypic parameters among conformation traits with production and common measures of feed efficiency, including feed conversion ratio (FCR) and gross energy efficiency (GEE) in dairy cattle, have been estimated by Van Arendonk et al. (Reference Van Arendonk, Nieuwhof, Vos and Korver1991), Parke et al. (Reference Parke, Kennedy, Dekkers, Moore and Jairah1999) and Vallimont et al. (Reference Vallimont, Dechow, Daubert, Dekleva, Blum, Barlieb, Liu, Varga, Heinrichs and Baumrucker2010). These studies showed that combinations of several conformation traits, such as chest width and pin width, may be useful indicators of GEE, FCR and production traits. However, several researchers (Gunsett, Reference Gunsett1984; Kennedy et al., Reference Kennedy, Van der Werf and Meuwissen1993; Van der Werf et al., Reference Van der Werf2004) reviewed the challenges of selection on ratio traits such as FCR and GEE. In addition, Vallimont et al. (Reference Vallimont, Dechow, Daubert, Dekleva, Blum, Barlieb, Liu, Varga, Heinrichs and Baumrucker2011) concluded that estimated genetic parameters for FCR and GEE may be inflated during the lactation period because the contribution of energy from body tissue changes in early lactation is not taken into consideration. To address the problems associated with FCR and GEE, alternative efficiency measures have been proposed (Crews, Reference Crews2005). The proposed measures could effectively distinguish contributions from different energy sinks to increase the accuracy of evaluating feed intake (Crews, Reference Crews2005; Vallimont et al., Reference Vallimont, Dechow, Daubert, Dekleva, Blum, Barlieb, Liu, Varga, Heinrichs and Baumrucker2011; Connor, Reference Connor2014).
Residual feed intake (RFI) is an alternative measure for characterising feed efficiency (Koch et al., Reference Koch, Swiger, Chambers and Gregory1963) and is equivalent to a restricted selection index for decreased feed intake, holding other energy deposition constant (Kennedy et al.,Reference Kennedy, Van der Werf and Meuwissen1993; Van der Werf et al., Reference Van der Werf2004). However, RFI prediction still requires the records of individual feed intake, thereby limiting its application in the breeding programme of the dairy industry (Connor, Reference Connor2014). Identifying indicator traits, such as conformation traits, may increase the chances of adoption of feed utilisation improvement using RFI in multiple trait selection tools for industry-wide application (Berry and Crowley, Reference Berry, Buckley, Dillon, Evan and Veerkamp2013; Connor, Reference Connor2014). Recently published reports of parameters between RFI and conformation traits in dairy cattle are generally lacking. Moreover, RFI per se is phenotypically independent of production level, but (co)variances involving feed intake are needed to address the potential issues of long term correlated responses on other related economically important traits due to selection for RFI. The objective of this study was to estimate genetic and phenotypic parameters among intake, production, efficiency, and the selected conformation traits.
Material and methods
Data acquisition
A total of 496 repeated records from 260 individual Holstein dairy cows were used in this study from which 260, 159 and 77 of them were first, second and third lactation records, respectively. Individual daily feed intake was recorded from 5 (the first 4 days of colostrum milk were excluded) to 305 days in milk within each parity. BWs and body condition scores (BCS) of all animals were recorded at 5 day after calving and monthly from 5 to 305 days in milk when DHI milk sampled. Methodologies for collecting feed intake, BW and BCS are described in detail by Manafiazar et al. (Reference Manafiazar, McFadden, Goonewardene, Okine, Basarab, Li and Wang2013). On average, number of observations per cow for feed intake, BW, and BCS were 289, 8 and 8, respectively, over a 301 days lactation period. Data of each animal’s milk, fat and protein yield were retrieved from the official Dairy Herd Improvement (DHI) programme. The DHI programme collects individual milk yield and composition every 26 to 35 days in the morning and evening of the test day starting from 5 days after calving. Each animal has up to 10 daily milk yield and composition observations within a standard lactation period (305 days in milk). Daily observations and test day intervals are used to calculate the lactation yield to date. Then, the to-date yield and last test day yield are used to predict 305 days projected milk yield and composition. The last test day closest to 305 days provides the more accurate projected milk yield (Western Canadian Dairy Herd Improvement Services, 2015). In our study, the retrieved 301 days projected milk yield and composition data from DHI database had a minimum accuracy of 0.98 because a minimum of 250 days in milk was considered as the last test day.
Conformation traits (first lactation type classification) records for primiparous animals (n=260) were extracted from the Canadian Dairy Network database. Conformation traits are evaluated at a 7-month interval or ‘round’ and in most cases each animal is classified one time during its first lactation period (Canadian Dairy Network, 2006). A total of 29 conformation traits are available in the Canadian Dairy Network database from which 24 descriptive traits are recorded on a linear scale ranging from 1 to 9. Then, combinations of different recorded traits are used to derive an extra four composite traits, and these composite traits are used to calculate the overall conformation score (Canadian Dairy Network, 2006). This analysis included 10 descriptive traits out of 24 plus 5 composite traits that were potentially correlated with the RFI component traits (feed intake, BW, and milk production). The 10 selected linear classification traits were stature, height at front, chest width, angularity, body depth, udder depth, udder texture, rear attachment height, rear attachment width and pin width. The five composite (derived) traits were overall conformation, dairy strength, mammary system, rump, and feet and legs.
All procedures involving animals were reviewed and approved by the University of Alberta Animal Care & Use Committee, and all cows were cared for in accordance with the guideline of the Canadian Council on Animal Care (Olfert et al., Reference Olfert, Cross and McWilliam1993).
Data preparation
Intake traits
The individual daily dry matter intake was calculated by multiplying daily feed intake (offered minus refused) for each animal by the dry matter content (kg DM/kg as fed) of the diet, while daily actual energy intake was calculated multiplying individual daily dry matter intake by energy density of the diet. In the current study, it was proposed to calculate efficiency traits over the lactation period, with the objective to calculate dry matter intake and energy intake over 301 days of lactation for each animal. All animals had a minimum of 250 intake observations over 301 days. The daily missing values of dry matter intake and actual energy intake for each animal with >250 and <301 observations were predicted using the Legendre polynomial random regression model described by Manafiazar et al. (Reference Manafiazar, McFadden, Goonewardene, Okine, Basarab, Li and Wang2013). The daily dry matter intake and actual energy intake values over 301 days were summed to give the lactation dry matter intake (LDMI) and lactation actual energy intake (LAEI) for each animal, respectively.
Production traits
Milk yield and composition data obtained from the DHI database were used to derive 301 days total lactation 3.5% fat corrected milk (LFCM) (NRC, 2001) and lactation energy corrected milk (LECM) for 3.5% fat and 3.2% protein (Tyrrell, and Reid, Reference Tyrrell and Reid1965) over 301 days as:
 $$\eqalignno{ { {\rm LFCM}\,\left( {{\rm kg}} \right){\rm = [301 days}\,{\rm Milk}\,{\rm yield}\,\left( {{\rm kg}} \right){\rm ]}} \cr \qquad \quad\qquad {{\times}}\left[ {{\rm 0}{\rm .423{\plus} }{{\left( {{\rm 16}{\rm .216 {\times}Fat }\left( {\rm \,\%\,} \right)} \right)} \over {{\rm 100}}}} \right]{\rm ,} \cr & {\rm LECM}\,\left( {{\rm kg}} \right){\rm =[301 days}\,{\rm Milk}\,{\rm yield}\,\left( {{\rm kg}} \right){\rm ]} \cr \qquad \quad\qquad{{\times} }\left[ {\left( {{{\left( {{\rm 12}{\rm .82 {\times}Fat }\left( {\rm \,\%\,} \right)} \right)} \over {{\rm 100}}}} \right) } \right \cr \qquad \quad\qquad \left{\rm {\plus} }\left( {{{\left( {{\rm 7}{\rm .13 {\times}Protein }\left( {\rm \,\%\,} \right)} \right)} \over {{\rm 100}}}} \right){\rm {\plus}0}{\rm .323}} \right]. $$
Furthermore, average BW (ABW) and BCS (ABCS) within each parity were calculated for each animal over 301 days of lactation.
Feed efficiency traits
Lactation feed conversion ratio (LFCR), gross energy efficiency (LGEE), and RFI over 301 days were considered as lactation feed efficiency traits. Lactation feed conversion ratio was calculated as the ratio of LDMI to LFCM (Crews, Reference Crews2005), and LGEE was defined as the ratio of LECM to LAEI (Veerkamp and Emmans, Reference Veerkamp and Emmans1995). Based on the LFCR and LGEE definitions, efficient animals had lower LFCR but greater LGEE values. The individual lactation RFI within each lactation was calculated based on the methods described by Manafiazar et al. (Reference Manafiazar, McFadden, Goonewardene, Okine, Basarab, Li and Wang2013). In summary, individual daily actual dry matter intake and monthly BW of animals were recorded from 5 to 305 days in milk, and individual monthly milk yield and composition data were extracted from the DHI Programme. Individual daily dry matter intake and monthly milk yield and composition data were used to derive daily actual energy intake and monthly milk production energy requirement, respectively. Milk production energy requirement was considered as sum of the heat combustion of milk fat, protein and lactose. Moreover, individual monthly BW measurements were used to derive empty BW and metabolic BW. Empty BW was adjusted BW for gut fill using individual dry matter intake in test day and metabolisable energy density of the diet, and metabolic BW was calculated as BW to power of 0.75. In order to account for non-linear profile of the traits, one out of 25 fitted models using Legendre polynomial random regression consisted of fixed (F) and random (R) parts was selected based on log likelihood ratio test and Bayesian information criteria as the best model for each of the traits. The F5R3, F5R3 and F5R2 (subscripts indicate in the order fitted) models were selected for metabolic BW, milk production energy requirement and empty BW traits, respectively, and they were used to predict daily values for the traits. The predicted daily empty BWs were used to calculate daily empty BW change as the differences of two consecutive days over 301 days. Predicted daily values for each trait were summed to calculate the total for that traits over 301 days. Finally, the individual total of 301 days actual energy intake was linearly regressed on a total of 301 days estimated traits of metabolic BW, milk production energy requirement, and empty BW change to obtain the individual RFI over 301 days. The daily average lactation RFI was obtained by dividing the total lactation RFI by days in record for each animal (Manafiazar et al., Reference Manafiazar, McFadden, Goonewardene, Okine, Basarab, Li and Wang2013). In this study, individual RFI over 301 days was calculated, but RFI also could be calculated across a relatively short period, such as weekly; however, Manafiazar et al. (Reference Manafiazar, McFadden, Goonewardene, Okine, Basarab, Li and Wang2013) described and noted that predicted weekly RFI and then summed weekly RFIs over 301 days had almost identical results with correlation of 0.97 and same animal ranking.
Parameter estimation
A mixed model was implemented using ASREML-W software (Gilmour et al., Reference Gilmour, Gogel, Cullis and Thompson2006) to determine significant fixed effects on each of the derived intake, production, efficiency and selected conformation traits. The significant (P<0.10) fixed factors that remained in the model were as follows: overall mean for each trait; year×month, parity and calving age for LDMI and LAEI; total days in milk, year×month, parity and calving age for LFCM, LECM, LFCR and LGEE; days in record and parity for RFI; number of observations and parity for ABW and ABCS; and round and stage of lactation for conformation traits. The stage of lactation was coded in ~30 days intervals starting from calving (Canadian Dairy Network, 2006). Serial pair-wise bivariate animal models were used to estimate heritabilities and phenotypic and genetic correlations for all traits considered in this analysis. The heritability estimate and its associated standard error of estimation for each trait were the average of pair-wised estimates for the same traits in all bivariate models involved in the analyses. Fixed effects were specified for each trait as described above, and random effects were animal additive genetic effect and residual error in the pair-wise models, as well as permanent environment effect specified for traits with repeated records. The additive genetic relationship matrix was constructed based on the pedigree file containing 20 397 animals in which their ancestry was traced back to as many as 47 generations. Initial variance components for the pair-wise bivariate models were obtained from univariate analyses.
Results and discussion
Descriptive statistics
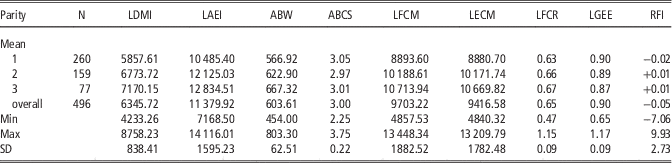
Descriptive statistics for intake, production, and efficiency traits are shown in Table 1. Daily average of LFCM, LDMI, LAEI and ABW were 32.2 (kg), 21.08 (kg), 37.8 (Mcal) and 603.28 (kg), respectively. The greater average LFCM and LDMI in this study compared to other Canadian studies (Moore et al., Reference Moore, Kennedy, Schaeffer and Moxley1990; Parke et al., Reference Parke, Kennedy, Dekkers, Moore and Jairah1999) could be attributed to infrequent measurement (once per month) in this study and genetic and management improvements in the last 23 years. This discrepancy at least partially supported by the 104 kg/cow per day increase in milk production from 1991 to 2013 in Holsteins by Dairy Herd Improvement Program (2013). It may also be inferred that Canadian dairy cattle are under intense selection for milk, fat, and protein production (Parke et al., Reference Parke, Kennedy, Dekkers, Moore and Jairah1999), similar to genetic trends reported in the United States and other countries outside North America.
Descriptive statistics for intake, production, and efficiency traits of dairy cows during lactation (301 days)

LDMI=lactation dry matter intake over 301 days (kg); LAEI=lactation actual energy intake over 301 days (Mcal /kg); ABW=average BW over 301 days (kg); ABCS=average body condition score over 301 days; LFCM=lactation fat corrected milk over 301 days (kg); LECM=lactation energy corrected milk over 301 days (kg): LFCR=lactation feed conversion ratio over 301 days: LDMI/LFCM; LGEE=lactation gross energy efficiency over 301 days: LECM/LAEI; RFI=average residual feed intake over 301 days (Mcal/day); SD=standard deviation.
In addition, primiparous animals consumed less feed, produced less milk, and had lower ABW than multiparous cows, but they had better average feed efficiency (lesser LFCR and greater LGEE) results which were comparable to results reported by Spurlock et al. (Reference Spurlock, Dekkers, Fernando, Koltes and Wolc2012). However, the average of LGEE across parities was greater (0.90 v. 0.75) than that reported by Parke et al. (Reference Parke, Kennedy, Dekkers, Moore and Jairah1999). This increase could be attributed to the relatively greater milk yield in the current study compared with previous studies. Greater milk yield dilutes the maintenance requirements, and generates positive auto-correlation between milk production and feed efficiency measures (LGEE and LFCR).
All of the linear conformation traits had a scale of 1 to 9, while all the composite traits had a different range. The overall conformation ranged from 640 to 840, and mammary system ranged from 40 to 85; the dairy strength and rump ranged from 46 to 90 and from 50 to 88, respectively. All the ranges were similar to the previously reported ranges on conformation traits in dairy cows (Canadian Dairy Network, 2006; Miglior et al., Reference Miglior, Van Doormaal and Kistemaker2008).
Heritabilities
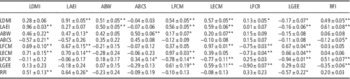
Average estimated heritabilities and their associated standard errors generated from bivariate analyses for intake, production, and efficiency traits are reported on the diagonal of Table 2. Heritability for LAEI (0.27±0.07) was >0.21 reported by Parke et al. (Reference Parke, Kennedy, Dekkers, Moore and Jairah1999) and 0.18 reported by Vallimont et al. (Reference Vallimont, Dechow, Daubert, Dekleva, Blum, Barlieb, Liu, Varga, Heinrichs and Baumrucker2010). The relatively greater heritability estimates for intake traits in the current study may reflect the accuracy of individual feed intake measurements, or it may be due to the sampling variance attributable to the present population size and numbers of records.
Heritabilities (diagonal), phenotypic (upper diagonal) and genetic correlations (below diagonal) among intake, production and efficiency traits (±SE) in dairy cattle

LDMI=lactation dry matter intake over 301 days (kg); LAEI=lactation actual energy intake over 301 days (Mcal); ABW=average BW over 301 days (kg); ABCS=average body condition score over 301 days; LFCM=lactation fat corrected milk over 301 days (kg); LECM=lactation energy corrected milk over 301 days (kg); LFCR=lactation feed conversion ratio over 301 days: LDMI/LFCM; LGEE=lactation gross energy efficiency over 301 days: LECM/LAEI; RFI=average residual feed intake over 301 days (Mcal/day).
Diagonal elements are average of heritability estimations from bivariate analysis, and all were significant at P<0.01.
**Statistically significant at P<0.01; *statistically significant at P<0.05.
Estimated heritability for LFCM was similar (0.37±0.05) to that reported in previous studies (0.33) by Lee et al. (Reference Lee, Batra, Roy, Veselys, Nadarajah, Boichard, McAllister and Lin1992) and Parke et al. (Reference Parke, Kennedy, Dekkers, Moore and Jairah1999), but lower than 0.46 reported by Manzanilla Pech et al. (Reference Manzanilla Pech, Verrkamp, Calus, Zom, van Knegsel, Pryce and De Hass2014). In the literature, wide ranges of heritability estimates have been reported for BW (0.23 to 0.60) and BCS (0.08 to 0.60), which varied with stage of lactation (Moore et al., Reference Moore, Kennedy, Schaeffer and Moxley1990; Bewley and Schutz, 2008; Vallimont et al., Reference Vallimont, Dechow, Daubert, Dekleva, Blum, Barlieb, Liu, Varga, Heinrichs and Baumrucker2010), and our estimates were within the range of previous estimates. Difference between our results and those available in the literature may be due to the average of BW and BCS over the 301 days lactation period being used in our study, rather than within a specific time period used in previous studies. It has also been reported that the heritability estimates of averaged over monthly intervals were greater than daily estimates (Spurlock et al., Reference Spurlock, Dekkers, Fernando, Koltes and Wolc2012).
Estimated heritability for LFCR (0.25±0.03) in this study was similar to that reported by Parke et al. (Reference Parke, Kennedy, Dekkers, Moore and Jairah1999) who also calculated LFCR over 305 days of lactation. However, the estimate of LGEE was lower (0.29 v. 0.38) than that reported by Van Arendonk et al. (Reference Van Arendonk, Nieuwhof, Vos and Korver1991), whose study was restricted to the first 15 weeks of lactation rather than over 301 days. This difference could be due to the length of the study period (105 v. 301 days), since a range of 0.12 to 0.63 was reported in the literature for feed efficiency traits (FCR and GEE) depending on the stage of lactation (Parke et al., Reference Parke, Kennedy, Dekkers, Moore and Jairah1999). Estimated heritability for RFI over 301 days (0.20±0.03) was similar (0.21) to that reported by Van Arendonk et al. (Reference Van Arendonk, Nieuwhof, Vos and Korver1991) for the first 105 days of lactation, but it was different from the result of Connor et al. (Reference Connor, Hutchison, Norman, Olson, Tassell Van, Leith and Baldwin2013) at 0.36 during 90 days of early lactation, Vallimont et al. (Reference Vallimont, Dechow, Daubert, Dekleva, Blum, Barlieb, Liu, Varga, Heinrichs and Baumrucker2011) at 0.07 over 305 days of lactation, and pooled estimates of 0.04 reported by Berry and Crowley (Reference Berry, Buckley, Dillon, Evan and Veerkamp2013). The discrepancies between our results with those of Vallimont et al. (Reference Vallimont, Dechow, Daubert, Dekleva, Blum, Barlieb, Liu, Varga, Heinrichs and Baumrucker2011) may be due to frequency of feed intake data where our study measured daily feed intake data on each animal over 301 days and Vallimont et al. (Reference Vallimont, Dechow, Daubert, Dekleva, Blum, Barlieb, Liu, Varga, Heinrichs and Baumrucker2011) measured feed intake six times over 305 days during lactation. Vallimont et al. (Reference Vallimont, Dechow, Daubert, Dekleva, Blum, Barlieb, Liu, Varga, Heinrichs and Baumrucker2011) have concluded that their method of feed intake measurement was not sensitive enough to capture the difference among the animals in their study. Moreover, the difference between our result with Connor et al. (Reference Connor, Hutchison, Norman, Olson, Tassell Van, Leith and Baldwin2013) could be due to differences in test length (90 v. 301), feed intake data collection methods (automated v. manual), BW and BCS data collection intervals (almost 2 weeks v. 4 weeks), and other management procedures. However, these results altogether suggest that feed efficiency and of particular interest RFI in dairy cattle could be improved through genetic selection.
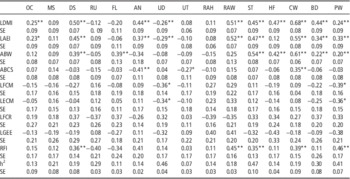
Estimated heritabilities for conformation traits are presented in Table 3 and ranged from 0.07 for udder texture to 0.47 for stature. Overall, most of the heritability estimates for the conformation traits considered in this study were greater than those reported by Schaeffer (Reference Schaeffer1983), but comparatively lower than those reported by the Canadian Dairy Network (2007) although the ranking of the estimates by magnitude was similar.
Genetic correlations between conformation traits and intake, production, and efficiency in dairy cattle

LDMI=lactation dry matter intake over 301 days (kg); LAEI=lactation actual energy intake over 301 days (Mcal); ABW=average BW over 301 days (kg); ABCS=average body condition score over 301 days; LFCM=lactation fat corrected milk over 301 days (kg); LECM=lactation energy corrected milk over 301 days (kg); LFCR=lactation feed conversion ratio over 301 days: LDMI/LFCM; LGEE=lactation gross energy efficiency over 301 days: LECM/LAEI; RFI=average residual feed intake over 301 days (Mcal/day); OC=overall conformation; MS=mammary system; DS=dairy strength; RU=rump; FL=feet and LEGS; AN=angularity; UD=udder depth; UT=udder texture; RAH=rear attachment height; RAW=rear attachment width; ST=stature; HF=high at front; CW=chest width; BD=body depth; PW=pin width; SE=Standard error.
**Statistically significant at P<0.01; *statistically significant at P<0.05.
Correlations among intake, production, and efficiency traits
Phenotypic (upper diagonal) and genetic (below diagonal) correlations of production and efficiency traits along with their standard errors are shown in Table 2. It is noteworthy that in some cases standard errors associated with genetic correlation estimates in this study were comparable in magnitude to the correlation estimates themselves, reflecting relatively small numbers of animals used in this study due to limited individual feed intake records available. Greater standard error of estimation, due to limited sample size, causes the genetic correlation not to differ significantly from zero, although their magnitude was greater than zero (Hüttmann et al., Reference Hüttmann, Stamer, Junge, Thaller and Kalm2008; Spurlock et al., Reference Spurlock, Dekkers, Fernando, Koltes and Wolc2012). Falconer and Mackay (Reference Falconer and Mackay1996) proposed an equation to calculate the standard error of genetic correlations when the sample size is limited, which is a function of the traits heritabilities, estimates’ standard error, and the additive genetic covariance between the traits. We also computed and compared the standard errors of genetic correlations by using Falconer and Mackay (Reference Falconer and Mackay1996) equation, and in all cases the equation yielded slightly lower standard errors compared to the ASREML estimates. However, in order to avoid any possible type I error due to the reduced standard error, we present the resulting estimates from ASREML software. Although we presented all phenotypic and genetic correlation estimates in Tables 3 and 4 for completeness, only the significant (P<0.05) correlation coefficients are discussed here, except for RFI with production traits. In addition, as expected, LDMI with LAEI, LFCM with LECM, and LFCR with LGEE had genetic and phenotypic correlations that were greater than 0.90 or lower than −0.90. Traits with strong phenotypic and genetic correlations, generally 0.90 or −0.9, could be considered genetically equivalent, such that the two traits could share nearly equivalent genetic control and/or an extensive part-whole relationship (Crews et al., Reference Crews, Shannon, Genwein, Crews, Johnson and Kendrick2003). Therefore, among the strongly correlated traits, LDMI, LFCM and LFCR were considered phenotypically and genetically similar to LAEI, LECM and LGEE, respectively, and their association with production, efficiency and conformation traits were discussed hereafter.
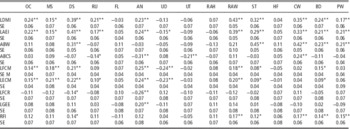
Phenotypic correlations between conformation traits and intake, production, and efficiency in dairy cattle

LDMI=lactation dry matter intake over 301 days (kg); LAEI=lactation actual energy intake over 301 days (Mcal); ABW=average BW over 301 days (kg); ABCS=average body condition score over 301 days; LFCM=lactation fat corrected milk over 301 days (kg); LECM=lactation energy corrected milk over 301 days (kg); LFCR=lactation feed conversion ratio over 301 days: LDMI/LFCM; LGEE=lactation gross energy efficiency over 301 days: LECM/LAEI; RFI=average residual feed intake over 301 days (Mcal/day); OC=overall conformation; MS=mammary system; DS=dairy strength; RU=rump; FL=feet and legs; AN=angularity; UD=udder depth; UT=udder texture; RAH=rear attachment height; RAW=rear attachment width; ST=stature; HF=height at front; CW=chest width; BD=body depth; PW=pin width; SE=standard error.
**Statistically significant at P<0.01; *statistically significant at P<0.05.
There were strong (P<0.05) positive phenotypic (0.54) and genetic (0.69) correlations between LDMI and LFCM, and they were comparable to estimates reported by Van Arendonk et al. (Reference Van Arendonk, Nieuwhof, Vos and Korver1991) and Vallimont et al. (Reference Vallimont, Dechow, Daubert, Dekleva, Blum, Barlieb, Liu, Varga, Heinrichs and Baumrucker2010), implying that strong additive genetic correlation exits between dry matter intake and milk yield (Hüttmann et al., Reference Hüttmann, Stamer, Junge, Thaller and Kalm2008; Spurlock et al., Reference Spurlock, Dekkers, Fernando, Koltes and Wolc2012). Lactation dry matter intake and ABW were phenotypically (0.51) and genetically (0.46) correlated (P<0.05), and the correlation estimates were similar to those reported in other studies (Van Arendonk et al., Reference Van Arendonk, Nieuwhof, Vos and Korver1991; Vallimont et al., Reference Vallimont, Dechow, Daubert, Dekleva, Blum, Barlieb, Liu, Varga, Heinrichs and Baumrucker2010), indicating that animals with greater BW consume more feed. In the present study, LFCM had a positive phenotypic correlation (0.17) with ABW. However, a wide range of genetic correlations (−0.42 to 0.48) between LFCM and BW were reported in the literature (Veerkamp and Emmans, Reference Veerkamp and Emmans1995; Parke et al., Reference Parke, Kennedy, Dekkers, Moore and Jairah1999; Vallimont et al., Reference Vallimont, Dechow, Daubert, Dekleva, Blum, Barlieb, Liu, Varga, Heinrichs and Baumrucker2010; Manafiazar et al., Reference Manafiazar, McFadden, Goonewardene, Okine and Wang2012). These results all together indicate that large cows may not necessarily produce more milk, and this conclusion is supported by VandeHaar (Reference VandeHaar1998), whose results suggested an optimum point of relationship exists between milk production and BW.
Average body condition score had negative (−0.57) and positive (0.34) genetic correlations (P<0.05) with LDMI and LFCR, respectively, and it had positive (0.50) phenotypic correlation (P<0.05) with ABW. These results were not in agreement with Vallimont et al. (Reference Vallimont, Dechow, Daubert, Dekleva, Blum, Barlieb, Liu, Varga, Heinrichs and Baumrucker2010), who reported genetic correlations of 0.29 and −0.33 between standardised 305 days BCS with dry matter intake and FCM, respectively. The inconsistency of our results with those of Vallimont et al. (Reference Vallimont, Dechow, Daubert, Dekleva, Blum, Barlieb, Liu, Varga, Heinrichs and Baumrucker2010) may be because we used an average BCS over 301 days, rather than analysing standardised 305 days BCS and having different data collection frequency. The positive correlation between ABCS and LFCR in our study suggests that on average, losing BCS may be accompanied with an improvement (decrease) in LFCR. This improvement is supported in a review by Bewley and Schutz (Reference Bewley and Schutz2008) who summarised that losing one unit of BCS would increase milk production by around 2000 kg over a 305 days lactation period, and increase LGEE by 1.5 % (Manafiazar et al., Reference Manafiazar, McFadden, Goonewardene, Okine and Wang2012). However, improved LFCR could also be a drawback due to animal losing BCS to support milk production, possibly causing health and reproductive related issues in the animals (Vallimont et al., Reference Vallimont, Dechow, Daubert, Dekleva, Blum, Barlieb, Liu, Varga, Heinrichs and Baumrucker2010; Spurlock et al., Reference Spurlock, Dekkers, Fernando, Koltes and Wolc2012). Therefore, an alternative measure of efficiency, RFI, has been proposed to minimise the correlated response of selection for efficiency on BCS and energy balance (Spurlock et al., Reference Spurlock, Dekkers, Fernando, Koltes and Wolc2012; Connor, Reference Connor2014). However, ABCS had a favourable significant (P<0.05) phenotypic correlation (−0.12) with RFI, which implies efficient animals may increase their BCS, and this could be considered as an advantage of selection for RFI to overcome any concerns related to efficiency, health, and reproduction. More research in this regard focussed on different stages of lactation is encouraged.
Although LFCR did not have significant correlations with LDMI and ABW, it had significant phenotypic (−0.75) and genetic (−0.78) correlations with LFCM (Table 2). Our results suggested that LFCR was most likely influenced by production (LFCM) rather than by intake (LDMI), which is also supported by the results reported by Parke et al. (1999) and Spurlock et al. (Reference Spurlock, Dekkers, Fernando, Koltes and Wolc2012). The above mentioned results indicated that phenotypically and genetically, LFCR would favour the animals with reduced BW to support her milk production, and selection for FCR would not necessarily improve feed efficiency and utilisation (Manafiazar et al., Reference Manafiazar, McFadden, Goonewardene, Okine and Wang2012).
RFI, however, had strong (P<0.05) positive genetic (0.51) and phenotypic (0.49) correlations with LDMI, which is supported by reports from other dairy researchers (Van Arendonk et al., Reference Van Arendonk, Nieuwhof, Vos and Korver1991; Vallimont et al., Reference Vallimont, Dechow, Daubert, Dekleva, Blum, Barlieb, Liu, Varga, Heinrichs and Baumrucker2011). Phenotypic and genetic correlations of RFI with LFCM and ABW were near zero or were not different from zero. Van Arendonk et al. (Reference Van Arendonk, Nieuwhof, Vos and Korver1991) also reported near zero genetic and phenotypic correlations of RFI with both BW and FCM over 105 test day. Phenotypic correlations were expected from the nature of the RFI calculation. However, the genetic correlations results of RFI with ABW and LFCM should be interpreted with caution and warrant further investigations since their magnitudes were large but were not differed from zero due to a large standard error of estimations. The reasons for possible genetic correlations between RFI and production traits have been explained elsewhere by Kennedy et al. (Reference Kennedy, Van der Werf and Meuwissen1993) and Crews (Reference Crews2005). Kennedy et al. (Reference Kennedy, Van der Werf and Meuwissen1993) showed that RFI is by definition phenotypically independent of its component traits, but can have a non-zero genetic correlation with production. Subsequently, they proposed an alternative RFI prediction method that utilise genetic information with the resulting metric termed genetic RFI (RFIg). RFIg, per se, is genetically independent of the production traits, an attribute which has been further discussed by others (Crews, Reference Crews2005). Therefore, RFIg may provide breeders with a tool to selection for efficient animals without compromising their production level (Kennedy et al., Reference Kennedy, Van der Werf and Meuwissen1993). Further investigations are encouraged to calculate RFIg and its potential correlations with other traits.
Correlations of intake, production and efficiency with conformation traits
Genetic and phenotypic correlations between the 15 selected conformation traits and intake, production and efficiency traits are presented in Tables 3 and 4, respectively. Lactation dry matter intake had significant (P<0.05) moderate to strong genetic correlations with pin width, overall conformation, udder depth, body depth, angularity, stature, height at front, dairy strength, rear attachment width and chest width, and ranged from 0.24 to 0.68 (Table 3). A similar trend was observed for phenotypic correlations (Table 4). Berry and Crowley (Reference Berry, Buckley, Dillon, Evan and Veerkamp2013) included chest width and stature in a selection index to predict mature cow feed intake, and they showed that proportion of feed intake genetic variance increased from 0.45 to 0.89 compared to the index containing milk yield and BW. These correlations imply that combinations of most conformation traits could potentially be used as indicator traits for LDMI.
Average BW had significant (P<0.05) moderate to high positive genetic (Table 3) and phenotypic (Table 4) correlations with dairy strength and its component (stature, chest width and body depth) traits. These results were comparable with those reported for similar traits in previous studies (Parke et al., Reference Parke, Kennedy, Dekkers, Moore and Jairah1999; Berry et al., Reference Berry and Crowley2004; Vallimont et al., Reference Vallimont, Dechow, Daubert, Dekleva, Blum, Barlieb, Liu, Varga, Heinrichs and Baumrucker2010), and these results suggest the potential for using dairy strength and its component traits to predict phenotypic and genetic variability of BW in dairy cattle
There were significant (P<0.05) moderate negative genetic and phenotypic correlations between ABCS with angularity, udder texture, and positive genetic and phenotypic correlations with chest width (Tables 3 and 4). Angularity and udder texture are traits related to the mammary system and ultimate capacity of milk production, while chest width is a trait related to body size and BW (Canadian Dairy Network, 2006). These correlations showed that animals with greater score of mammary systems tend to lose ABCS, and animals with greater score of chest width tend to have greater ABCS. This correlation confirms our earlier conclusion on relationships between LFCM, ABW and ABCS.
The LFCM was significantly (P<0.05) genetically correlated only with udder depth and pin width (Table 3), but significant (P<0.05) phenotypic correlations existed with several conformation traits ranging from −0.24 to 0.25 (Table 4), including mammary system and its component traits. Short and Lawlor (Reference Short and Lawlor1992) reported similar phenotypic and genetic correlations between milk yield and the conformation traits of stature, body depth, udder depth and overall conformation.
The LFCR was only significantly phenotypically correlated with angularity (−0.26) and dairy strength (−0.14) (Table 4). LFCR (and LGEE) did not show significant genetic correlations with LDMI and most of the conformation traits. Therefore, we are not in a position to suggest any indicator traits for LFCR and similarly for LGEE from the studied conformation traits.
The RFI was significantly (P<0.05) phenotypically correlated with dairy strength, stature, chest width, rear attachment width, body depth, and pin width ranging from 0.12 to 0.17 (Table 4). Further, RFI had significant (P<0.05) moderate to strong positive genetic correlations ranging from 0.35 to 0.46 with stature, dairy strength, chest width, rear attachment width, and pin width (Table 3). Combinations of these traits may be considered as a useful indicator trait to improve RFI through indirect selection. These traits except rear attachment width are related to body size, and their correlation with RFI implies that animals with high RFI (inefficient) tend to have greater body size. This finding is, partially, counter to our earlier results on the non-significant correlation between RFI with ABW, which implies RFI is independent of BW. This contradiction may results because RFI was directly adjusted for BW but not for body size or conformation traits. However, this contradictory aspect requires further investigation as we discussed earlier. This study attempted to determine the correlation between RFI and various conformation and production traits in dairy cattle where published data are currently unavailable. Thus, we cannot yet offer an extensive direct comparison of the results of this study with other work. Some of the genetic correlations in the current research were associated with a large standard error of estimations, which were caused by relatively smaller sample size (n=496) and family size (n=2.16) limited by individual feed intake data available. A smaller family size means lower genetic connectedness between the animals which reduces additive genetic variance and yields larger standard error of estimations. However, further investigations are encouraged by sharing the data to create a larger sample size to reduce the standard error of estimations, which would consequently validate the results of this study.
Conclusion
Results indicated that RFI was moderately heritable and, as expected, largely reflects the (co)variance structure among component traits. Therefore, there is potential to develop selection tools to improve feed utilisation in dairy cattle using feed intake. Five conformation traits (stature, dairy strength, chest width, rear attachment width, and pin width) had significant moderate to strong genetic correlations with RFI. Their combination may provide useful indicators of RFI in the genetic improvement of feed efficiency in dairy breeding programmes to overcome difficulties and costs associated with recording individual feed intake. It should be noted that RFI had near zero phenotypic correlations with production traits as expected, while having potentially non-zero genetic correlations with production traits. Therefore, animal selection based on phenotypic RFI may raise concerns in a long term response to direct selection, especially with regard to production traits. Future research should focus on using directly economic important dairy traits or their indicators to develop breeding objectives to improve overall profitability with increased selection accuracy.
Acknowledgements
The authors are greatly thankful for the experimental support from the staff at the Dairy Research and Technology Centre (DRTC) of the University of Alberta, especially Dr. Reza Khorasani, the DRTC manager, and Harold Lehman, a senior DRTC technician. The financial support from the Natural Science and Engineering Research Council of Canada (NSERC) and the Canadian Dairy Network (CDN) is also highly appreciated.