Introduction
Biology, as well as its application in many fields, such as agriculture, forestry, human and veterinary medicine, relies heavily on the accurate identification of species, the basic units in the hierarchy of nature. For more than 250 years of modern taxonomic activity, the number of known species has been continuously increasing, and our knowledge of biodiversity is far from being complete. There are vast arrays of morphologically similar species, which are often so small in dimensions as to render establishing the species identity within many groups a difficult task. Insects are undoubtedly one of the most prolific of these groups. Their identification usually requires significant experience, encyclopaedic knowledge, a good reference collection and relevant literature. The process of becoming expert in a group is mostly pain-staking and time-consuming and the numbers of available taxonomists are limited for many groups and zoogeographical regions (Gaston & May, Reference Gaston and May1992).
Partly to compensate for the lack of expertise, several approaches have been proposed to simplify, particularly, routine identification in applied branches of entomology. Besides molecular diagnostic techniques, which are currently becoming more and more widespread, the rapid progress in information technology has also opened opportunities for the development of computer-assisted taxonomy (Edwards & Morse, Reference Edwards and Morse1995; Chesmore, Reference Chesmore1999). Computer-aided taxonomic applications can range from interactive multi-access taxonomic keys, distributed, for example, on CD-ROM (Cranston, Reference Cranston2005), to nearly fully automated identification systems (e.g. Weeks et al., Reference Weeks, Gauld, Gaston and O'Neill1997, Reference Weeks, O'Neill, Gaston and Gauld1999; Platnick et al., Reference Platnick, Russell and Do2005). During the past ten years, artificial neural networks (ANN) seem to have been one of the most promising computing tools for the basis of such systems (Weeks & Gaston, Reference Weeks and Gaston1997). Analogous to the structure of the human brain, the advantages of ANN include an ability to learn from examples and to generalize observed patterns. Compared to many traditional statistical methods, ANN are non-linear and make no general assumptions on the type or statistical distribution of data; and, thus, can be used for pattern recognition on practically any kind of multivariate data sets – transformed digital images (Do et al., Reference Do, Harp and Norris1999), optically sensed wing beat frequency spectra (Moore & Miller, Reference Moore and Miller2002), near-infrared reflectance spectra (Aldrich et al., Reference Aldrich, Magirang, Dowell and Kambhampati2007), bioacoustic recordings (e.g. Chesmore, Reference Chesmore2004), chemotaxonomy (Hernández-Borges et al., Reference Hernández-Borges, Corbella-Tena, Rodriguez-Delgado, Garcia-Montelongo and Havel2004) or morphometry (Marcondes & Borges, Reference Marcondes and Borges2000; Vaňhara et al., Reference Vaňhara, Muráriková, Malenovský and Havel2007). Although the results from most case studies are very convincing, the practical use of ANN for species identification in current biology is still rather infrequent (Gaston & O'Neill, Reference Gaston and O'Neill2004).
Thrips (Thysanoptera) represent an order of tiny (usually 1–3 mm) insects with about 5500 species worldwide (Mound, Reference Mound, Marullo and Mound2001). Some phytophagous species are regarded as pests in agriculture, horticulture and forestry, as their feeding on plants which are economically important can cause damage, accompanied by symptoms such as silvering, leaf deformation, colour changes and scarring. Moreover, a limited number of thrips species are vectors of destructive tospoviruses, which can infect a wide range of host plants (Lewis, Reference Lewis1997; Jones, Reference Jones2005). The correct identification down to species level is often needed to effectively control populations of such pests. This identification is, however, at times difficult because of their minute size and close morphological similarity.
Thrips can be identified in several ways. Printed dichotomous taxonomic keys (e.g. Schliephake & Klimt, Reference Schliephake and Klimt1979; zur Strassen, Reference zur Strassen2003 for European species) are the traditional methods, which often allow the identification of entire regional thrips faunas. However, their use is often not straightforward for inexperienced biologists. The work, of applied entomologists, has been facilitated by the introduction of more user-friendly pictorial keys (Mound & Kibby, Reference Mound and Kibby1998) and, for Thysanoptera of economic importance, computerized multi-access keys (Moritz et al., Reference Moritz, Morris and Mound2001). Genetic markers have proved to be a powerful tool in the identification of thrips pest species, including their immature stages (Moritz et al., Reference Moritz, Delker, Paulsen, Mound and Burgermeister2000; Brunner et al., Reference Brunner, Fleming and Frey2002; Toda & Komazaki, Reference Toda and Komazaki2002; Rugman-Jones et al., Reference Rugman-Jones, Hoddle, Mound and Stouthamer2006). The interactive electronic key by Moritz et al. (Reference Moritz, Mound, Morris and Goldarazena2004) combines both morphological and molecular information.
In our laboratories, we have recently demonstrated the successful use of ANN for the identification of parasitic flies (Diptera: Tachinidae) (Vaňhara et al., Reference Vaňhara, Muráriková, Malenovský and Havel2007). The aim of this paper is to examine further the potential use of ANN for the rather complicated task of Thysanoptera identification.
Material and methods
Selection of taxa
For our analysis, we selected 18 Thysanoptera species from four genera, i.e. Aeolothrips Haliday (Aeolothripidae), Chirothrips Haliday, Dendrothrips Uzel and Limothrips Haliday (all Thripidae). They represent common European species which are widely distributed (zur Strassen, Reference zur Strassen2005) and occur in a wide range of environmental conditions. Some species of Aeolothrips (A. fasciatus, A. intermedius) are predators feeding on mites or other thrips. Dendrothrips spp. live on leaves of trees or shrubs, whereas Chirothrips and Limothrips spp. are grass-feeders (Schliephake & Klimt, Reference Schliephake and Klimt1979). L. cerealium (the grain thrips) and L. denticornis (the barley thrips) attack cereals and can cause serious grain losses (e.g. Franssen & Mantel, Reference Franssen and Mantel1965; Larsson, Reference Larsson2005).
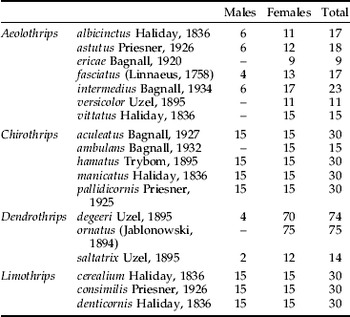
In total, we included 498 specimens in our study. Individual species were represented in the data set by 9–75 specimens of both sexes, except for Aeolothrips ericae, A. versicolor, A. vittatus, Chirothrips ambulans and Dendrothrips ornatus for which only females were available to us (table 1). In many thrips species, it is the females that are more prevalent; males being more rarely found or absent. This is because the females are haplo-diploid, usually live longer than the males (e.g. they are often the only sex to overwinter) and some species or regional populations reproduce parthenogenetically (Lewis, Reference Lewis1973). The material was collected from various localities in Slovakia, Poland and the Czech Republic during several projects (e.g. Fedor et al., Reference Fedor, Pelikán, Cyprich and Krumpál2001; Pelikán et al., Reference Pelikán, Fedor, Krumpál and Cyprich2002).
List of examined Thysanoptera specimens.

Standard preparatory techniques were used for mounting; specimens were collected into AGA (a mixture of ethylalcohol, glycerine and acetic acid), macerated in warm 10% KOH, dehydrated in alcohol and clove oil and mounted on slides in Canada balsam.
The material was identified by P. Fedor and W. Sierka and is deposited in their collections (Comenius University Bratislava, University of Silesia Katowice).
Selection of characters
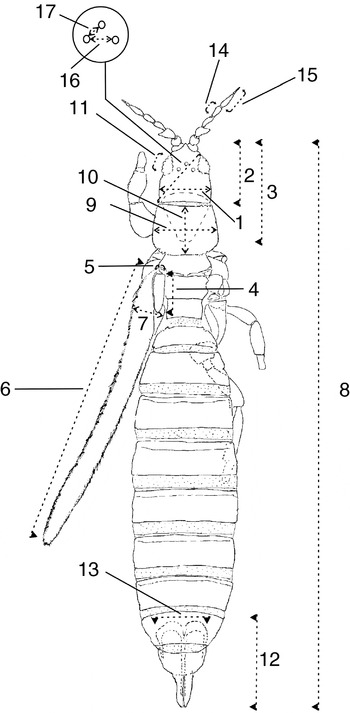
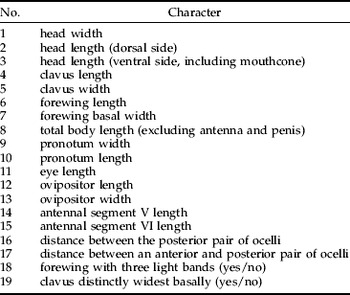
We defined and recorded a total of 25 characters in at least one thrips genus. For further analysis, we avoided missing data and retained 19 characters, which were measured or determined for each specimen of the taxa (table 2). These included 17 quantitative morphometric characters on different parts of the thrips body (fig. 1) and two qualitative two-state characters (presence/absence). Most of the selected characters are commonly used for thrips identification (e.g. zur Strassen, Reference zur Strassen2003).
Morphometric characters (1–17) used for thrips identification (explanation in table 2).

List of characters used for thrips identification.

Quantitative characters were measured as linear distances on digital images taken from slide mounted specimens by P. Fedor and W. Sierka using the microscope NIKON ECLIPSE E600 and the image analyser software LUCIA net (Laboratory Imaging Ltd, Czech Republic). Experimental uncertainty of these measurements for the digital images was maximally 0.03 μm.
Many species of Thysanoptera exhibit a pronounced sexual dimorphism. Males of all the studied Chirothrips and Limothrips species are extremely brachypterous or apterous (this pertains also to the females of C. ambulans and both sexes of Aeolothrips albicinctus) and lack ocelli. The data corresponding to missing forewings and ocelli were included in the analysis and entered into the data matrix as zero values. The same approach was chosen for the characters of the ovipositor (length and width), which are applicable only to females. To distinguish between males and females, the sex was included as another two-state input character into the ANN model.
The data set used for ANN computations, thus, consisted of altogether 20 input variables (17 continuous, three binary) and a single nominal output variable, identification (the name of the species).
Software
ANN computation was performed using a Trajan Neural Network Simulator, version 3.0 D (Trajan Software, Ltd, 1996–1998). STATISTICA 7.0 (StatSoft, Inc., 2004) was used for other statistics. All calculations were performed on a standard PC computer with a Microsoft Windows 2000 Professional operating system.
Computational strategy and basics of ANN theory
The ANN computational strategy applied in this study is similar to that introduced by Vaňhara et al. (Reference Vaňhara, Muráriková, Malenovský and Havel2007). Data was randomly divided into a learning (training) set, a verification set and a test set. Each set consisted of a number of samples (thrips specimens) characterized by input variables (characters) and identified to species (output).
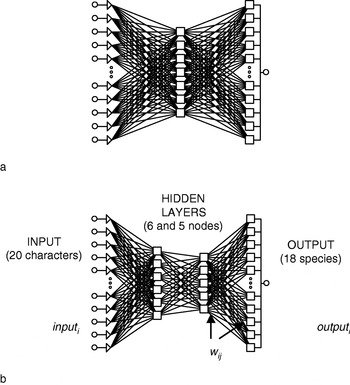
There are several different types of supervised ANN which can be used for classification problems (e.g. Bishop, Reference Bishop1995). Preliminary experiments on the data set with some of these types (radial basis function, linear, probabilistic and multilayer perceptrons networks) suggested that the multilayer perceptrons (MLP) would be the most efficient for the purpose. MLP is generally one of the most commonly used types of ANN and can model functions of almost arbitrary complexity. The MLP has already been used in most taxonomic applications (Clark, Reference Clark2003; Hernández-Borges et al., Reference Hernández-Borges, Corbella-Tena, Rodriguez-Delgado, Garcia-Montelongo and Havel2004; Chesmore, Reference Chesmore2004; Vaňhara et al., Reference Vaňhara, Muráriková, Malenovský and Havel2007). Similar to other ANN, MLP is a computational model formed from a certain number of single units, artificial neurones (nodes), interconnected with each other while coefficients (weights, w ij) are assigned to each connection. The MLP architecture is conventionally constructed with three or more feed forward layers, i.e. input, output and one or several hidden layers (e.g. fig. 2). Each layer might have a different number of nodes. The input layer receives the information about the system (the nodes of this layer are simple distributive nodes, which do not alter the input value at all). The hidden layer processes the information initiated at the input, while the output layer is the observable response or behaviour. The input values, input i, multiplied by connection weights, w ij, are first summed and then passed through a transfer function to produce the output, out i.
Possible ANN architectures for thrips identification. (a) Three-layered MLP (20, 7, 18) used in the paper; (b) four-layered MLP (20, 6, 5, 18).

The learning or training process of MLP consists of searching for such values of w ij weights to minimize the root mean square (RMS) value:

where y ij is the element of the matrix (N×M) for the training set, and out ij is the element of the output matrix (N×M) of the neural network, N is the number of variables in the pattern and M is the number of samples. By running the data on specimens from the training set, including the output variable (the identification), through the network and comparing the actual output generated with the desired or target outputs, the network automatically adjusts the weights and thresholds in order to minimize the overall error. This process is equivalent to fitting the model represented by the network to the training data available. Reaching the minimal RMS value indicates the best moment to stop the training procedure and is helpful in the search for the optimal network architecture. The latter largely consists of the estimation of an appropriate number of nodes in the hidden layer(s), which is one of the most critical tasks in ANN design. Unlike the input and output layers, the number and size of hidden layers are not predictable and will vary according to the complexity of the data.
The training of a MLP network can be executed by different algorithms. We used the back propagation, which is the best-known one and has relatively low memory requirements (Fausset, Reference Fausett1994; Patterson, Reference Patterson1996). We ran the training algorithm several times for 5000 to 10,000 iterations (epochs) with each configuration to ensure a proper convergation to RMS minimum and to avoid being stuck in a local minimum.
After obtaining the optimal architecture and minimal RMS, a number of randomly selected specimens from the learning set were excluded to form the verification set. They were used as a check for cross-validation of the training procedure to prevent over-training – the situation when the model is too complex and training achieves a low error but has a poor generalization when new samples are processed. The verification is a test of prediction power of the model (its efficiency is in identifying unknown specimens). However, unlike the test set, the verification set does actually play a role in selecting the final ANN model.
ANN computation also comprises pre- and post-processing stages. Pre-processing techniques used in our study included data standardization (scaling) and conversion of nominal input variables to numeric values (done automatically by Trajan software). Similarly, the output activation scores were transformed by post-processing into the name of thrips species. The classification by ANN is performed by checking output unit activation levels against two thresholds, the accept threshold and the reject threshold. To simply assign the classification to the species corresponding to the winning unit, irrespective of the settings of other units, we set the accept threshold to zero and ignored the reject threshold.
Results
Basic statistical analysis and structure of the data
Descriptive statistics of the data were examined first in order to understand what the inter- and intraspecific variabilities are in the individual characters.
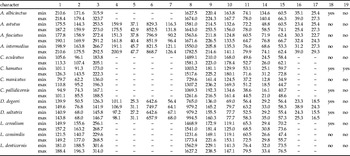
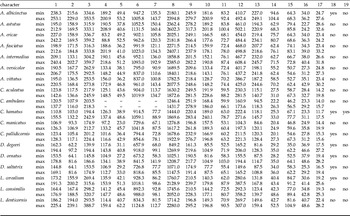
The minimum and maximum values for each character are given separately in the Appendix for the males and females of each species. The range of variability highly exceeded the experimental uncertainty of measurements in all the morphometric characters. On the other hand, the morphometric characters largely overlapped between different species, especially those belonging to the same genus. A reliable distinction of included species, thus, would be practically impossible if only a single or a few morphometric characters were considered.
Correlation analysis of morphometric data
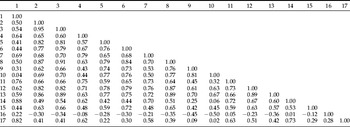
A correlation matrix of the morphometric characters is presented in table 3. High correlations were observed, particularly between characters 2 (head dorsal length) and 3 (head ventral length), and 3 and 8 (total body length). Also, other characters, more or less, correlated with the total body size, e.g. the length and width of ovipositor, whereas characters corresponding to antenna, ocelli or pronotum were statistically more independent. In spite of the high correlations between some of the variables, in order not to lose information, we did not reduce the data and kept all the available characters for the ANN analysis.
Correlation matrix (Spearman rank correlation coefficient) of morphometric variables over the entire data set (measures missing due to the absence of wings and ocelli pairwise excluded).

Basic factor analysis
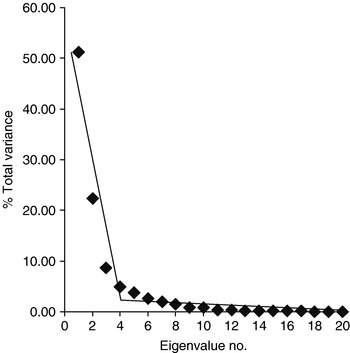
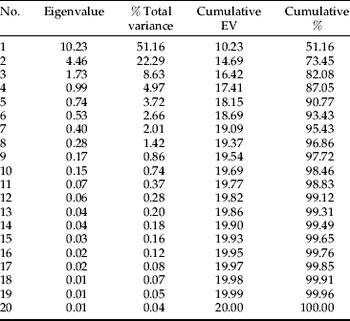
The basic factor analysis (FA, sometimes also called Eigenvalues analysis) was used here as an exploratory technique to examine the data structure and also to find the number of factors responsible for the variability in the whole data matrix. It is known that the number of non-zero Eigenvalues (EV), or the rank of the matrix, gives a sound estimate for the number of factors influencing the data. The rank has a strong and quite real meaning. FA for the complete data set here revealed that 87% of the total variance in the whole data (characters 1–19 and sex) can be explained by the first four factors (table 4). In other words, just the first four EV correspond to nearly 90% of the total variability. This is illustrated in fig. 3. The biological meaning is that four thrips genera in the data are responsible for most of the variability and vice versa. To explain 99.9% variability, a much higher number of EV is needed; and this number approaches the total number of different species present in the whole data set, i.e. 18. Thus, to explain the complete variability in the data set, we really need a much higher number of EV. Thus, the rank of the data matrix used is near to the total number of the species, and this indicates that the data we have selected really contains information about just 18 species. There is, of course, the question whether ANN would be able to make the distinction between each individual species present when the number of morphological characters and the total number of inputs (20) is only slightly higher than the total number of species (18).
Variability in the thrips data matrix as a function of the number of eigenvalues.

Factor analysis: eigenvalues (EV) and related statistics.

ANN analysis of the thrips database
As already mentioned above, the use of ANN consists of several steps; search for a suitable ANN architecture, training (modelling), verification and identification (prediction) of unknown specimens. The individual steps were carefully examined.
Search for the optimal ANN architecture
First, 100 samples were randomly removed from the original data to compose the test set. These samples were reserved for a single unrepeated testing of the final ANN model, which had been selected and optimized using the learning and the verification sets. The test set did not play any role in the search of the model and ensured that the results of the training and verification sets were real and not artefacts of the training process.
The remaining 398 samples were used to search for a suitable and/or optimal ANN architecture and for corresponding network training.
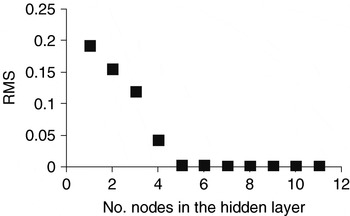
For simplicity, we started the search for a suitable ANN architecture with a three-layered MLP structure. For this purpose, we studied the dependence of RMS error on the number of nodes in the hidden layer in the architecture of the general form (20, n, 18), where 20 is the number of nodes in the input layer, n is the number of nodes in the hidden layer, and 18 is the number of nodes in the output layer. The effect of n on the RMS error value is shown in fig. 4. The minimal value of RMS (ca. 1.10−3) was achieved for n≥5–7. We chose the network (20, 7, 18) with seven nodes in a single hidden layer (fig. 2a) for further computations because only for n≥7, a 100% correct classification of samples in the training process was achieved in most of the runs.
Dependence of RMS error on the number of nodes in the hidden layer for a three-layered MLP architecture.

Another suitable architecture found in training experiments was with two hidden layers, (20, 6, 5, 18), cf. fig. 2b, which also gave good results and a 100% prediction. The total number of unknown weights, w ij, is lower by 16 in the latter than in the (20, 7, 18) structure (266 unknowns). However, the simpler three-layered (20, 7, 18) architecture was preferred, as it was found to be experimentally more resistant and robust in performance.
Further experiments suggested that the optimal ANN architecture was independent of the number of samples in the training set. Even when 50% of the available data was used in the training set, the effect of n on the RMS error value remained very similar.
Training and verification
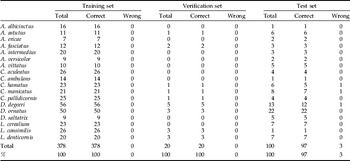
The training and verification was done with (20, 7, 18) architecture. An example of the results, using a training set with 378 samples and a verification set with 20 samples, is summarized in table 5. A 100% correct classification was reached over both the training and verification sets.
Results of the classification using the final ANN model in an independent test.

Identification of the test samples
The trained (20, 7, 18) model was then tested with the test set data. Only three specimens of Thysanoptera (one specimen of each Chirothrips hamatus, C. manicatus and Dendrothrips degeeri) were misidentified (table 5). The achieved 97% success rate indicates the potential effectiveness of the trained network in an independent test.
Number of specimens in the training set and the accuracy of identification
Further, we examined the effect of the number of samples in the training set on a successful identification using repeated verification experiments. For this purpose, we used the recombined original data set and the same (20, 7, 18) architecture as in the preceding test, which was, however, repeatedly trained on different numbers of samples.
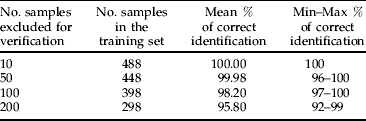
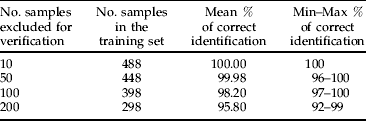
Successively, we randomly excluded 10, 50, 100 and/or up to 200 samples for the verification set. For each of these numbers, we simulated ten random training runs. If these verification experiments do not provide entirely independent tests, they can, at least, give an estimate of the prediction power of the network under different sizes of the training set.
Results of the simulations are summarized in table 6. For ten verified specimens, a 100% correct classification was achieved in all ten runs; 50–100 verified specimens were identified on average with 98% to almost 100% accuracy. Even when the number of simultaneously verified specimens increased to 200, the verification was excellent and failed only in ca. 4% of the cases which were misidentified. We, therefore, consider the predictive reliability of the ANN model as highly satisfactory.
Summary of the results concerning ANN verification experiments with different sizes of the training set (N=10).
An extrapolation of the data obtained from the verification tests indicated that for a 95% correct identification (α=0.05) of Thysanoptera, a training set with ca. 300–350 specimens in total and at least six specimens of each species is sufficient. Using the complete information from the 498 specimens in the data set, the thrips identification by ANN is unproblematic and reliable. If only a few of these 498 specimens were eliminated from the training and used for the prediction, a fully successful identification was practically always reached.
Discussion and conclusions
The high percentage of correctly identified specimens from our data set is promising for a wider use of ANN for thrips identification in practice. Our example enables the identification of 18 thrips species including two pests, Limothrips cerealium and L. denticornis. When using the same or similar methodology and including other taxa into the training set, the system could be extended or modified for the identification of further Thysanoptera taxa, e.g. a model could specifically be designed for the identification of tospoviruses vectors.
The use of ANN for identification in taxonomy requires first the existence of a training database in which many specimens, correctly identified by experts, are included. Each specimen has to be characterized by diagnostic variables which are adequate to classify the specimen to a species and discriminate the same from other taxa in the database. Second, an ANN model is designed to find a relationship between the characters (=input) and species (=output). This model can then be applied for the identification of unknown specimens.
It might be laborious to create the training data set which should consist of a relatively large number of specimens to assure a correct identification. However, the more specimens that are included into the training, the better the real variation in morphology that is captured and the higher the prediction success, i.e. the proportion of correctly identified specimens (Gaston & O'Neill, Reference Gaston and O'Neill2004; Vaňhara et al., Reference Vaňhara, Muráriková, Malenovský and Havel2007). However, our experiment on thrips suggests that identification is possible if at least several specimens of a species are included into the training data set (the lowest number of specimens in this study was nine for Aeolothrips ericae). The effort needed would, thus, be manageable in a practical application. The same is true for the ANN modelling, which requires knowledge of the basic principles, e.g. how to select and prepare data, how to select an appropriate network and how to interpret the results. The level of user knowledge needed for its successful application is, however, lower than in many other statistical methods.
Our case study on thrips uses, for the main part, morphometric data. The advantage is that homologous characters can be objectively defined as distances on the thrips body in different taxa. Measurement of such distances requires only limited experience in slide-mounting techniques and a basic knowledge of thrips morphology. With the help of a pictorial schema, which specifies the distances, it would be without difficulty for a non-expert. Technical requirements are limited to a microscope with an eye-piece graticule or a digital camera and image analysis software, which would allow more comfort.
The measurements on thrips would probably have to be made by a human operator. It would probably be difficult to fully automate the process unlike, for example, in the wings of Hymenoptera and Diptera, which have a contrasting two-dimensional pattern and where different vein lengths can be extracted from a digital picture automatically (Houle et al., Reference Houle, Mezey, Galpern and Carter2003; Tofilski, Reference Tofilski2004). Also, an analysis of information extracted directly from a digital image as proposed for the wings of Ichneumonid parasitic wasps by Weeks et al. (Reference Weeks, Gauld, Gaston and O'Neill1997) or for genital structures of spiders by Do et al. (Reference Do, Harp and Norris1999), probably would turn out to be very complicated in thrips as they are much smaller. Consequently, it would be more difficult to mount exactly the same position before image acquisition. Acquiring the values for the 20 input characters used in our study took approximately ten minutes for each thrips specimen. This time is, however, to be compared to the duration of the identification process using a traditional determination key. Since the classification of a specimen using a trained ANN is then almost immediate, the identification by ANN can be achieved in less time.
The practical use of automated systems and supervised ANN for species identification has several limitations, which have been thoroughly discussed in general by Weeks & Gaston (Reference Weeks and Gaston1997) and Gaston & O'Neill (Reference Gaston and O'Neill2004). For Thysanoptera, errors in identification could be caused by intraspecific variation due to geographical differences in morphology between populations, as is observed for the females of Limothrips cerealium, which are always macropterous in central Europe, while pterygopolymorphism has been recorded in southern Europe (zur Strassen, Reference zur Strassen2003). For apterous L. cerealium, in order to have females correctly identified by ANN, several such specimens would probably have to be included in the training set. The quality of the training set is an essential prerequisite to obtaining reliable identifications, and any known variation in morphology should be taken into account and represented in the training set.
For the same reason, only the taxa included in the training set can be identified by an ANN model. Specimens of other species will, thus, tend to be identified as belonging to one of the training set, and this would lead to false identification. This problem can partly be eliminated by adjusting the post-processing stage of ANN modelling, setting the accept and reject thresholds for the output activation scores as confidence limits. Only if the output score for a corresponding network unit exceeded the accept level and all other units failed to exceed the reject threshold would the identification be made. Otherwise, the specimen's identity would stay undecided (unknown). Alternatively, samples of other similar species occurring, e.g. in a certain geographical region, could be included in the training set and the identifier extended to also include those taxa. The model used by us works as a non-hierarchical system which identifies simultaneously 18 species belonging to four genera. Possible larger identification systems could take advantage of a hierarchical approach, in which specimens would first be identified, for example, to genus and then to species, which would also be computationally more efficient (Do et al., Reference Do, Harp and Norris1999; Gaston & O'Neill, Reference Gaston and O'Neill2004).
Weeks & Gaston (Reference Weeks and Gaston1997) envisaged a combination of ANN-based automated identification systems with multi-access keys. This combination seems particularly suitable for Thysanoptera, for which such keys already exist, at least for species of economic importance (Moritz et al., Reference Moritz, Morris and Mound2001, Reference Moritz, Mound, Morris and Goldarazena2004). ANN could refine their performance, in that they can compare multivariate continuous morphometric data efficiently or simply provide an independent check, e.g. for critical taxa (Clark, Reference Clark2003), specimens partly damaged by rough collecting methods (sticky traps, aeroplanctonic traps, Tullgren photoeclectors, etc.) or old slides. Thus, ANN probably have the potential to enhance the practice of routine Thysanoptera identification. In a similar way, they could also serve for other insect pests, e.g. aphids for which morphometrics is also extensively used for identification.
Acknowledgements
For financial support, the Ministry of Education and the Masaryk University (grant No. MSM 0021622416) are acknowledged. The paper was also partly supported by the grant (No. MK 00009486201) from the Ministry of Culture of the Czech Republic to the Moravian Museum and the VEGA grant no. 1/4339/07 to Peter Fedor. We thank Dr Laurence Mound (Canberra, Australia) for his kind comments.
Minimum and maximum values recorded for characters used for ANN Thysanoptera identification (measurements in μm) for males.

Minimum and maximum values recorded for characters used for ANN Thysanoptera identification (measurements in μm) for females.