1. Introduction
Bubbly flows pervade a wide range of industrial processes in geological, chemical, pharmaceutical and food engineering (Rodríguez-Rodríguez et al. Reference Rodríguez-Rodríguez, Sevilla, Martínez-Bazán and Gordillo2015; Dollet, Marmottant & Garbin Reference Dollet, Marmottant and Garbin2019; Ji, Yang & Feng Reference Ji, Yang and Feng2021; Yang et al. Reference Yang, Ji, Ault and Feng2023). Although the continuous liquid phase is Newtonian, the introduction of discrete bubbles endows the dispersion system with complex non-Newtonian behaviours such as shear-dependent viscosity and elasticity, thereby posing challenges to the prediction and control of the flow behaviour (Stein & Spera Reference Stein and Spera2002; Tran-Duc, Phan-Thien & Cheong Khoo Reference Tran-Duc, Phan-Thien and Cheong Khoo2013; Zenit & Feng Reference Zenit and Feng2018).
Originating with the well-known Einstein equation (Einstein Reference Einstein1905, Reference Einstein1911), rheological models of bubble suspensions have been established with a special focus on the shear-dependent properties (Oldroyd Reference Oldroyd1953; Frankel & Acrivos Reference Frankel and Acrivos1970; Choi & Schowalter Reference Choi and Schowalter1975; Llewellin, Mader & Wilson Reference Llewellin, Mader and Wilson2002; Pal Reference Pal2003a
, Reference Pal2004; Höhler et al. Reference Höhler, Cohen-Addad and Labiausse2004; Ohie, Tasaka & Murai Reference Ohie, Tasaka and Murai2024). These models predict the shear-thinning and relaxation behaviours of bubble suspensions, which have been confirmed by experiments under pure shear flows (Han & King Reference Han and King1980; Rust & Manga Reference Rust and Manga2002b
; Lim, Seo & Youn Reference Lim, Seo and Youn2004; Joh, Lee & Youn Reference Joh, Lee and Youn2010; Morini et al. Reference Morini, Chateau, Ovarlez, Pitois and Tocquer2019; Mitrou et al. Reference Mitrou, Migliozzi, Angeli and Mazzei2023). In established models, the rheology of a dilute bubble suspension is mainly determined by two parameters: the void fraction
 $\phi$
, and the shear capillary number
 ${\textit{Ca}}_S = \mu _l a \dot {\gamma } / \varGamma$
, where
 $\mu _l$
is the viscosity of the liquid matrix,
 $a$
is the initial radius of a single bubble,
 $\dot {\gamma }$
is the shear rate of the macroscopic flow field, and
 $\varGamma$
is the interfacial tension. The shear capillary number
 ${\textit{Ca}}_S$
serves as a metric for appraising the magnitude of the shear rate within the macroscopic flow or the deformation of bubble shape. When
 ${\textit{Ca}}_S \ll 1$
, the external fluid flows around the nearly spherical bubbles, causing the streamlines to bend and increasing the viscous dissipation. As a result, the effective shear viscosity
 $\mu$
of the suspension increases to
 $(1 + \phi ) \mu _l$
(Taylor Reference Taylor1932). With increasing shear effects, the bubbles are elongated in a preferred direction (Rust & Manga Reference Rust and Manga2002a
; Müller-Fischer et al. Reference Murai and Oiwa2008), resulting in a reduction in streamline deformation (Manga et al. Reference Manga, Castro, Cashman and Loewenberg1998). Moreover, these deformed bubbles may gradually form an ordered spatial structure within the liquid matrix (Lejeune et al. Reference Lejeune, Bottinga, Trull and Richet1999). These effects effectively decrease the viscous dissipation of the suspension, leading to the manifestation of shear-thinning behaviour (Rust & Manga Reference Rust and Manga2002b
; Morini et al. Reference Morini, Chateau, Ovarlez, Pitois and Tocquer2019; Mitrou et al. Reference Mitrou, Migliozzi, Angeli and Mazzei2023). Finally, as the shear rate increases to the point where the bubbles are not yet breaking but
 ${\textit{Ca}}_S \gg 1$
, the shear viscosity
 $\mu$
tends to another limit, namely
 $1 - 5\phi /3$
, which is even less than the viscosity of the liquid matrix (Mackenzie Reference Mackenzie1950; Manga & Loewenberg Reference Manga and Loewenberg2001).
However, these models primarily focus on the shape deformation of the bubbles, which are regarded as special incompressible ‘inviscid droplets’, while neglecting their volume dilatation. In fact, unlike droplets, bubbles are highly compressible (Llewellin et al. Reference Llewellin, Mader and Wilson2002; Mader, Llewellin & Mueller Reference Mader, Llewellin and Mueller2013). Studies have shown that the presence of bubbles can significantly reduce the speed of sound in suspensions, even when the void fraction is as low as 1 % (Kieffer Reference Kieffer1977). Consequently, dilatational motion will be triggered in bubbly flows due to violent pressure variations in practical scenarios, such as foam flooding and fuel injection (Nurick Reference Nurick1976; Islam & Chakma Reference Islam and Chakma1990; Fisher et al. Reference Fisher, Espidel, Huerta, Randall and Goldman1999; Or et al. Reference Or, Sasaki, Sugai, Nakano and Imai2016; Sun et al. Reference Sun, Cui, Zhang, Liu, Yang, Ji and Fu2024).
Limited research has been conducted on the dilatational properties of suspensions containing spherical bubbles. Taylor (Reference Taylor1954) pointed out that the presence of bubbles makes the suspension compressible, and noted that the dilatational motion encounters resistance from the external fluid, resulting in a dilatational viscosity
 $\kappa = 4 \mu _l / (3 \phi )$
. Subsequent studies investigated the dilatational viscosity in more complex flows (Prud’homme & Bird Reference Prud’homme and Bird1978; Lensky, Lyakhovsky & Navon Reference Lensky, Lyakhovsky and Navon2002; Brady, Khair & Swaroop Reference Brady, Khair and Swaroop2006; Swaroop & Brady Reference Swaroop and Brady2007). In comparison to the findings of Taylor (Reference Taylor1954), an additional correction factor,
 $1 - \phi$
, has been introduced to represent the effect of bubble dilatation on the pressure field throughout the surrounding liquid. Consequently,
 $\kappa$
becomes
 $ 4 (1-\phi ) \mu _l / (3 \phi )$
. However, these investigations do not account for shear effects and bubble shape deformation. The shear and dilatational properties of bubble suspensions have typically been explored independently.
In fact, the expansion or compression of bubbles changes the shear flow field by introducing an additional centripetal flow and affecting their shape deformation (Tanveer & Vasconcelos Reference Tanveer and Vasconcelos1995; Pozrikidis Reference Pozrikidis2001, Reference Pozrikidis2003; Crowdy Reference Crowdy2003), thus may modify the shear rheological properties of the suspension. Unfortunately, due to the incompressible assumption of bubbles, previous models fundamentally ignored the contribution of dilatational motion to the suspension’s shear viscosity (Oldroyd Reference Oldroyd1953; Frankel & Acrivos Reference Frankel and Acrivos1970; Llewellin et al. Reference Llewellin, Mader and Wilson2002; Ohie et al. Reference Ohie, Tasaka and Murai2024). How the shear rheology of bubble suspensions responds to dilatation remains unexplored.
In this work, we theoretically develop a novel constitutive equation for dilute bubble suspensions undergoing both shear and dilatational motion. We report a compression-thinning behaviour, a distinct rheological property arising from bubble compressibility under changing pressure, which can significantly influence the suspension’s shear rheology. Our study highlights the critical role of dilatational motion in mediating the shear viscosity of bubble suspensions.
The subsequent sections are organised as follows. In § 2, the constitutive equation for a dilute bubble suspension is derived. Section 3 presents simplified results of the constitutive equation under specific flow conditions involving constant-rate or oscillatory pressure variations. The influence and underlying mechanism of bubble compressibility on the effective shear viscosity of the suspension are quantitatively examined. Finally, the main conclusions are summarised in § 4.
2. Constitutive equation
We consider the shear rheology of a fluid element of a dilute suspension with length scales much larger than the bubble size, where the relationship between the bulk stress and the bulk rate-of-strain tensor is established using Batchelor’s volume averaging method (Batchelor Reference Batchelor1970), which gives
 \begin{equation} \left \langle {\boldsymbol \tau } \right \rangle = 2 \mu _l \left \langle \boldsymbol{e} \right \rangle + \frac {N}{V} {\boldsymbol \varSigma }^g , \end{equation}
where
 $\left \langle {\cdot }\right \rangle$
denotes averaged quantities in the fluid element,
 $\boldsymbol{\tau }$
is the deviatoric stress tensor,
 $\boldsymbol{e}$
is the rate-of-strain tensor,
 $V$
is the element volume, and
 $N$
is the bubble number. For simplicity, the liquid matrix is assumed to be Newtonian, and the bubbles in the fluid element are monodisperse and non-interacting. Based on Gauss’s law, the stress contribution of an individual bubble,
 ${\boldsymbol \varSigma }^g$
, is expressed as (Batchelor Reference Batchelor1970)
 \begin{equation} \boldsymbol{\varSigma } ^g = \int _S\left( { {\boldsymbol{n} \boldsymbol{\cdot }\left ( {{\boldsymbol \sigma }_l \boldsymbol{r}} \right ) - \frac {1}{3}\left ( {{\boldsymbol \sigma }_l \boldsymbol{:} \boldsymbol{nr}} \right ) \boldsymbol{\delta } - \mu _l \left ( {\boldsymbol{n}{\boldsymbol u}_l + {\boldsymbol u}_l \boldsymbol{n}} \right )} }\right)\mathrm{d}S , \end{equation}
where the subscript
 $l$
and superscript
 $g$
denote the liquid and gas phases, respectively,
 $\boldsymbol{n}$
and
 $\boldsymbol{r}$
represent the unit outward normal vector and the position vector on the bubble surface
 $S$
,
 $\boldsymbol{\sigma }$
and
 $\boldsymbol{u}$
represent the stress tensor and local velocity vector, and
 $\boldsymbol \delta$
is the Kronecker tensor.
To evaluate the influence of bubbles on the macroscopic rheological properties, we consider the microscopic flow of a fluid element containing a small single bubble of equivalent initial radius
 $a$
, with a macroscopic velocity
 $\boldsymbol{U}$
, pressure
 $P$
, shear rate
 $\dot \gamma$
, and rate of change in pressure
 $\mathrm{d}P/\mathrm{d}t$
. In the following, all parameters are made dimensionless using
 $a$
,
 $\dot \gamma ^{-1}$
and
 ${\mu _l}\dot \gamma$
as the characteristic length, time and stress scales, respectively. The liquid flow around the bubble is described by the Stokes equations under the assumption of low Reynolds number (Cox Reference Cox1969):
 \begin{equation} \boldsymbol{\nabla }\boldsymbol{\cdot }\boldsymbol{u}_l = 0 , \quad \boldsymbol{\nabla }p_l = {\nabla} ^2 \boldsymbol{u}_l , \end{equation}
and the gas in the bubble is assumed to be compressible, inviscid and ideal, yielding
 \begin{equation} \boldsymbol{\nabla }\boldsymbol{\cdot }\boldsymbol{u}_g = -\frac {1}{p_g} \frac {\mathrm{d} p_g}{\mathrm{d} t} , \quad \boldsymbol{\nabla }p_g = 0, \end{equation}
where
 $\boldsymbol{\nabla}$
is the Hamiltonian operator, and
 $p$
is the local pressure corresponding to an isothermal process.
We describe the velocities, stresses and bubble deformations explicitly using spherical harmonic analysis. The solutions to the Stokes equations (2.3) were provided by Lamb (Reference Lamb1975), and the velocity inside the bubble is derived as
 \begin{equation} {\boldsymbol{u}_g} = - \frac {1}{{6{p_g}}}\frac {{\mathrm{d}{p_g}}}{{\mathrm{d}t}} \boldsymbol{\nabla }{r^2} + \sum \limits _{n = 0}^{ + \infty } {\boldsymbol{\nabla }\left ( r^n \mathcal{Y}^g_n \right ) } , \end{equation}
where
 $r = \left | \boldsymbol{r}(x,y,z) \right |$
, and
 $\mathcal{Y}^g_n$
is a spherical surface harmonic of order
 $n$
(see Appendices A and B for details of the theoretical derivations and expressions).
At the bubble surface separating the gas and liquid phases (Stone Reference Stone1994; Ramachandran & Leal Reference Ramachandran and Leal2012), the free-slip boundary condition gives
 $ ( {\boldsymbol{\delta } - \boldsymbol{nn}} ) \boldsymbol{\cdot }\boldsymbol{\sigma }_l \boldsymbol{\cdot }\boldsymbol{n} = 0$
, the normal stress balance gives
 $\boldsymbol{\sigma }_l \boldsymbol{:} \boldsymbol{nn} - {{\boldsymbol{\sigma } _g} \boldsymbol{:} \boldsymbol{nn}} = {{\textit{Ca}}_S^{-1}} ( {R_1^{ - 1} + R_2^{ - 1}} )$
, and the normal velocity continuity gives
 $\boldsymbol{u}_l \boldsymbol{\cdot }\boldsymbol{n}=\boldsymbol{u}_g \boldsymbol{\cdot }\boldsymbol{n}$
. Here, the shear capillary number
 ${\textit{Ca}}_S$
compares the shear-induced viscous stress to capillarity, and
 $R_1$
and
 $R_2$
are the principal radii of curvature of the interface (see Appendix C). The harmonic expressions of the velocities and stresses can be theoretically solved in combination with the above boundary conditions, once the equation of the bubble surface is known.
The equation of the bubble surface is expressed by considering an additional deformation caused by the changing pressure,
 ${\textit{Ca}}_D\, f_D$
, on a given initial shape
 $f^{(0)}$
, i.e.
 \begin{equation} r = f^{(0)} + {\textit{Ca}}_D\, f_D , \end{equation}
where
 $f^{(0)}$
is given by Frankel’s model (Frankel & Acrivos Reference Frankel and Acrivos1970) as
 $f^{(0)} = 1 + {\textit{Ca}}_S\, \mathcal{F}^S_2$
(see Appendix D), and
 ${\textit{Ca}}_D$
is the dilatation capillary number, defined as
 \begin{equation} {\textit{Ca}}_D = - \frac {\mu _l a }{\varGamma } \frac {\mathrm{d}P}{P\, \mathrm{d}t} , \end{equation}
which compares the dilatation-induced viscous stress to capillarity, being positive during decompression and negative during compression. Here, both
 $P$
and its time derivative
 $\mathrm{d}P/\mathrm{d}t$
are dimensional quantities. Additionally,
 $f_D$
is expressed using the surface harmonics as
 $ f_D = \sum {\mathcal{F}^D_n}$
(
 $n \geqslant 0$
) (see Appendix D).
To solve the above equations analytically, we assume that both the bubble shape deformation and volume dilatation are small (
 ${\textit{Ca}}_S \lt 1$
and
 ${\textit{Ca}}_D \lt 1$
), so that the bubble contributes perturbations of
 $O(Ca)$
to the surrounding liquid flow. The surface harmonics are then obtained using the perturbation method (Chaffey & Brenner Reference Chaffey and Brenner1967; Schowalter, Chaffey & Brenner Reference Schowalter, Chaffey and Brenner1968; Cox Reference Cox1969). Results show that only the zeroth- and second-order surface harmonics need to be considered, with higher orders being negligible. Finally, the liquid velocity around the bubble is given by (Appendix A)
 \begin{equation} \boldsymbol{u}_l = \boldsymbol{U} + \boldsymbol{\nabla }\left ( r^{-1} \mathcal{Y}^l_0 + r^{-3} \mathcal{Y}^l_2 \right ) + \frac {1}{2} r^{-3} \mathcal{Z}^l_2 \boldsymbol{r} , \end{equation}
where
 $\mathcal{Y}^l_n$
(
 $n= 0, 2$
) are the surface harmonics corresponding to the velocity field of the liquid Stokes flow, and
 $\mathcal{Z}^l_2$
is the second-order surface harmonic of the liquid pressure, expressed as
 ${\mathcal{Z}}^l_2 = 3 {\boldsymbol{Z}}^l \boldsymbol{:} \boldsymbol{rr} r^{-2}$
, where
 \begin{equation} {\boldsymbol{Z}}^l = -\frac {2}{3} \boldsymbol{E} + {\textit{Ca}}_S\, {\boldsymbol{Z}}^{l}_S + {\textit{Ca}}_D\, {\boldsymbol{Z}}^{l}_D. \end{equation}
On the right-hand side of (2.9), the first term represents the influence of spherical volume-invariant bubbles (Taylor Reference Taylor1932), with
 $\boldsymbol{E} = [\boldsymbol{\nabla }\boldsymbol{U} + (\boldsymbol{\nabla }\boldsymbol{U})^{\mathrm{T}} ] / 2$
denoting the rate-of-strain tensor of the macroscopic flow; the second term accounts for the bubble shape deformation under pure shear (Frankel & Acrivos Reference Frankel and Acrivos1970); and the third term evaluates the contribution of bubble volume dilatation, with
 \begin{equation} {\boldsymbol{Z}}^l_D = -2 \mathcal{F}^D_0 \boldsymbol{E} - \frac {8}{45} \boldsymbol{E}. \end{equation}
Then the dimensionless stress contribution of the bubble is obtained as (2.11) by substituting the solutions for velocities and stresses into (2.2):
 \begin{equation} \boldsymbol{\varSigma }^g = -\frac {4\pi R^3}{3} \left [ \frac {2}{3} (\boldsymbol{\nabla }\boldsymbol{\cdot }\boldsymbol{u}_g) \boldsymbol{\delta } + 3 \frac {\boldsymbol{Z}^l}{R^3} \right ]\!, \end{equation}
where
 $R = 1 + {\textit{Ca}}_D\, \mathcal{F}^D_0$
is the equivalent radius of the deformed bubble at time
 $t$
(equal to 1 at
 $t = 0$
), and
 $\boldsymbol{\nabla }\boldsymbol{\cdot }{\boldsymbol{u}_g}$
is the average velocity divergence of the gas phase. As shown in the normal stress balance equation (A4), at sufficiently high pressures that overwhelm the capillary and viscous stresses at the bubble surface, i.e.
 $P \gg \max[2/({\textit{Ca}}_S\, R), 4\, \mathrm{d}R/(R\, \mathrm{d}t)]$
, the gas pressure
 $p_g$
approximately equals the macroscopic pressure
 $P$
(see Appendix E). Consequently,
 \begin{equation} \boldsymbol{\nabla }\boldsymbol{\cdot }\boldsymbol{u}_g = -\frac {1}{P} \frac {\mathrm{d}P}{\mathrm{d} t} . \end{equation}
This implies that the volumetric dilatation rate of the suspension (Cifuentes et al. Reference Cifuentes, Dopazo, Martin, Domingo and Vervisch2015) can be expressed as
 $\dot {\mathcal{V}} = \langle \boldsymbol{\nabla }\boldsymbol{\cdot }\boldsymbol{u} \rangle = -\phi\, \mathrm{d}P/(P\,\mathrm{d} t)$
, and the dilatation capillary number can equivalently be written as
 ${\textit{Ca}}_D = \mu _l a \dot {\mathcal{V}}/(\varGamma \phi )$
.
Substituting (2.11) into (2.1), we obtain the constitutive equation of the bubble suspension as
 \begin{equation} \left \langle \boldsymbol{\tau } \right \rangle = 2 \left ( 1 + \phi \right ) \left \langle \hat {\boldsymbol{e} } \right \rangle + \left \langle \boldsymbol{\tau }_S \right \rangle + \left \langle \boldsymbol{\tau }_D \right \rangle \!, \end{equation}
where
 $\hat {\boldsymbol{e}}$
is the deviatoric rate-of-strain tensor, and
 $ 1 + \phi$
in the first term on the right-hand side is the relative viscosity derived by Taylor (Reference Taylor1932) under the spherical bubble assumption. Here,
 $\left \langle \boldsymbol{\tau }_S \right \rangle$
evaluates the stress contribution of bubble shape deformation caused by the pure shear flow, given by Frankel & Acrivos (Reference Frankel and Acrivos1970) as
 \begin{equation} \left \langle \boldsymbol{\tau }_S \right \rangle = \phi\, {\textit{Ca}}_S \left ( - \frac {32}{5}\frac {\mathcal{D}\left \langle \hat {\boldsymbol{e}} \right \rangle }{\mathcal{D}t} + \frac {48}{35} \mathcal{L}\left [ \left \langle \hat {\boldsymbol{e}} \right \rangle \boldsymbol{\cdot }\left \langle \hat {\boldsymbol{e}} \right \rangle \right ] \right )\!, \end{equation}
where
 ${\mathcal{D} \boldsymbol{A}/\mathcal{D} t} = \partial \boldsymbol{A} / \partial t + (\boldsymbol{u} \boldsymbol{\cdot }\boldsymbol{\nabla }) \boldsymbol{A} + \boldsymbol{\varOmega }\boldsymbol{\cdot }\boldsymbol{A} - \boldsymbol{A}\boldsymbol{\cdot }\boldsymbol{\varOmega }$
denotes the Jaumann derivative of an arbitrary second-order tensor
 $\boldsymbol{A}$
(Llewellin et al. Reference Llewellin, Mader and Wilson2002; Pal Reference Pal2003a
), and
 $\mathcal{L}[\boldsymbol{A}] = (\boldsymbol{A} + \boldsymbol{A}^{\mathrm{T}} - 2 \boldsymbol{A}\boldsymbol{:}\boldsymbol{\delta }/3)/2$
indicates that only the deviatoric part is retained. Here,
 $\boldsymbol{\varOmega } = [\boldsymbol{\nabla }\boldsymbol{U} - (\boldsymbol{\nabla }\boldsymbol{U})^{\mathrm{T}} ] / 2$
represents the vorticity tensor.
The last term of (2.13),
 $\left \langle \boldsymbol{\tau }_D \right \rangle$
, represents the stress contribution of the bubble volume dilatation due to the rate of change in pressure, which is expressed as
 \begin{equation} \left \langle \boldsymbol{\tau }_D \right \rangle = \frac {8}{15} \phi\, {\textit{Ca}}_D \left \langle \hat {\boldsymbol{e}}\right \rangle \!, \end{equation}
influenced by the volumetric dilatation rate instead of the dilatation amount. Equation (2.13) indicates that the shear rheology of the dilute bubble suspension is determined by the current void fraction
 $\phi$
,
 ${\textit{Ca}}_S$
and
 ${\textit{Ca}}_D$
. When there is no significant pressure variation,
 ${\textit{Ca}}_D = 0$
, and (2.13) reduces to Frankel’s equation (Frankel & Acrivos Reference Frankel and Acrivos1970), which served as the basis for several subsequent constitutive equations for bubble suspensions (Choi & Schowalter Reference Choi and Schowalter1975; Llewellin et al. Reference Llewellin, Mader and Wilson2002; Pal Reference Pal2003a
,
Reference Palb
, Reference Pal2004; Murai & Oiwa Reference Müller-Fischer, Tobler, Dressler, Fischer and Windhab2008; Mitrias et al. Reference Mitrias, Jaensson, Hulsen and Anderson2017; Morini et al. Reference Morini, Chateau, Ovarlez, Pitois and Tocquer2019; Mitrou et al. Reference Mitrou, Migliozzi, Angeli and Mazzei2023; Ohie et al. Reference Ohie, Tasaka and Murai2024). However, the suspension undergoes dilatational motion upon pressure variation due to the bubble compressibility. Our new constitutive equation demonstrates that the bubble compressibility decreases the viscosity when the pressure is increasing (
 ${\textit{Ca}}_D \lt 0$
), corresponding to a compression-thinning effect, while it increases the viscosity at decreasing pressure (
 ${\textit{Ca}}_D \gt 0$
), corresponding to a decompression-thickening effect. Indeed, the volumetric dilatation rate modifies the suspension’s shear rheological properties, endowed by the intrinsic compressibility of the gas bubbles, which has not been captured in previous studies on the shear rheology of bubble suspensions.
3. Results and discussion
To unveil the physics underlying the compression-thinning behaviour induced by bubble compressibility, we analyse the microscopic flow field around a single bubble subjected to steady shear (figure 1). We find that variations in pressure do not noticeably alter the bubble shape, but they significantly modify the velocity field in its vicinity. The perturbation induced by the bubble is confined to the near-field region and decays rapidly, becoming negligible at distances of the order of
 $a$
from the bubble surface.
Velocity field around a bubble in shear flow (
 ${\textit{Ca}}_S = 0.05$
): (a)
 ${\textit{Ca}}_D = 0$
, (b)
 ${\textit{Ca}}_D = 0.05$
(decompression), and (c)
 ${\textit{Ca}}_D = -0.05$
(compression), where the blue shaded area indicates the bubble cross-section normal to the shear plane, and the black arrows denote the liquid velocity vectors. (d,e) Streamlines around a bubble under decompression and compression, with the blue curves representing the actual flows, and the grey dotted lines the pure shear flow. Both sets of streamlines share identical starting points for comparison.

In the absence of volume dilatation, the liquid flows tangentially around the bubble surface with zero normal velocity at the interface (figure 1
a). In this case, the bubble behaves as an inviscid droplet, and the effective shear viscosity of the suspension is governed solely by the bubble shape and void fraction, characterised by
 ${\textit{Ca}}_S$
and
 $\phi _0$
, respectively. The presence of the bubble deflects the liquid streamlines and increases flow resistance, typically resulting in an effective viscosity larger than that of the pure liquid for
 ${\textit{Ca}}_S \lt 1$
(Taylor Reference Taylor1932; Manga et al. Reference Manga, Castro, Cashman and Loewenberg1998).
When the pressure varies, the bubble surface expands or contracts due to volume dilatation, imparting a normal velocity to the surrounding liquid, and allowing streamlines to cross the bubble interface. Specifically, during decompression, the expanding interface drives the external fluid outwards (figure 1
b). Consequently, the imposed shear flow experiences enhanced repulsion in the vicinity of the bubble, leading to increased streamline deflection and stronger flow resistance (figure 1
d), thereby giving rise to a decompression-thickening effect. Conversely, under increasing pressure, the shrinking interface weakens the deflection of the liquid streamlines and reduces the flow resistance relative to the pure shear flow (figures 1
c,e), resulting in a compression-thinning effect. This behaviour is therefore controlled by the rate of bubble volume dilatation, as quantified by the dilatation capillary number
 ${\textit{Ca}}_D$
.
We then quantify the contribution of bubble compressibility to the shear rheology of the suspension. Owing to the relaxation of bubble shape deformation (Frankel & Acrivos Reference Frankel and Acrivos1970), stress relaxation must be accounted for in the shear rheology by applying the operator
 $ ( 1 + \lambda _t\, \mathcal{D}/ \mathcal{D}t )$
to (2.13) (Llewellin et al. Reference Llewellin, Mader and Wilson2002; Mader et al. Reference Mader, Llewellin and Mueller2013; Ohie et al. Reference Ohie, Tasaka and Murai2024), where
 $ \lambda _t = 6\, {\textit{Ca}}_S / 5$
denotes the stress relaxation time. Accordingly, the constitutive equation for the bubble suspension (2.13) can be written as
 \begin{eqnarray} \left \langle \boldsymbol{\tau } \right \rangle + \frac {6}{5} {\textit{Ca}}_S \frac {\mathcal{D} \left \langle \boldsymbol{\tau } \right \rangle }{\mathcal{D}t} = && 2\left ( 1 + \phi \right ) \left \langle \hat {\boldsymbol{e}} \right \rangle + \frac {44}{15} \phi\, {\textit{Ca}}_D \left \langle \hat {\boldsymbol{e}} \right \rangle \nonumber \\ && {}+ {\textit{Ca}}_S \left [ \frac {12}{5} \left ( 1 - \frac {5}{3} \phi \right ) \frac {\mathcal{D} \left \langle \hat {\boldsymbol{e}} \right \rangle }{\mathcal{D}t} + \frac {48}{35} \phi\, \mathcal{L}\left [ \left \langle \hat {\boldsymbol{e}} \right \rangle \boldsymbol{\cdot }\left \langle \hat {\boldsymbol{e}} \right \rangle \right ] \right ]\!, \end{eqnarray}
where the time derivative of the void fraction,
 $\mathrm{d}\phi /\mathrm{d}t = \dot {\mathcal{V}}$
, is included under the dilute approximation, yielding the relation
 ${\textit{Ca}}_S\, \dot {\mathcal{V}} = \phi\, {\textit{Ca}}_D$
. The temporal evolution of the suspension’s rheological properties, including the shear viscosity
 $\mu$
and the first and second normal stress differences
 $N_1$
and
 $N_2$
, then follows directly from the components
 $\tau _{ij}$
of the deviatoric stress
 $\langle \boldsymbol{\tau } \rangle$
.
Specifically, to distinguish the contributions from different mechanisms, the relative viscosity of the suspension (
 $\mu _r = \mu /\mu _l$
) is decomposed as
 \begin{equation} \mu _r = 1 + \Delta \mu _r^0 + \Delta \mu _r^S + \Delta \mu _r^D , \end{equation}
where
 $\Delta \mu _r^0 = \phi$
denotes the deformation-independent viscosity correction derived by Taylor (Reference Taylor1932),
 $\Delta \mu _r^S = -96 \phi\, {\textit{Ca}}_S^2 / (25 + 36\, {\textit{Ca}}_S^2 )$
is the shear-induced viscosity contribution proposed by Frankel & Acrivos (Reference Frankel and Acrivos1970) for a steady simple shear flow with
 $\left \langle \hat {\boldsymbol u} \right \rangle = (y, 0, 0)$
, and
 $\Delta \mu _r^D$
represents the dilatation-induced viscosity correction arising from bubble volume variations. Under time-varying pressure, the time derivatives of the deviatoric stress in (3.1),
 $\partial \tau _{ij} / \partial t$
, must be retained even in a steady shear flow. Accordingly,
 $\Delta \mu _r^D$
is obtained by solving the following system of differential equations for the stress components
 $\tau _{ij}$
:
 \begin{align} \left ( {1 + \frac {6}{5} {\textit{Ca}}_S \frac {\partial }{{\partial t}}} \right ){\tau _{11}} - \frac {6}{5} {\textit{Ca}}_S\, {\tau _{12}} &= \frac {6}{5}\left ( { - 1 + \frac {{37}}{{21}}\phi } \right ) {\textit{Ca}}_S , \end{align}
 \begin{align} \left ( {1 + \frac {6}{5} {\textit{Ca}}_S \frac {\partial }{{\partial t}}} \right ){\tau _{22}} + \frac {6}{5} {\textit{Ca}}_S\, {\tau _{12}} &= \frac {6}{5}\left ( {1 - \frac {{11}}{7}\phi } \right ) {\textit{Ca}}_S , \end{align}
 \begin{align} \left ( {1 + \frac {6}{5} {\textit{Ca}}_S \frac {\partial }{{\partial t}}} \right ){\tau _{33}} &= - \frac {8}{{35}}\phi\, {\textit{Ca}}_S , \end{align}
 \begin{align} \left ( {1 + \frac {6}{5} {\textit{Ca}}_S \frac {\partial }{{\partial t}}} \right ){\tau _{12}} + \frac {3}{5} {\textit{Ca}}_S \left ( {{\tau _{11}} - {\tau _{22}}} \right ) &= 1 + \phi + \frac {{22}}{{15}}\phi\, {\textit{Ca}}_D , \end{align}
where the deviatoric rate-of-strain tensor
 $\langle \hat {\boldsymbol{e}} \rangle$
is replaced by its non-zero components,
 $\hat {e}_{12} = \hat {e}_{21} = 0.5$
. The initial conditions at
 $t=0$
are taken from the analytical solution of (3.1) with
 ${\textit{Ca}}_D = 0$
, corresponding to a pure shear flow (Frankel & Acrivos Reference Frankel and Acrivos1970; Pal Reference Pal2003a
). The relative shear viscosity
 $\mu _r$
is obtained from the dimensionless shear stress
 $\tau _{12}$
, and the dilatation-induced contribution is then evaluated as
 $\Delta \mu _r^D = \mu _r - 1 - \Delta \mu _r^0 - \Delta \mu _r^S$
.
3.1. Constant-rate pressure variations
Referring to the parameter ranges reported in previous experiments on foamy oil displacement and pipeline transport, where significant pressure variations occur (Abivin et al. Reference Abivin, Henaut, Argillier and Moan2009; Or et al. Reference Or, Sasaki, Sugai, Nakano and Imai2016; Sun et al. Reference Sun, Jing, Wu, Xiao and Luo2016; Lü et al. Reference Lü, Han, He, Luo, Chen and Yang2019), we consider
 $\mu _l=5\ \text{Pa}\ \text{s}$
,
 $\varGamma = 50$
 $\mbox{mN}\ \mbox{m}^{-1}$
,
 $ a = 10$
–
 $10^3\ {\unicode{x03BC}} \mbox{m}$
,
 $\dot {\gamma }= 1{-}100$
s
 $^{-1}$
,
 $P = 1{-}10$
 $\mbox{bar}$
, and
 $\left | {{\mathrm{d}P} / {\mathrm{d}t}} \right | \leqslant 3$
 ${\mathrm{bar}}\ {\mathrm{s}}^{-1}$
. These conditions correspond to
 ${\textit{Ca}}_S=10^{-4}{-}10$
and
 ${\textit{Ca}}_D \sim O(10^{-1})$
.
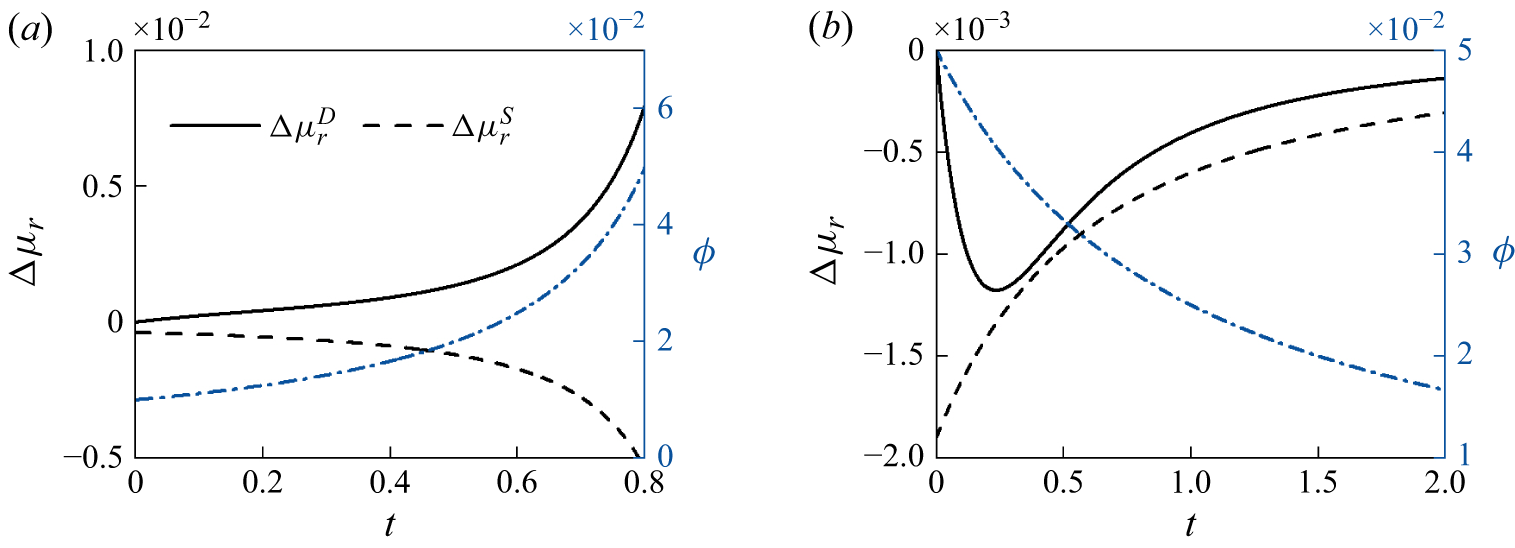
Figure 2 illustrates the temporal evolution of the relative viscosity
 $\mu _r$
for a bubble suspension subjected to a constant shear rate
 $\dot {\gamma }$
and a constant pressure variation rate
 $\mathrm{d}P / \mathrm{d}t$
, under both decompression and compression conditions. The results correspond to an initial state with
 ${\textit{Ca}}_S = |{\textit{Ca}}_D| = 0.1$
. The shear-induced viscosity correction
 $\Delta \mu _r^S$
remains consistently negative throughout the evolution, reflecting a shear-thinning behaviour arising from bubble shape deformation, which reduces flow resistance. In contrast, the dilatation-induced viscosity contribution
 $\Delta \mu _r^D$
exhibits distinct behaviours depending on the compressive state of the flow. Under decompression,
 $\Delta \mu _r^D$
is positive, indicating an increase in flow resistance associated with bubble surface expansion. Under compression, although
 $\Delta \mu _r^D$
initially vanishes at
 $t = 0$
due to the prescribed initial conditions, a compression-thinning effect gradually develops, leading to a decrease of
 $\Delta \mu _r^D$
to negative values. As the void fraction
 $\phi$
decreases, this trend is eventually reversed, and
 $\Delta \mu _r^D$
asymptotically approaches zero. It is worth noting that the magnitudes of both
 $\Delta \mu _r^D$
and
 $\Delta \mu _r^S$
increase with increasing void fraction
 $\phi$
, and they often become comparable. In some cases,
 $\Delta \mu _r^D$
even exceeds
 $\Delta \mu _r^S$
, underscoring that dilatation-induced effects on the shear rheology of bubble suspensions can be as significant as those arising from shear-induced bubble deformation.
Temporal evolution of the viscosity corrections from shear and dilatation,
 $\Delta \mu _r^S$
and
 $\Delta \mu _r^D$
, together with the void fraction
 $\phi$
for bubble suspensions. The initial conditions correspond to (a) decompression flow with
 $\phi _0 = 0.01$
,
 ${\textit{Ca}}_S = {\textit{Ca}}_D = 0.1$
, and (b) compression flow with
 $\phi _0 = 0.05$
,
 ${\textit{Ca}}_S = -{\textit{Ca}}_D = 0.1$
. With the continuous variations of pressure
 $P$
and bubble equivalent radius
 $R$
, the capillary numbers
 ${\textit{Ca}}_S$
and
 ${\textit{Ca}}_D$
were iteratively updated in real time.

Notably, because the theoretical model is restricted to dilute suspensions (
 $\phi \leqslant 5\,\%$
) and small bubble deformations (
 ${\textit{Ca}}_S, {\textit{Ca}}_D \lt 1$
), the absolute magnitudes of both viscosity corrections scale as
 $O(\phi\, \textit{Ca})$
, i.e.
 $O(10^{-2})$
, and therefore remain far below unity. Nevertheless, this reveals a new physical mechanism by which pressure variations induce additional viscosity modifications. The dilatational effect contributes a significant proportion to the overall viscosity variations, indicating that the classical pure shear framework (Frankel & Acrivos Reference Frankel and Acrivos1970) may not fully capture the rheology of bubble suspensions under time-varying pressures. While the current theories, such as those of Einstein (Reference Einstein1905, Reference Einstein1911) and Frankel & Acrivos (Reference Frankel and Acrivos1970), are restricted to small void fractions and weak deformations, their physical implications are generally expected to remain valid at higher void fractions, where the dilatation-induced viscosity correction is likely more pronounced. Experimental observations have confirmed significant viscosity variations at large
 $\phi$
(Llewellin et al. Reference Llewellin, Mader and Wilson2002; Lim et al. Reference Lim, Seo and Youn2004; Joh et al. Reference Joh, Lee and Youn2010; Morini et al. Reference Morini, Chateau, Ovarlez, Pitois and Tocquer2019; Mitrou et al. Reference Mitrou, Migliozzi, Angeli and Mazzei2023), suggesting that the present framework may serve as a theoretical foundation for extending rheological models of bubble dispersions beyond the dilute regime.
The relative viscosity of the suspension at the moment when it reaches
 $\phi = 0.05$
for different
 ${\textit{Ca}}_S$
and
 ${\textit{Ca}}_D$
is presented in figure 3. In general,
 $\mu _r$
decreases with
 ${\textit{Ca}}_S$
and increases with
 ${\textit{Ca}}_D$
, reflecting the distinct physical mechanisms underlying the viscosity corrections induced by pure shear and dilatation. Compared to the viscosity predicted by Frankel’s equation (Frankel & Acrivos Reference Frankel and Acrivos1970), which neglects dilatational effects (
 $\mu _r^F = 1 + \Delta \mu _r^0 + \Delta \mu _r^S$
at
 ${\textit{Ca}}_D = 0$
), the
 $\mu _r$
value predicted by the present model increases with the decompression rate and decreases with the compression rate, highlighting the compression-thinning and decompression-thickening behaviours resulting from the suspension’s dilatational motion due to bubble compressibility. Meanwhile, we present two parameter curves along which the shear viscosity reaches specific values:
 $\mu _r = 1 + \phi$
and
 $\mu _r = 1$
. The former represents the zero-shear viscosity of bubble suspensions predicted by the classical pure shear model (Taylor Reference Taylor1932), while the latter corresponds to the viscosity of the continuous liquid phase. At large
 $|{\textit{Ca}}_D|$
, the dilatation-induced rheological effect can dominate the shear viscosity of the suspension, yielding
 $\mu _r$
values exceeding the classical zero-shear viscosity
 $1+\phi$
under strong decompression, or falling below the viscosity of the liquid matrix, i.e. 1, under strong compression. Within this framework, bubble suspensions exhibit a wide spectrum of flow behaviours, ranging from shear-thinning dominated by interfacial deformation to dilatation-controlled regimes where pressure variations govern the effective viscosity, emphasising the critical role of bubble compressibility in tuning the macroscopic rheology of such systems.
Relative viscosity
 $\mu _r$
of bubble suspensions at the moment when it reaches
 $\phi = 0.05$
at different
 ${\textit{Ca}}_S$
and
 ${\textit{Ca}}_D$
. The solid line (
 $\mu _r^F = 1 + \Delta \mu _r^0 + \Delta \mu _r^S$
) at
 ${\textit{Ca}}_D = 0$
corresponds to the theoretical prediction of Frankel & Acrivos (Reference Frankel and Acrivos1970) for pure shear flow, while the dash-dotted line (
 $\mu _r = 1$
) and the dashed line (
 $\mu _r = 1 + \phi$
) indicate the liquid viscosity and the zero-shear viscosity of bubble suspensions predicted by the classical pure shear model (Taylor Reference Taylor1932), respectively.

3.2. Oscillatory pressure variations
Oscillatory pressures commonly occur in many industrial scenarios (Plesset & Prosperetti Reference Plesset and Prosperetti1977; Ubertini Reference Ubertini2006; Wang, Li & Su Reference Wang, Li and Su2012; Brennen Reference Brennen2014). Under such conditions, the differential form of the constitutive equations (3.3)–(3.6) can be further simplified through the linear method, allowing the rheological properties of the suspension to be expressed analytically. Specifically, assume that the macroscopic pressure
 $P$
oscillates with a dimensionless frequency
 $\omega$
, scaled by the characteristic shear rate
 $\dot {\gamma }$
. The pressure can thus be expressed as
 $P = \bar {P}(1 + \varepsilon _P\, \textrm{e}^{\mathrm{i} \omega t})$
, where
 $\bar {P}$
denotes the steady value, and
 $\varepsilon _P$
represents the relative amplitude of the pressure oscillation. In response to this oscillatory forcing, the suspension’s stress
 $\boldsymbol{\tau }$
evolves at the same frequency and can be written as
 $\boldsymbol{\tau } = \bar {\boldsymbol{\tau }} + \varepsilon _P \tilde {\boldsymbol{\tau }}\, \textrm{e}^{\mathrm{i} \omega t}$
, where
 $\bar {\boldsymbol{\tau }}$
is the steady stress in a basic shear flow, and
 $\tilde {\boldsymbol{\tau }}$
corresponds to the complex amplitude of the oscillatory component. Furthermore, the dimensionless volumetric dilatation rate
 $\dot {\mathcal{V}}$
under this perturbation can be expressed as
 $\dot {\mathcal{V}} = -\phi \varepsilon _P \mathrm{i} \omega\, \textrm{e}^{\mathrm{i}\omega t}$
. Consequently, the dilatation capillary number satisfies
 ${\textit{Ca}}_D = - \varepsilon _P \mathrm{i} \omega\, {\textit{Ca}}_S\, \textrm{e}^{\mathrm{i}\omega t}$
. By substituting these expressions into the differential form of the constitutive equations (3.3)–(3.6), the dilatation-induced viscosity
 $\Delta \mu _r^D$
can be expressed as
 $\Delta \mu _r^D = \varepsilon _P\, \Delta \tilde {\mu }_r^D\, \textrm{e}^{\mathrm{i} \omega t} = \varepsilon _P \left | \Delta \tilde {\mu }_{r}^{D} \right | \textrm{e}^{\mathrm{i} ( \omega t+\psi _\mu )}$
. Here,
 $\left | \Delta \tilde {\mu }_{r}^{D} \right |$
and
 $\psi _\mu$
represent the amplitude and phase shift of the oscillatory viscosity component
 $\Delta \tilde {\mu }_{r}^{D}$
, respectively, which can be analytically derived by
 \begin{equation} \Delta \tilde {\mu }^D_r = \frac {2}{9}\phi _0\frac {\omega ^2 \left ( {{6\, {\textit{Ca}}_S}/{5}} \right ) ^2 \left [ 1+13\left ( {{6\,{\textit{Ca}}_S}/{5}} \right ) ^2 \right ] - \mathrm{i}\omega \left ( {{6\,{\textit{Ca}}_S}/{5}} \right ) \left ( 1+36\,{\textit{Ca}}_{S}^{2} \right ) }{\left [ 1+\left ( {{6\,{\textit{Ca}}_S}/{5}} \right ) ^2 \right ] \left [ 1+\left ( 1-\omega ^2 \right ) \left ( {{6\,{\textit{Ca}}_S}/{5}} \right ) ^2+2\mathrm{i}\omega \left ( {{6\,{\textit{Ca}}_S}/{5}} \right ) \right ]} . \end{equation}
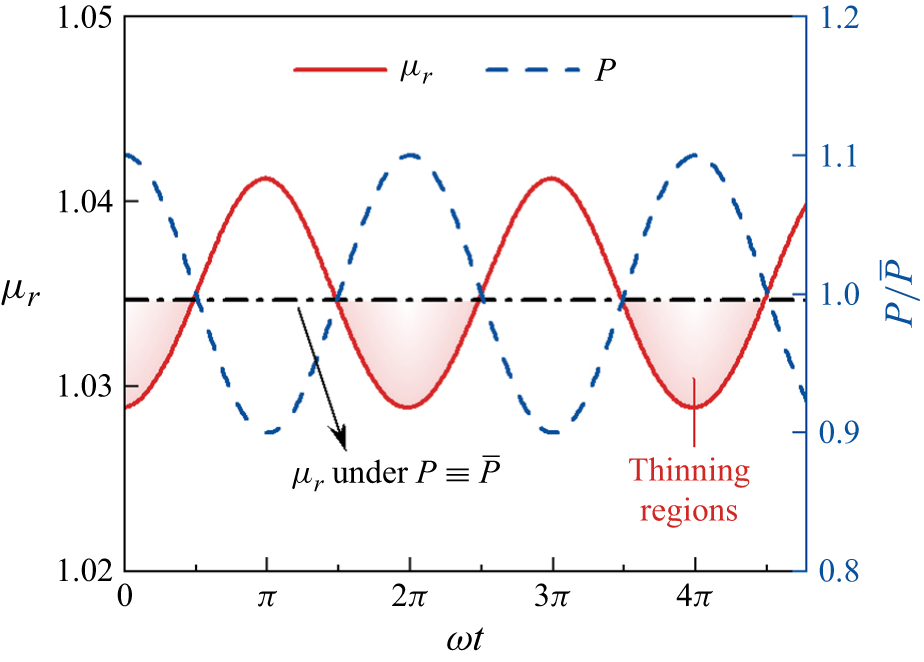
Figure 4 presents the temporal evolution of the relative viscosity
 $\mu _r$
of the bubble suspension under oscillatory pressure. Compared with the constant-pressure case (black dash-dotted line), the viscosity exhibits distinct troughs during each oscillation cycle. These transient thinning events, superimposed on the suspension’s inherent shear-thinning behaviour, further reduce the effective viscosity. This behaviour reveals a potential mechanism for flow drag reduction in highly viscous bubbly flows, and suggests a possible pathway to enhanced flow efficiency in practical applications.
Temporal evolution of relative viscosity
 $\mu _r$
of bubble suspensions under oscillatory pressure
 $P$
with
 ${\textit{Ca}}_S = 0.3$
,
 $\phi _0 = 0.05$
,
 $\varepsilon _P = 0.1$
and
 $\omega = 10$
. The black dash-dotted line represents the viscosity in the absence of pressure oscillation, i.e.
 $P \equiv \bar {P}$
, derived by Frankel’s model (Frankel & Acrivos Reference Frankel and Acrivos1970). The red shading marks the regions where the bubble suspension is thinned.

Based on (3.7), the amplitude of the dilatation-induced viscosity,
 $\left | \Delta \tilde {\mu }_{r}^{D} \right |$
, and its phase shift
 $\psi _\mu$
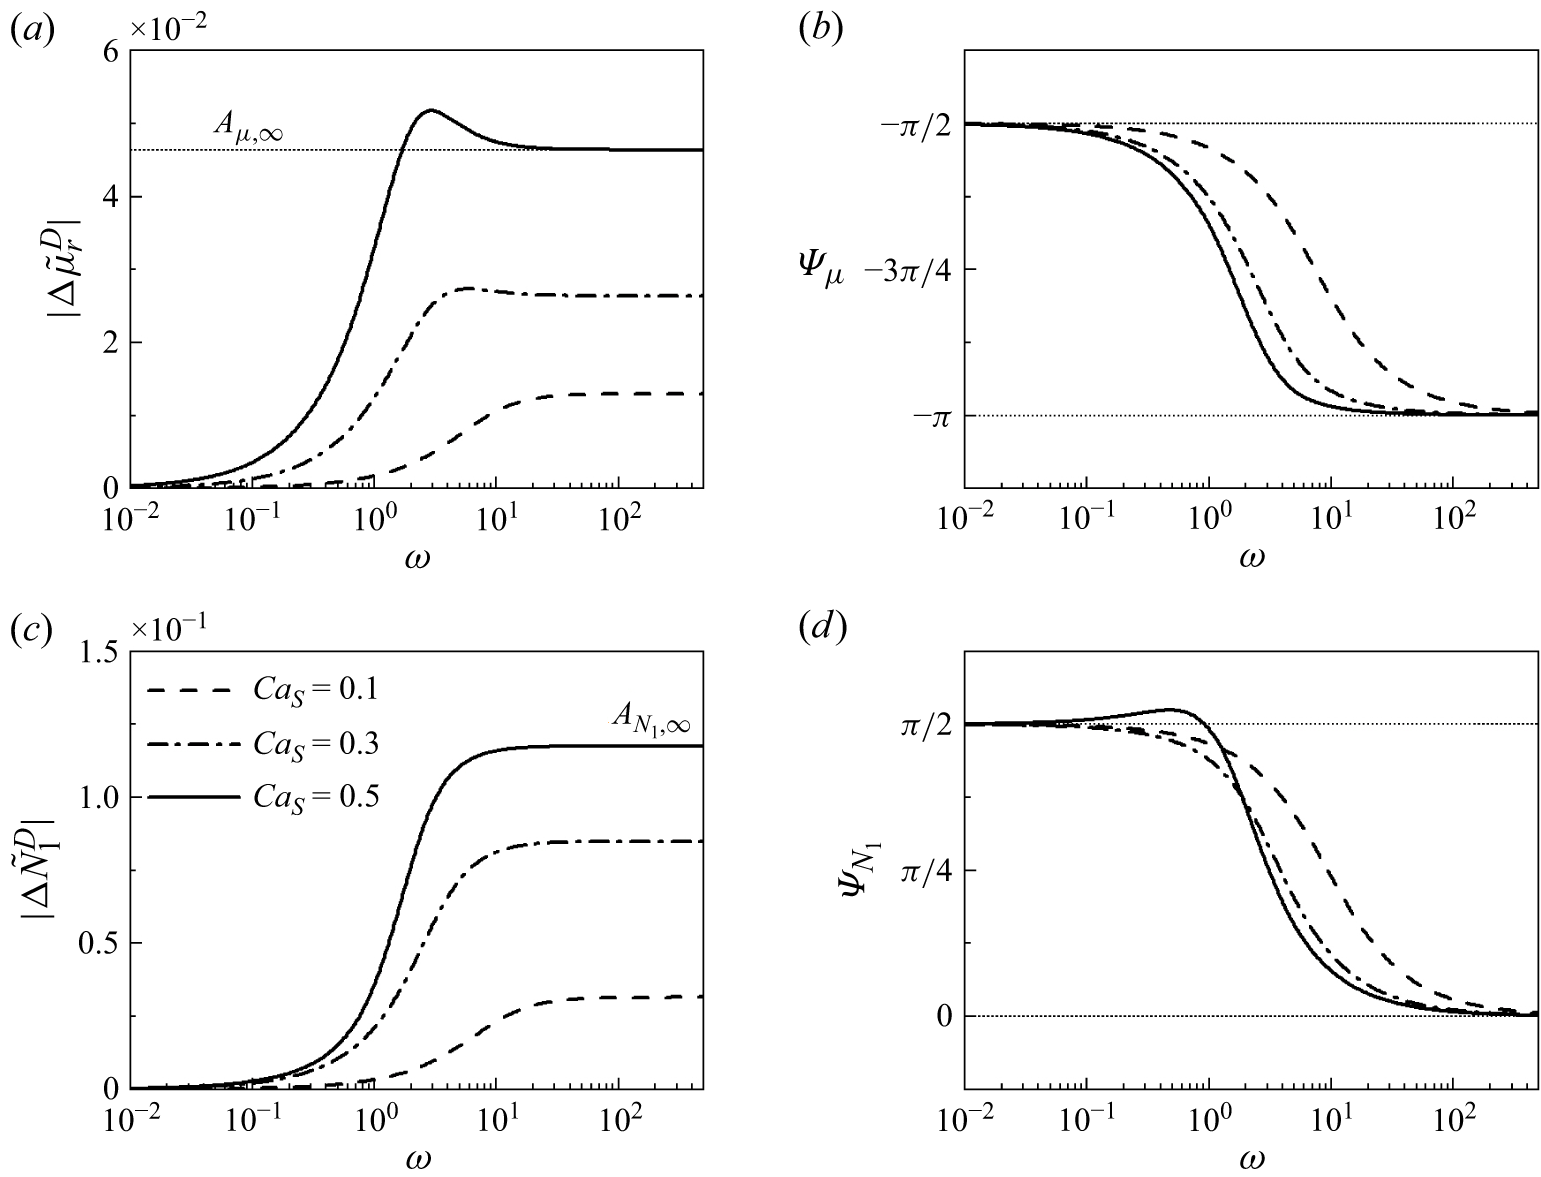
are shown in figures 5(a) and 5(b). Under oscillatory pressure,
 $\left | \Delta \tilde {\mu }_{r}^{D} \right |$
generally increases with the oscillation frequency
 $\omega$
, indicating that the dilatational contribution to the viscosity becomes more pronounced at higher frequencies. When
 $\omega \gg 1$
,
 $\left | \Delta \tilde {\mu }_{r}^{D} \right |$
approaches a limiting value,
 $A_{\mu ,\infty } = (2/9)\phi _0 [1 + 13 (6\,{\textit{Ca}}_S/5)^2 ] / [1 + (6\,{\textit{Ca}}_S/5)^2 ]$
, as also inferred from (3.7). For a given void fraction
 $\phi _0$
, this limiting amplitude increases with the shear capillary number
 ${\textit{Ca}}_S$
, reflecting the enhanced effect of bubble compressibility under stronger shear flows. This trend stems from the dependence of bubble-induced dilatational effects on the bubble shape, which becomes more deformed under higher shear (Rust & Manga Reference Rust and Manga2002a
; Müller-Fischer et al. Reference Murai and Oiwa2008; Barthès-Biesel Reference Barthès-Biesel2016). Consequently, stronger shear amplifies the anisotropy of the surrounding flow and the associated deviatoric stresses, thereby increasing the impact on the suspension’s macroscopic rheology.
Oscillatory components of the dilatation-induced rheology as functions of the macroscopic pressure oscillation frequency
 $\omega$
at different
 ${\textit{Ca}}_S$
values: (a) amplitude
 $|\Delta \tilde {\mu }_r^D |$
and (b) phase shift
 $\psi _\mu$
of the shear viscosity; (c) amplitude
 $|\Delta \tilde {N}_1^D |$
and (d) phase shift
 $\psi _{N_1}$
of the first normal stress difference. The void fraction is set to
 $\phi _0 = 0.05$
. Labels
 $A_{\mu , \infty }$
and
 $A_{N_1, \infty }$
represent the limiting values of
 $|\Delta \tilde {\mu }_r^D |$
and
 $|\Delta \tilde {N}_1^D|$
under high-frequency oscillations for a given
 ${\textit{Ca}}_S$
, respectively.

It should be noted that owing to the simplifications in the expression of bubble pressure (2.12) and the assumption of a low Reynolds number, the present model cannot capture the complex bubble dynamics that arises at higher frequencies. Therefore, the theoretical solution is recommended only for cases where the oscillation frequency
 $\omega$
is much lower than the bubble’s natural frequency
 $\omega _0$
, specifically when
 $\omega \leqslant 0.1\omega _0$
. Further, bubble oscillations at high frequencies may transition towards an adiabatic process rather than the isothermal assumption employed here (Prosperetti Reference Prosperetti1977, Reference Prosperetti1982), which could potentially introduce deviations in the predicted values. A detailed discussion of these limitations is provided in Appendix E.
Regarding the phase shift
 $\psi _\mu$
between the oscillations of the viscosity and the macroscopic pressure
 $P$
,
 $\psi _\mu$
transitions between two limiting values as
 $\omega$
increases. When
 $\omega \ll 1$
, the phase shift approaches
 $-\pi /2$
, indicating that
 $\Delta \tilde {\mu }_r^D$
is out of phase with the time derivative of the pressure,
 $\mathrm{d}P/\mathrm{d}t$
. Conversely, when
 $\omega \gg 1$
,
 $\psi _\mu$
approaches
 $-\pi$
, indicating that
 $\Delta \tilde {\mu }_r^D$
is out of phase with the pressure itself. Since the pressure response of each bubble is representative of that in the dilute system,
 $\psi _\mu$
is independent of the void fraction
 $\phi$
(see (3.7)). Nevertheless, it depends on the shear capillary number
 ${\textit{Ca}}_S$
, with larger
 ${\textit{Ca}}_S$
values shifting the transition of
 $\psi _\mu$
to lower frequencies and enabling the limiting value to be attained earlier.
In addition to the shear viscosity, other rheological properties of the bubble suspensions can also be derived from our constitutive equation (3.1). Specifically, the first normal stress difference is defined from the deviatoric stress tensor as
 $N_1 = \tau _{11} - \tau _{22}$
. Similar to the dilatation-induced viscosity
 $\Delta \mu _{r}^{D}$
, the dilatation-induced contribution to the first normal stress difference under oscillatory pressure can be expressed as
 $\Delta {N}_{1}^{D} = \varepsilon _P\, \Delta \tilde {N}_{1}^{D}\, \textrm{e}^{\mathrm{i} \omega t} = \varepsilon _p \big | \Delta \tilde {N}_{1}^{D} \big | \textrm{e}^{\mathrm{i} ( \omega t+\psi _{N_1} )}$
, with
 \begin{equation} \Delta \tilde {N}_1^D = \frac {4}{9}\phi _0\frac {\mathrm{i}\omega \left ( {{6\,{\textit{Ca}}_S}/{5}} \right ) ^2\left [ 11-13\left ( {{6\,{\textit{Ca}}_S}/{5}} \right ) ^2+12\mathrm{i}\omega \left ( {{6\,{\textit{Ca}}_S}/{5}} \right ) \right ]}{\left [ 1+\left ( {{6\,{\textit{Ca}}_S}/{5}} \right ) ^2 \right ] \left [ 1+\left ( 1-\omega ^2 \right ) \left ( {{6\,{\textit{Ca}}_S}/{5}} \right ) ^2+2\mathrm{i}\omega \left ( {{6\,{\textit{Ca}}_S}/{5}} \right ) \right ]} , \end{equation}
where
 $\big | \Delta \tilde {N}_{1}^{D} \big |$
and
 $\psi _{N_1}$
denote the amplitude and phase shift of
 $\Delta \tilde {N}_{1}^{D}$
, respectively.
The variations of
 $\big | \Delta \tilde {N}_{1}^{D} \big |$
and
 $\psi _{N_1}$
with the oscillation frequency
 $\omega$
are shown in figures 5(c) and 5(d). As illustrated,
 $\big | \Delta \tilde {N}_{1}^{D} \big |$
increases monotonically from zero with increasing
 $\omega$
, eventually approaching a limiting value
 $A_{N_1,\infty } = \phi _0 (32\, {\textit{Ca}}_S / 5) / [1 + (6\, {\textit{Ca}}_S / 5)^2]$
. This limiting amplitude also increases with the shear capillary number
 ${\textit{Ca}}_S$
, provided that
 ${\textit{Ca}}_S \leqslant 5/6$
. The phase shift
 $\psi _{N_1}$
, in contrast, varies over a different range from
 $\psi _\mu$
, transitioning from
 $\pi /2$
to
 $0$
as
 $\omega$
increases. This indicates that
 $\Delta \tilde {N}_{1}^{D}$
is in phase with
 $\mathrm{d}P/\mathrm{d}t$
at low frequencies, and in phase with
 $P$
at high frequencies, exhibiting an overall trend approximately out of phase with
 $\Delta \tilde {\mu }_{r}^{D}$
. Overall, both the oscillation frequency of the macroscopic pressure and the shear intensity in the flow field modulate the elastic response of the bubble suspension.
4. Conclusions
In summary, we have theoretically investigated the shear rheology of dilute bubble suspensions, explicitly accounting for the volume dilatation arising from bubble compressibility. Our constitutive equation reveals, for the first time, a compression-thinning behaviour, characterised by a decreasing shear viscosity upon compression, and an increasing shear viscosity upon decompression. Microscopically, this behaviour stems from the shrinking motion of the bubble surface during compression, which reduces the flow resistance of the surrounding liquid under shear, and vice versa. Our analysis reveals that under time-varying pressures, the dilatation-induced viscosity can become comparable to or even exceed the shear-induced component, particularly at high dilatation capillary numbers or high oscillation frequencies of macroscopic pressure. This suggests that bubble compressibility may play a dominant role in governing the macroscopic rheological response of practical bubbly flows. The simplified expressions derived for oscillatory pressure conditions clearly capture the frequency-dependent amplitude and phase shift of the stress response, providing predictive capability for pressure-modulated rheology. Notably, during oscillation cycles, transient viscosity troughs may fall below the pure shear baseline. When superimposed with shear-thinning, these regions represent a novel pathway for effective drag reduction in highly viscous bubbly flows.
This work highlights the crucial role of microscale interfacial dynamics in controlling the macroscopic rheology of bubble suspensions. Beyond shear viscosity, the proposed constitutive equation can also predict the normal stress differences and other rheological quantities, such as the storage and loss moduli under oscillatory shear flow. We anticipate that the key behaviours identified here, such as compression-thinning and transient viscosity troughs under oscillatory pressure, will persist and may even become more pronounced in dense bubble suspensions or at large capillary numbers. However, analytical treatment of such conditions remains challenging due to complex bubble–bubble interactions and nonlinear deformations, warranting further investigation via experiments and numerical simulations. Moreover, most existing rheology measurements have been performed in simple shear flows without significant pressure variations. It would therefore be of interest to explore the implications of our model through rheology measurements that incorporate rapid pressure changes regarding the complex flows in practical situations.
Acknowledgements
We thank all the reviewers for their constructive comments and suggestions. We also thank J. Shi for his assistance with the numerical calculations.
Funding
This research was supported by the National Natural Science Foundation of China (grant nos 12272026, U2341281, 12502287, 12302326), and the Natural Science Foundation of Beijing Municipality (grant no. L248008).
Declaration of interests
The authors report no conflict of interest.
Appendix A. Solution of Stokes flow in the liquid phase using spherical harmonics
According to the standard solution of the Stokes equations provided by Lamb (Reference Lamb1975), the local velocity of the liquid phase around a bubble,
 $\boldsymbol{u}_l$
, can be expressed as
 \begin{align} {\boldsymbol{u}}_l & = \boldsymbol{U} + \sum \limits _{n = 0}^{ + \infty } { \left [ {\boldsymbol{\nabla }\left (r^{-n-1}{{\mathcal{X}}^l_{n}}\right ) \times \boldsymbol{r} + \boldsymbol{\nabla }\left (r^{-n-1}{{\mathcal{Y}}^l_{n}}\right ) } \right . } \nonumber \\ &\quad \left . {}- \frac {{n - 2}}{{2n\left ( {2n - 1} \right )}}{r^2}\,\boldsymbol{\nabla }\left (r^{-n-1}{{\mathcal{Z}}^l_{n}} \right ) + \frac {{n + 1}}{{n\left ( {2n - 1} \right )}}\boldsymbol{r} \left (r^{-n-1}{{\mathcal{Z}}^l_{n}} \right ) \right ]\!, \end{align}
and the local liquid pressure
 $p_l$
is given by
 \begin{equation} p_l = P + \sum \limits _{n = 1}^{ + \infty } { \left (r^{-n-1}{{\mathcal{Z}}^l_{n}} \right ) }, \end{equation}
where
 $\mathcal{X}^l_n$
,
 $\mathcal{Y}^l_n$
and
 $\mathcal{Z}^l_n$
denote the spherical surface harmonics of order
 $n$
. Using a perturbation approach (Cox Reference Cox1969; Frankel & Acrivos Reference Frankel and Acrivos1970), the velocity, pressure, stress and associated surface harmonics can be expanded into
 $O(1)$
and
 $O(Ca)$
components. For example,
 $ \boldsymbol{u} = \bar {\boldsymbol{u}} + {\textit{Ca}}_S\, \tilde {\boldsymbol{u}}_S + {\textit{Ca}}_D\, \tilde {\boldsymbol{u}}_D$
. Based on this expansion, the three types of harmonics can be solved analytically by exploiting the orthogonality relations between different orders.
First, the zeroth-order harmonics satisfy the relationships
 \begin{align}&\,\, \frac {\mathcal{Y} _{0}^{l}}{R^3} = - \frac {1}{R}\frac {\mathrm{d}R}{\mathrm{d}t} = - \frac {1}{3} \left ( \boldsymbol{\nabla }\boldsymbol{\cdot }\boldsymbol{u}_g \right )\!, \end{align}
 \begin{align}& p_g = P\left ( t \right ) +2\,{\textit{Ca}}_{S}^{-1}\frac {1}{R} + \frac {4}{R}\frac {\mathrm{d}R}{\mathrm{d}t} , \end{align}
where these equations respectively describe the balance of normal velocity and normal stress at the interface of an equivalent spherical bubble. According to mass conservation and the ideal gas equation of state under the isothermal assumption, the bubble radius
 $R$
is determined by the internal pressure, such that
 $p_g R^3$
remains equal to its initial value
 $\left . p_g \right |_{t=0}$
. Hence
 $\mathcal{Y}_{0}^{l}$
or
 $\boldsymbol{\nabla }\boldsymbol{\cdot }\boldsymbol{u}_g$
, which represents the volumetric dilatation rate of a single bubble, can be obtained accurately by solving the coupled differential equations above. At sufficiently high pressures, where the capillary and viscous stresses at the bubble surface are negligible (see Appendix E), the bubble pressure
 $p_g$
approximately equals the macroscopic pressure
 $P$
, yielding
 $\boldsymbol{\nabla }\boldsymbol{\cdot }\boldsymbol{u}_g = - {\mathrm{d}P} / (P\,\mathrm{d} t)$
.
Then the relationships among the second-order harmonics can be derived as
 \begin{equation} {\boldsymbol{Y}}^{l} = {\textit{Ca}}_S \left ( \frac {2}{15} \frac {\mathcal{D} \boldsymbol{E}}{\mathcal{D}t} - \frac {2}{45} \mathcal{L}\left [ \boldsymbol{E} \boldsymbol{\cdot }\boldsymbol{E} \right ] \right ) + {\textit{Ca}}_D \left ( - \frac {8}{45} \boldsymbol{E} \right ) \end{equation}
and
 \begin{eqnarray} {\boldsymbol{Z}}^{l} = -\frac {2}{3} \boldsymbol{E} + {\textit{Ca}}_S \left ( \frac {32}{15} \frac {\mathcal{D} \boldsymbol{E}}{\mathcal{D}t} - \frac {48}{105} \mathcal{L}\left [ \boldsymbol{E} \boldsymbol{\cdot }\boldsymbol{E} \right ] \right ) + {\textit{Ca}}_D \left ( - 2 {\mathcal{F}}_0^D \boldsymbol{E} - \frac {8}{45} \boldsymbol{E} \right )\!, \end{eqnarray}
where the second-order harmonics are fully characterised by their corresponding tensorial coefficients, namely
 ${\mathcal{Y}}_2^{l} = 3 {\boldsymbol{Y}}^{l} \boldsymbol{:} \boldsymbol{rr} r^{-2}$
and
 ${\mathcal{Z}}_2^{l} = 3 {\boldsymbol{Z}}^{l} \boldsymbol{:} \boldsymbol{rr} r^{-2}$
. All odd-order harmonics vanish owing to symmetry, and harmonics of order higher than 2 are negligible compared with the zeroth- and second-order contributions.
Appendix B. Solution for the gas velocity inside a bubble using spherical harmonics
The velocity potential
 ${\varPhi }_g$
for the inviscid gas is introduced to describe the velocity field inside the bubble, such that
 $\boldsymbol{\nabla }{ {\varPhi } _g} = {\boldsymbol{u}_g}$
. Consequently, the velocity potential satisfies
 \begin{equation} {\boldsymbol{\nabla} ^2}{ {\varPhi } _g} = - \frac {1}{{{p_g}}}\frac {{\mathrm{d} {p_g}}}{{\mathrm{d} t}} . \end{equation}
We assume that the solution of this non-homogeneous differential equation (B1) can be expressed as the sum of a homogeneous solution
 $\theta _g$
and a particular solution
 $\vartheta _g$
, namely,
 \begin{equation} { {\varPhi } _g} = {\theta _g} + {\vartheta _g}, \end{equation}
where
 ${\boldsymbol{\nabla} ^2}{\theta _g} = 0$
and
 ${\boldsymbol{\nabla} ^2}{\vartheta _g} = -\mathrm{d}p_g / (p_g\, \mathrm{d}t)$
. According to the solution of the Laplace equation (Lamb Reference Lamb1975), the homogeneous solution
 $\theta _g$
can be directly expressed in terms of spherical surface harmonics, i.e.
 $\theta _g = \varSigma {r^n} \mathcal{Y} _n^g$
(
 $n \geqslant 0$
). Meanwhile, since the pressure inside the bubble is spatially uniform, i.e.
 $\boldsymbol{\nabla }p_g = 0$
, the particular solution
 $\vartheta _g$
can be written as
 $- r^2\, \mathrm{d} p_g / (6 p_g\, \mathrm{d}t)$
. Therefore, the gas velocity inside the bubble can be expressed as
 \begin{equation} {\boldsymbol{u}_g} = - \frac {1}{{6{p_g}}}\frac {{\mathrm{d}{p_g}}}{{\mathrm{d}t}}\boldsymbol{\nabla }{r^2} + \sum \limits _{n = 0}^{ + \infty } {\boldsymbol{\nabla }\left ( {r^n} \mathcal{Y} _n^g \right )}. \end{equation}
By applying the perturbation method described in Appendix A, we find that
 $\mathcal{Y}_n^g = 0$
for
 $n \ne 2$
, and that
 ${\mathcal{Y}}_2^{g} = 3 {\boldsymbol{Y}}^{g} \boldsymbol{:} \boldsymbol{rr} r^{-2}$
, where
 \begin{equation} {\boldsymbol{Y}}^g = {\textit{Ca}}_D \left ( -\frac {1}{9} \boldsymbol{E} \right )\!. \end{equation}
Appendix C. Sum of the principal curvatures of the bubble surface
According to the tensor analysis method (McConnell Reference McConnell2014), the sum of the principal curvatures of the bubble surface can be expressed as
 \begin{align} R_1^{-1} + R_2^{-1} & = 2 -2 \varSigma \textit{Ca} f - \varSigma \textit{Ca} f_{,kk} \nonumber \\ &\quad {}+ 2 ( \varSigma \textit{Ca} f )^2 + 2 ( \varSigma \textit{Ca} f ) ( \varSigma \textit{Ca} f_{,\textit{kk}} ) + O ( {\textit{Ca}} ^3 ), \end{align}
where
 $\varSigma \textit{Ca} f$
represents any small deformation of the bubble surface relative to a unit sphere (
 $r=1$
). The comma subscript and
 $kk$
denote the differentiation operator and the Einstein summation convention, respectively, following standard tensor notation.
The above expression can be further rewritten in terms of spherical surface harmonics, yielding
 \begin{align} R_1^{-1}+R_2^{-1} & = 2 + 4\, {\textit{Ca}}_S\, \mathcal{F}_2^S + {\textit{Ca}}_D \sum _{n=0}^{+\infty }{( n^2+n-2 ) \mathcal{F}_{n}^{D}} \nonumber \\ &\quad {}- 10\, {\textit{Ca}}_{S}^{2}\, ( \mathcal{F}_2^S )^2 - 2\, {\textit{Ca}}_S\, {\textit{Ca}}_D\, \mathcal{F}_2^S \sum _{n=0}^{+\infty }{( n^2+n+4 ) \mathcal{F}_{n}^{D}} \nonumber \\ &\quad {}- 2 \,{\textit{Ca}}_{D}^{2} \sum _{n=0}^{+\infty }{\mathcal{F}_{n}^{D}} \sum _{n=0}^{+\infty }{( n^2-n-1 ) \mathcal{F}_{n}^{D}} + O( {\textit{Ca}}^3 ), \end{align}
where the relation
 $\mathcal{F}_{n,kk} = -n(n+1)\mathcal{F}_n$
follows directly from the Laplace equation evaluated at
 $r=1$
.
Appendix D. Equation of the bubble surface
In Frankel’s model (Frankel & Acrivos Reference Frankel and Acrivos1970), the bubble shape under pure shear is described by
 $r = f^{(0)} = 1 + {\textit{Ca}}_S\, \mathcal{F}^S_2 = 1 + 3\, {\textit{Ca}}_S\, {\boldsymbol{F}}^S\boldsymbol{:}\boldsymbol{rr} r^{-2}$
, where
 \begin{equation} {\boldsymbol{F}}^S + \frac {6}{5} {\textit{Ca}}_S \frac { \mathcal{D} {\boldsymbol{F}}^S }{\mathcal{D} t} = \frac {2}{3} \boldsymbol{E} + \frac {128}{105} {\textit{Ca}}_S\, \mathcal{L} \left [ \boldsymbol{E} \boldsymbol{\cdot }\boldsymbol{E} \right ] . \end{equation}
When a time-varying macroscopic pressure
 $P$
is present, the additional deformation
 ${\textit{Ca}}_D\, f_D$
induced by bubble compressibility can be expressed as the sum of the zeroth- and second-order surface harmonics,
 ${\textit{Ca}}_D\, \mathcal{F}_0^D$
and
 ${\textit{Ca}}_D\, \mathcal{F}_2^D$
, which respectively correspond to the volumetric dilatation and the additional shape deformation of the bubble. For the former,
 $\mathcal{F}_0^D$
is directly related to the equivalent radius
 $R$
, given by
 $R = \sqrt [3]{ {\left . P \right |_{t=0}}/{P} }$
. For the latter, the coefficient tensor of
 $\mathcal{F}_2^D$
is governed by
 \begin{equation} {\boldsymbol{F}}^D + \frac {6}{5}{\textit{Ca}}_S\frac {\partial {\boldsymbol{F}}^D}{\partial t} = \frac {4}{3} {\textit{Ca}}_D\, {\mathcal{F}}_0^D \boldsymbol{E} - \frac {4}{15} {\textit{Ca}}_D\, \boldsymbol{E}. \end{equation}
From (D1) and (D2), it can be seen that the leading contribution is determined by the
 $O(1)$
term in (D1), namely
 $2\boldsymbol{E}/3$
, while the relaxation time
 $\lambda _t$
depends solely on the shear capillary number, i.e.
 $\lambda _t = 6\,{\textit{Ca}}_S/5$
. Consequently, the bubble shape remains primarily governed by the shear effect in the flow field (see figure 1 in the main text).
For simplicity, these differential equations can be further simplified using the successive substitution method (Frankel & Acrivos Reference Frankel and Acrivos1970), since the magnitudes of the time-derivative terms in (D1) and (D2) are typically smaller than unity. This yields
 \begin{align} {\boldsymbol{F}}^S &= \frac {2}{3} \boldsymbol{E} + {\textit{Ca}}_S \left ( - \frac {4}{5} \frac {\mathcal{D} \boldsymbol{E}}{\mathcal{D} t} + \frac {128}{105} \mathcal{L} \left [ \boldsymbol{E} \boldsymbol{\cdot }\boldsymbol{E} \right ] \right ) + O({\textit{Ca}}^2), \end{align}
 \begin{align} {\boldsymbol{F}}^D &= \frac {4}{3} {\textit{Ca}}_D\, {\mathcal{F}}_0^D \boldsymbol{E} - \frac {4}{15} {\textit{Ca}}_D\, \boldsymbol{E} + O({\textit{Ca}}^2). \end{align}
Finally, the equation of the bubble surface can be written as
 \begin{equation} r = 1 + {\textit{Ca}}_S \left ( 3 {\boldsymbol{F}}^S \boldsymbol{:} \boldsymbol{rr} r^{-2} \right ) + {\textit{Ca}}_D \left ( \mathcal{F}^D_0 + 3 {\boldsymbol{F}}^D \boldsymbol{:} \boldsymbol{rr} r^{-2} \right )\!. \end{equation}
Appendix E. Influence of bubble dynamics
In the main text, the last two terms on the right-hand side of the normal stress balance equation (A4) are neglected based on the following arguments. For a bubble with radius larger than
 $10$
 ${\unicode{x03BC}}$
m in a liquid with interfacial tension
 $\varGamma \leqslant O(10^{-1})\ \text{N}\ \text{m}^{-1}$
, the interfacial stress
 $2\varGamma /R$
does not exceed
 $O(10^{4})\ \text{N}\ \text{m}^{-2}$
. Meanwhile, (A4) shows that the dimensionless viscous stress
 $4\, {\mathrm{d}R} / (R\, \mathrm{d}t)$
, which is of
 $O(1)$
, is always smaller than the interfacial stress
 $2/({\textit{Ca}}_S\, R)$
, of
 $O({\textit{Ca}}^{-1}_S)$
, due to the small deformation assumption (
 ${\textit{Ca}}_S \lt 1$
). Under these conditions, even when the macroscopic pressure
 $P$
is as low as 1 atm (
 $10^5$
Pa), it remains much larger than the other terms on the right-hand side of (A4). Consequently, we assume that the gas pressure inside the bubble,
 $p_g$
, is equal to the macroscopic pressure
 $P$
, which enables us to derive the theoretical expressions for the shear viscosity.
To assess the limitations of this simplification, we recalculate the radius variation of a single bubble subjected to an oscillatory pressure field using the Rayleigh–Plesset (R–P) equation (Plesset & Prosperetti Reference Plesset and Prosperetti1977), which fully accounts for the effects of inertia, viscous stress, surface tension, and the pressure difference between the gas and liquid phases. Based on this solution, we numerically evaluate the dilatation-induced viscosity, and compare the results with the theoretical predictions.
The dimensionless form of the R–P equation is given by
 \begin{equation} \textit{Re} \left [ R \frac {\mathrm{d}^2R}{\mathrm{d}t^2} + \frac {3}{2}\left ( \frac {\mathrm{d}R}{\mathrm{d}t} \right )^2 \right ] = p_g - P - 2\,{\textit{Ca}}_{S}^{-1}\frac {1}{R} - \frac {4}{R}\frac {\mathrm{d}R}{\mathrm{d}t} , \end{equation}
where
 $\textit{Re} = \rho a^2 \dot {\gamma } / \mu _l$
denotes the Reynolds number.
Additionally, the gas inside the bubble is assumed to obey a polytropic equation of state
 $p_g R^{3 k} = \left . p_g \right |_{t=0}$
, where
 $k$
denotes the polytropic exponent, with
 $k = 1.0$
corresponding to the isothermal process adopted in the main text, and
 $k = 1.4$
corresponding to the adiabatic process.
Once the temporal evolution of the bubble radius
 $R(t)$
is obtained from (E1), the volumetric dilatation rate of a single bubble,
 $\boldsymbol{\nabla }\boldsymbol{\cdot }\boldsymbol{u}_g$
, can be evaluated from (A3), yielding a value equal to
 $3\,\mathrm{d}R/ (R\,\mathrm{d}t)$
. Owing to the comprehensive nature of the R–P equation, this quantity is expected to provide more accurate predictions than those based on the simplified relation in (2.12). The volumetric dilatation rate of the suspension,
 $\dot {\mathcal{V}}$
, and the corresponding dilatation capillary number
 ${\textit{Ca}}_D = \mu _l a \dot {\mathcal{V}} / (\varGamma \phi )$
employed in the constitutive model can then be updated accordingly. Unlike the linearised analytical solution presented in § 3.2, the resulting dilatation capillary number
 ${\textit{Ca}}_D$
is substituted directly into the differential constitutive equations (3.3)–(3.6), which are subsequently solved numerically.
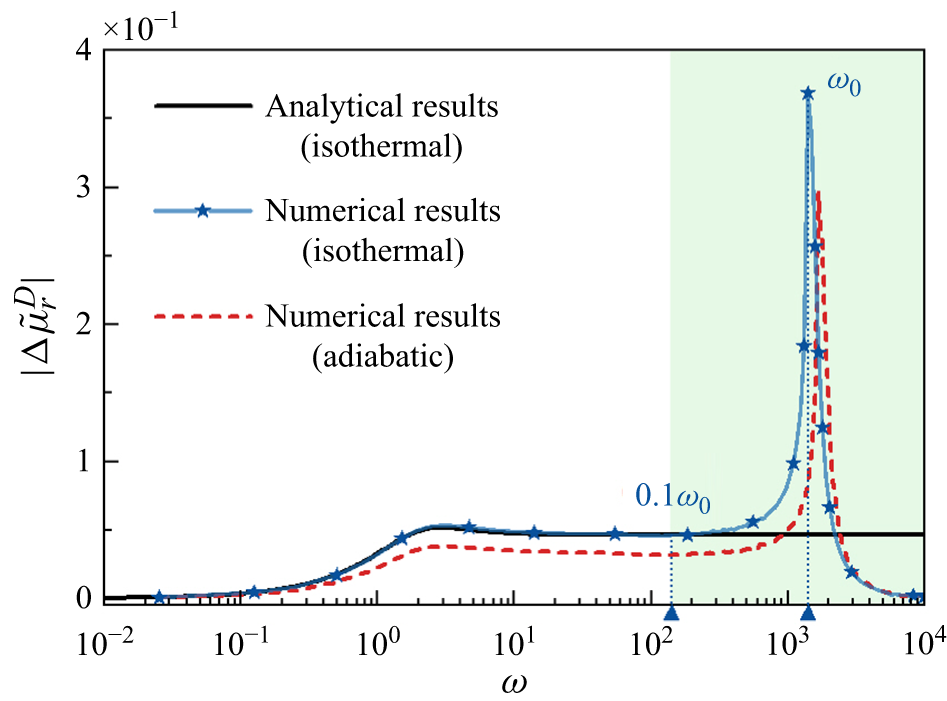
Figure 6 compares the amplitude of the dilatation-induced viscosity,
 $\left | \Delta \tilde {\mu }_{r}^{D} \right |$
, obtained from the present numerical approach (based on the R–P equation) with the analytical prediction given by (3.7) and figure 5(a) in § 3.2. Under the isothermal assumption (
 $k = 1.0$
), it is observed that when the oscillation frequency
 $\omega$
of the macroscopic pressure approaches the bubble’s natural frequency
 $\omega _0$
, the bubble exhibits pronounced resonance behaviour, resulting in a sharp increase in the oscillation amplitude of the dilatation-induced viscosity. This resonance onset occurs at approximately
 $\omega = 0.1 \omega _0$
. Within the range
 $0.1\omega _0 \leqslant \omega \lt \omega _0$
,
 $\left | \Delta \tilde {\mu }_{r}^{D} \right |$
increases rapidly. Once
 $\omega$
exceeds
 $\omega _0$
,
 $\left | \Delta \tilde {\mu }_{r}^{D} \right |$
decreases sharply and eventually approaches zero. The deviation from the theoretical prediction at higher frequencies likely arises from the inertial contribution in the bubble dynamic equation (A4) at high oscillation frequencies. However, the comparison demonstrates excellent agreement between the analytical model and the numerical results based on the R–P equation for
 $\omega \leqslant 0.1\omega _0$
, with deviations remaining below 5 %. Therefore, the theoretical model is applicable primarily for
 $\omega \leqslant 0.1\omega _0$
, whereas predictions at higher frequencies should rely on more comprehensive bubble dynamic models or direct numerical simulations.
Comparison of the amplitude of the dilatation-induced viscosity obtained using two different approaches. The analytical results are derived from (3.7), whereas the numerical results are obtained by solving the R–P equation together with the differential constitutive equations (3.3)–(3.6). The frequency
 $\omega _0$
corresponding to the peak amplitude represents the natural frequency of the bubble (Strasberg Reference Strasberg1956), which is identical to the classical theoretical prediction,
 $\omega _0 = \dot {\gamma }^{-1} \sqrt {(3 k P+4\varGamma /a) / (\rho _l a^2)}$
. Here,
 $\rho _l = 1000$
kg m
 $^{-3}$
,
 $a = 1$
mm,
 $P = 5$
bar,
 $\varGamma = 50$
mN m−1, and
 $\dot \gamma = 25$
s
 $^{-1}$
. The polytropic exponent is taken as
 $k = 1.0$
and
 $k = 1.4$
, corresponding to the isothermal and adiabatic processes, respectively. The shear capillary number and void fraction are set to
 ${\textit{Ca}}_S = 0.5$
and
 $\phi _0 = 0.05$
, respectively, consistent with values used in figure 5.

Nevertheless, according to the dimensional expression
 $\omega _0 = \sqrt {(3 k P + 4\varGamma / a) / (\rho _l a^2)}$
(Strasberg Reference Strasberg1956), the natural frequency of a millimetre-scale bubble typically lies within the range
 $O(10^3{-}10^4)$
Hz, and it can be even higher for smaller bubbles or under elevated macroscopic pressures. Therefore, the condition
 $\omega \leqslant 0.1\omega _0$
corresponds, in practice, to a relatively broad frequency range, rendering the present theoretical framework applicable to a wide spectrum of industrial and practical scenarios.
When the pressure oscillation frequency is sufficiently high, bubbles do not have enough time to exchange heat with the surrounding liquid, and therefore tend to undergo adiabatic oscillations (Prosperetti Reference Prosperetti1977, Reference Prosperetti1982). Under this assumption, we numerically evaluated
 $\left | \Delta \tilde {\mu }_{r}^{D} \right |$
for adiabatic bubble dynamics (red dashed line in figure 6). Compared with the isothermal results,
 $\left | \Delta \tilde {\mu }_{r}^{D} \right |$
exhibits a qualitatively similar dependence on
 $\omega$
, indicating that the emergence of the dilatation-induced viscosity is largely insensitive to the specific form of the gas equation of state for
 $\omega \leqslant 0.1\omega _0$
. The difference in
 $\left | \Delta \tilde {\mu }_{r}^{D} \right |$
between adiabatic and isothermal bubble oscillations is approximately 25 %, suggesting a limited influence of the thermodynamics on the bubble suspensions. Consequently, the conclusions regarding dilatation-induced viscosity presented in the main text remain valid for the adiabatic process.
Nevertheless, for a precise evaluation of the shear viscosity of bubble suspensions in practical applications, it may still be necessary to identify the thermodynamic process that best represents bubble oscillations, and to adjust the velocity divergence
 $\boldsymbol{\nabla }\boldsymbol{\cdot }\boldsymbol{u}_g$
accordingly in (2.4). Notably, under the adiabatic assumption, a resonance similar to that in the isothermal case occurs near the bubble’s natural frequency
 $\omega _0$
, which shifts slightly to higher frequencies due to the increase in the polytropic exponent
 $k$
.