INTRODUCTION
Geomorphologists have long sought to understand how hillslope erosion rates and processes affect the evolution of the life supporting zone (i.e., the “critical zone”; Brantley et al., 2007) extending from the tops of trees to the depth of weathered bedrock (e.g,. McGuire et al., Reference McGuire, Pelletier and Roering2014; West et al., Reference West, Kirby, Bierman and Clarke2014; Foster et al., Reference Foster, Anderson, Wyshnytzky, Ouimet and Dethier2015; Yetemen et al., Reference Yetemen, Istanbulluoglu, Flores‐Cervantes, Vivoni and Bras2015). Slope aspect is a major source of topographic variability in microclimate, critical zone properties, and landforms (Powell, Reference Powell1874; Gilbert, Reference Gilbert1904; Tuck, Reference Tuck1935; Hack and Goodlet, Reference Hack and Goodlett1960; Melton, Reference Melton1960; Dohrenwend, Reference Dohrenwend1978; Wende, Reference Wende1995; Gutiérrez-Jurado et al., Reference Gutiérrez‐Jurado, Vivoni, Istanbulluoglu and Bras2007; Burnett et al., Reference Burnett, Meyer and McFadden2008; Istanbulluoglu et al., Reference Istanbulluoglu, Yetemen, Vivoni, Gutiérrez‐Jurado and Bras2008; Yetemen et al., Reference Yetemen, Istanbulluoglu, Flores‐Cervantes, Vivoni and Bras2015). Aspect-related land surface variability reflects how the critical zone responds to persistent climate differences caused by aspect-induced insolation and temperature variability (Istanbulluoglu et al., Reference Istanbulluoglu, Yetemen, Vivoni, Gutiérrez‐Jurado and Bras2008; Yetemen et al., Reference Yetemen, Istanbulluoglu, Flores‐Cervantes, Vivoni and Bras2015). Systematic mapping of aspect-related differences in slope angles across the American Cordillera (60°N to 60°S) revealed that aspect-induced slope asymmetry is widespread and highly variable, displaying patterns across latitudes, elevations, and mountain ranges (Poulos et al., Reference Poulos, Pierce, Flores and Benner2012). Understanding how aspect affects erosion and landscape evolution across a range of environments is fundamentally important to critical zone science.
Valleys are natural laboratories for studying aspect-driven feedbacks because many complicating factors, such as lithology, regional climate, and changes in base level, can be assumed constant for adjacent slopes. Within asymmetric valleys, opposing valley sides appear to have experienced different amounts of land surface degradation, but it is often unclear whether valley asymmetry is a relict feature or actively developing. The few studies that have investigated timings and rates of valley asymmetry development have produced contrasting results (e.g., Istanbulluoglu et al., Reference Istanbulluoglu, Yetemen, Vivoni, Gutiérrez‐Jurado and Bras2008; McGuire et al., Reference McGuire, Pelletier and Roering2014; West et al., Reference West, Kirby, Bierman and Clarke2014; Foster et al., Reference Foster, Anderson, Wyshnytzky, Ouimet and Dethier2015). Erosion rates over 103–105 yr timescales vary with aspect in some environments (e.g., Foster et al., Reference Foster, Anderson, Wyshnytzky, Ouimet and Dethier2015), but not in others, despite aspect-related differences in landforms (West et al., Reference West, Kirby, Bierman and Clarke2014).
Alluvial fans produced by small steep north- and south-facing catchments, on either side of larger asymmetric valleys, provide an opportunity for understanding how aspect influences catchment sediment yields, fan deposition, and landscape evolution. Episodic aggradation and incision of alluvial fans have been documented worldwide and many authors have indicated that alluvial fans are sensitive recorders of climatic and tectonic change (e.g., Bull, Reference Bull1977, Reference Bull1991; Ritter et al., 1993). Over Quaternary timescales, studies of alluvial fan evolution in the tectonically active areas of the western United States show that, while tectonism produces and maintains the relief needed for fans to form, episodes of fan aggradation and incision are commonly caused by Quaternary climate change (Bull, Reference Bull1991; Ritter et al., 1993). Sediment deposition on alluvial fans fundamentally reflects rates of erosion and sediment export from source catchments (Meyer and Pierce, Reference Meyer and Pierce2003; Pierce et al., Reference Pierce, Meyer and Jull2004; Nelson and Pierce, Reference Nelson and Pierce2010; Riley et al., Reference Riley, Pierce and Meyer2015).
Despite advances in dating alluvial fan deposits, such as radiocarbon dating and optically stimulated luminescence, alluvial fans have been underutilized for estimating volumetric deposition rates, in part because they are often dissected, requiring reconstruction of deposit volumes, and because fans may not capture or retain all sediment produced from source catchments (Riley, Reference Riley2012; Riley et al., Reference Riley, Pierce and Meyer2015). Additionally, sediment-transporting flows may redeposit sediment in previously dissected areas, resulting in cut-and-fill cycles that make total sediment budgets difficult to assess. Sediment bypassing alluvial fans, or remobilized from alluvial fan deposits, leads to an underestimation of source-catchment erosion rates. As such, while alluvial fan deposition rates reflect erosion rates, they underestimate the total erosion. Nevertheless, alluvial fans can still be useful for comparing the relative amounts of erosion and deposition among neighboring catchments if there is no bias in the amount of sediment bypassing the alluvial fans, which can be partially assessed from modern fluvial processes and dissection of landforms.
Small, steep catchments in arid or semi-arid climates are ideal for utilizing alluvial fans as records of erosion and deposition, because they generally lack the precipitation and drainage area to produce regularly recurring fluvial erosion, which tends to bypass fans. Rather, these catchments often erode rapidly following episodic destabilizing events such as fire, rain-on-snow flooding, and/or cloudburst flash floods, which produce sediment-rich flows that deposit alluvial fans where catchments meet trunk streams. In semi-arid steep montane terrain, episodic and large erosional fire-related events account for the bulk of the time-averaged sediment yields during the Holocene (Meyer et al., Reference Meyer, Pierce, Wood and Jull2001; Meyer and Pierce, Reference Meyer and Pierce2003; Riley et al., Reference Riley, Pierce and Meyer2015; Orem and Pelletier, Reference Orem and Pelletier2016). Catchments that primarily erode during extreme events deposit a large amount of the total exported sediment as alluvial fans at their outlets, providing comprehensive records of deposition. Using alluvial fans to study erosion rates is not always appropriate, such as in large perennially flowing watersheds that transport most sediment past alluvial fans, and/or wet environments that experience regularly recurring stream flow.
In a semi-arid montane region of the southwestern Idaho Batholith, we coupled radiocarbon dating of alluvial fan deposits with fan surface reconstructions to estimate volumetric rates of fan deposition, which, when normalized by source-catchment area, reflect catchment-averaged denudation. We compare the fan deposition rates of small (<0.5 km2), steep (30–35°), fire-prone, ephemerally-flowing headwater catchments incised into larger-scale north- and south-facing valley sides, on the opposite sides of ~1.2-km-wide asymmetric valleys (Fig. 1 and 2), to assess the influence of aspect-induced differences in climate on alluvial fan deposition. We calculated differences between reconstructed and dissected surfaces to quantify alluvial fan dissection and assess potential biases in sediment retention. We measured total catchment incision to assess differences in erosion over longer timescales.
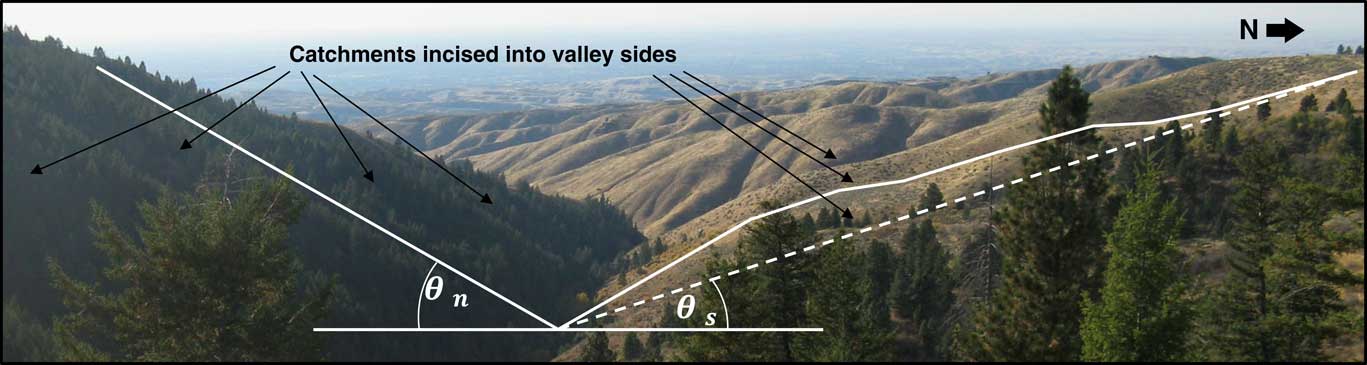
(color online) Aspect-related variability in vegetation cover and landforms in the Dry Creek Experimental Watershed (DCEW). Note asymmetries in hillslope steepness, ridgeline linearity, land surface length, and vegetation cover.

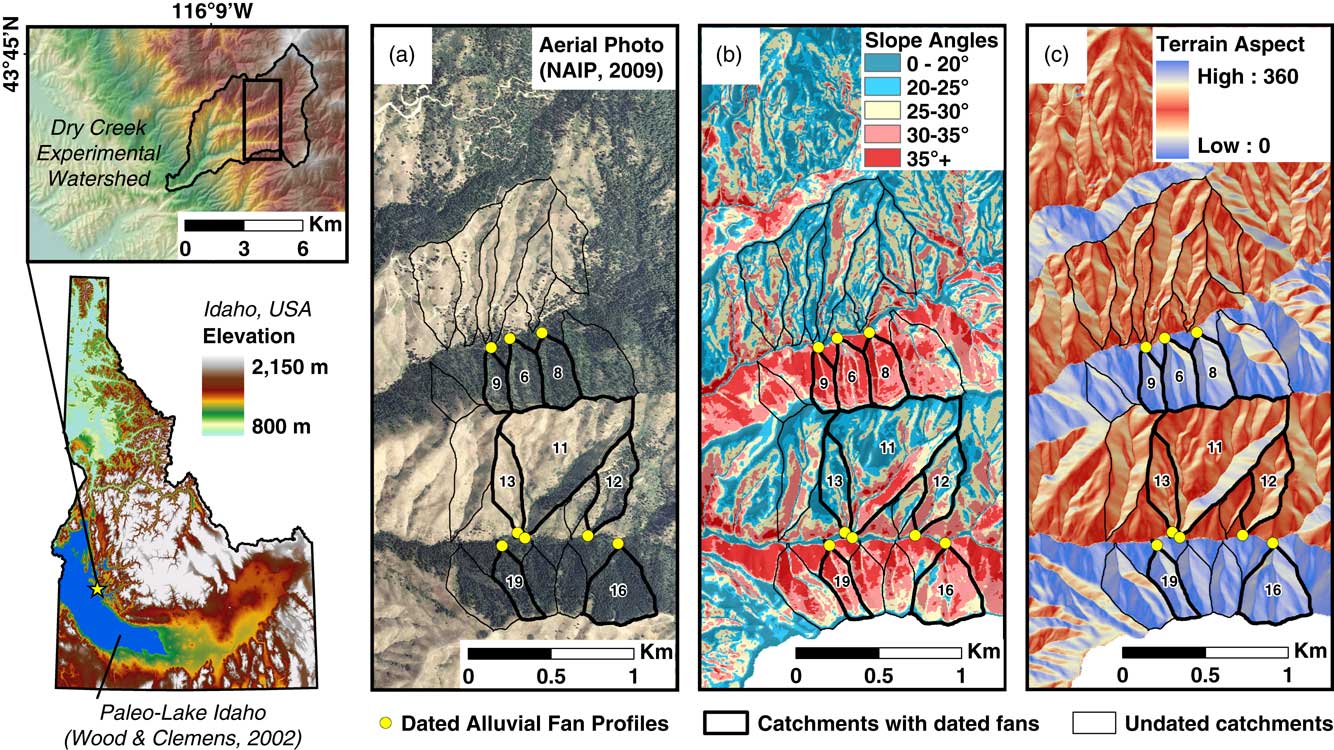
(color online) Location and overview of the Dry Creek Experimental Watershed (DCEW). Right panels show alluvial fan charcoal excavation sites and source catchments. Note steeper northern aspects, with shorter and less-developed drainages, and denser coniferous forest cover.

We hypothesize that if valley asymmetry is actively developing, then the gentler, longer, less vegetated, and more dissected south-facing slopes should have higher rates of erosion and alluvial fan deposition. Alternatively, if the system is near steady state, with denudation rates oscillating between maxima and minima around an average denudation rate corresponding to regional uplift, then the landforms should be stable through time, which mandates similar time-averaged denudation rates throughout the landscape (Abrahams, Reference Abrahams1968); if the landscape is near steady state, valley asymmetry should not be actively developing, and catchment-averaged fan deposition rates should be similar among aspects. Comparing fan deposition rates between opposing aspects may elucidate whether the valleys are actively developing asymmetry or near steady state; the greater the differences in erosion rates with aspect, the farther the valleys must be from steady state.
STUDY AREA AND PRIOR WORK
The Dry Creek Experimental Watershed (DCEW; Fig. 1 and 2), is incised into hydrothermally altered granodiorite on the southwestern margin of the Cretaceous Idaho batholith in the Northern Rockies, (Clayton et al., Reference Clayton, Megahan and Hampton1979; Criss et al., Reference Criss, Lanphere and Taylor1982). The southern lobe of the Idaho Batholith was emplaced between 100 to 75 Ma (Armstrong et al., Reference Armstrong, Taubeneck and Hales1977) but was not unroofed and exposed at the surface until ~10 Ma, after which time it has experienced an average of ~300 mm/ka of uplift (Sweetkind and Blackwell, Reference Sweetkind and Blackwell1989) and drainages and landforms have developed.
For ~8 of the last ~10 Ma, the study area drained to a local base level defined by paleo-Lake Idaho in the western Snake River Plain (Wood et al., Reference Wood, Burnham and Osterman1982; Othberg, Reference Othberg1994; Wood and Clemens, Reference Wood and Clemens2002). For roughly half this period, the lake was an internally drained basin disconnected from the ocean (Swirydczuk et al., Reference Swirydczuk, Wilkinson and Smith1979; Straccia et al., Reference Straccia, Wilkinson and Smith1990). Sometime between 2–3 Ma, paleo-Lake Idaho began draining through what became Hells Canyon into the Columbia River, completely draining by ~1.7 Ma (Wood and Clemens, Reference Wood and Clemens2002). The presence of a lake during 8 of the last 10 Ma generally raised the local base level and reduced geomorphic gradients, but also introduced variability in base levels due to lake level fluctuations.
Within the DCEW, we focused on two east-west trending valley segments that exhibit pronounced aspect-related variability in landscape characteristics (Fig. 1) with side-slopes spanning elevations between 1350 and 1700 m. The valleys are large and deeply incised, with widths of ~1.5 km and vertical relief of ~200–250 m. The valley side-slopes are dissected by smaller scale drainages and catchments (Fig. 2), which produce alluvial fans at their outlets.
Alluvial fans in DCEW are small tributary junction fans formed where steeper, small, ephemeral streams join gentler axial valleys; such fans record source-catchment erosion over Holocene timescales (e.g., Meyer et al., Reference Meyer, Wells and Jull1995; Pierce et al., Reference Pierce, Meyer and Jull2004; Riley et al., Reference Riley, Pierce and Meyer2015). Modern observations and Holocene reconstructions indicate deposition on similar fans in the region is mainly by (1) post-fire floods and debris flows following cloudburst storms and (2) debris flows and sediment-laden floods caused by saturation and failure of colluvium, or sediment bulking, during prolonged storm events or rain-on-snow (Thomas, Reference Thomas1963; Meyer et al., Reference Meyer, Pierce, Wood and Jull2001; Pierce et al., Reference Pierce, Meyer and Jull2004; Welcker, Reference Welcker2011). These fans are smaller than large fans typical of fault-block mountains in the western United States; as such, the tributary junction fans examined in this study likely take less time to develop, and may post-date depositional events governed by climate and vegetation feedbacks at the Pleistocene-Holocene transition (e.g., Bull, Reference Bull1977, Reference Bull1991) or late Pleistocene increases in peak discharge (e.g., Pierce and Scott, Reference Pierce and Scott1982).
Fan stratigraphy and observations of recent events in the DCEW and the region indicate most erosion occurs primarily via debris flows and sheetfloods, with more minor components of streamflow, rockfall, and colluvial transport. While other regional alluvial fan studies contain alluvial fans with well-preserved stratigraphic sequences, where depositional process may be inferred (e.g., Pierce et al., Reference Pierce, Meyer and Jull2004; Nelson and Pierce, Reference Nelson and Pierce2010; Riley et al., Reference Riley, Pierce and Meyer2015), the grussy catchments in the DCEW lack the availability of large clasts (which could be used to infer past debris flow deposition) and generally lack significant amounts of silt and clay.
Based upon 12 years of precipitation gauge data within the watershed at a representative 1610 m, and linearly increasing precipitation trends with elevation (Aishlin and McNamara, Reference Aishlin and McNamara2011; Anderson et al., Reference Anderson, McNamara, Marshall and Flores2014), the east-west trending valleys studied receive between ~30 to 60 cm of precipitation annually, which increases with elevation. Roughly half of the modern precipitation falls as snow, with more snow at higher elevations (McNamara et al., Reference McNamara, Chandler, Seyfried and Achet2005; Anderson et al., Reference Anderson, McNamara, Marshall and Flores2014).
Vegetation in the DCEW varies with both aspect and elevation (Fig. 1 and 2). Within the valley segments studied, north-facing slopes predominantly support coniferous forests, composed primarily of Douglas fir (Pseudotsuga menziesii) and ponderosa pine (Pinus ponderosa). South-facing slopes exhibit more bare ground and ecosystems composed of big sagebrush (Artemisia tridentata), rubber rabbitbrush (Ericameria nauseosa), antelope bitterbrush (Purshia tridentate), cheatgrass (Bromus tectorum; invasive), rush skeletonweed (Chondrilla juncea; invasive), and other forbs in lesser quantities (Smith, Reference Smith2010; Loughridge, Reference Loughridge2014).
On north-facing slopes, snow and moisture persist longer, and soils are deeper, finer-grained, contain more organic matter, and store more water, which results in longer growing seasons that promote denser and more productive vegetation (Tesfa et al., Reference Tesfa, Tarboton, Chandler and McNamara2009; Smith, Reference Smith2010; Geroy et al., Reference Geroy, Gribb, Marshall, Chandler, Benner and McNamara2011; Kunkel et al., Reference Kunkel, Flores, Smith, McNamara and Benner2011; Smith et al., Reference Smith, McNamara, Flores, Gribb, Aishlin and Benner2011; Anderson et al., Reference Anderson, McNamara, Marshall and Flores2014). Differences in regolith thickness and texture with aspect may reflect changes in weathering rates, residence times, and dust accumulation (Stark, Reference Stark2012). Thicker regolith cover on north-facing slopes requires more total water to reach field capacity and initiate subsurface drainage and runoff production (Kormos et al., Reference Kormos, McNamara, Seyfried, Marshall, Marks and Flores2015), which likely affects the geomorphic efficacy of fluvial processes.
Relatively homogenous bedrock and an absence of large faults within the study area suggest valley-parallel faulting and tectonic tilting (e.g., Garrote et al., Reference Garrote, Cox, Swann and Ellis2006) are not likely mechanisms for valley asymmetry development. Although normal faults associated with basin and range extension bound the regional mountain block, they are not evident within the study area. Additionally, hillslope asymmetry measured at 5 km scales throughout the region (Poulos et al., Reference Poulos, Pierce, Flores and Benner2012) does not noticeably vary across known faults, suggesting that bedrock structure is not responsible for the valley asymmetry that is pervasive throughout the region. Additionally, if bedrock structure caused valley asymmetry, one would expect increased erosion from the steepened north-facing slopes, whereas their thicker soils and denser vegetation suggest greater stability. Moreover, elevation-related changes in climate across the batholith appear to modify the eco-hydro-geomorphic feedbacks that cause valley asymmetry development, causing the dominant asymmetry type to change from steeper north-facing slopes at elevations below ~2000 m to steeper south-facing slopes at higher elevations, which would not be expected if the asymmetry were non-climatic in origin.
METHODS
Methods overview
Alluvial fan deposition rates are compared among small, steep source-catchments incised into larger-scale north and south-facing valley side-slopes to investigate variations with aspect. Our approach for estimating catchment-averaged rates of alluvial fan deposition required: (1) radiocarbon dating of charcoal within deposits; (2) reconstructing and measuring corresponding deposit volumes; and (3) normalizing volumetric rates of deposition by source catchment areas. Additionally, we measured the volumes of material missing from dissected alluvial fans to assess bias in sediment remobilization, and estimated the total volumes of material eroded from catchments, to assess erosion over longer timescales.
Fan selection, charcoal sampling, and radiocarbon dating
Five north-facing and three south-facing catchments had alluvial fans with datable charcoal (Fig. 2). For these catchments, we excavated vertical exposures into fan stratigraphic sequences along incised alluvial fan toes and source channels. Where charcoal was present, we collected the largest visible individual charcoal fragments, or bulk sediment where large fragments were absent, from discrete depth intervals. We wet-sieved bulk samples in a lab to separate charcoal, which we aggregated for dating. The northern valley contained a few fans for south-facing catchments, but lacked visible charcoal, and bulk-samples did not yield charcoal for dating.
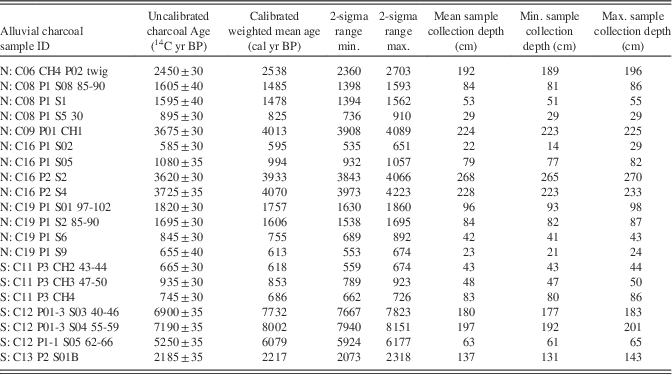
Twenty charcoal samples were radiocarbon (14C) dated by the Lawrence Livermore National Laboratory. We selected younger twigs for dating when available to reduce error from the age variance among small fragments and the inbuilt age of the vegetation prior to the fire (Gavin, Reference Gavin2001). We divided and independently dated two larger samples to assess analytical replicability, yielding ages that vary within the range of the estimated laboratory uncertainty (585 ± 30 and 555±35 14C yr [C16_P1_S02] and 3675±30 and 3665±30 14C yr [C09_P01_CH1]). We calibrated radiocarbon ages using the IntCal13 curve in Calib 7.0.2 software (Stuiver and Reimer, Reference Stuiver and Reimer1993; http://calib.qub.ac.uk), yielding age probability distributions. We calculated weighted means for each age probability distribution, which are most representative of radiocarbon age distributions (Telford et al., Reference Telford, Heegaard and Birks2004), in Oxcal 4.2 (Ramsey, Reference Ramsey2009; http://c14.arch.ox.ac.uk). We quantified uncertainties at the 95% confidence interval, which we propagated through calculations and expressed as error bars.
Depth correction, alluvial fan reconstruction, volumetric deposition, and catchment-averaged deposition
We converted vertical sample depths to surface-normal depths, which correct slope biases and better represent the volumes of material deposited parallel to the surface above a specific depth, using field measurements of fan slope. For bulk samples, sample depths used in the calculations are the median values of the depth intervals, but sampling ranges are propagated as uncertainty ranges, which are displayed as whiskers in the plots.
Our methods assume the sample depths are representative of corresponding alluvial fan depositional volumes, such that deposits less than a specific age are assumed to be of uniform thickness, lie parallel to the surface, and cover the entire fan. This assumption certainly is not valid over short timescales; deposition on alluvial fans is often restricted to channels and lobes and deposits vary in thickness and continuity laterally. It was not possible to assess this variability, due to poor exposure and absence of marker deposits. Over longer timescales, time-averaged aggradation rates are likely to be relatively even across a fan, because aggradation and avulsion shift deposition back and forth across alluvial fans (Denny, Reference Denny1967; Blair and McPherson, Reference Blair and McPherson1994; Parker et al., Reference Parker, Paola, Whipple and Mohrig1998; Field, Reference Field2001). We sampled older charcoal at the greatest possible depths, in order to produce longer time-averaged erosion rates. For several sites, we sampled charcoal from multiple depths to assess the linearity of age versus depth relationships, and the influence of event episodicity.
We reconstructed alluvial fan 3-d surfaces by fitting conical trend surfaces through fan surface remnants evident in airborne lidar data (Fig. 3). First, we generated gridded bare-earth elevation data at 0.5 m resolution from airborne lidar data using BCAL Lidar Tools (http://bcal.boisestate.edu/). We manually selected and converted pixels interpreted as part of remnant fan surfaces to points, which we fit with a conical third order polynomial surface using the Trend Interpolation tool in ArcGIS. We merged fan surface reconstructions with modern topography by keeping the higher elevation of the two surfaces for each grid cell. We calculated the volume of material missing from each fan, due to dissection, by summing the differences between the reconstructed fan surfaces and modern elevations. We manually delineated fan extents where the two surfaces intersected, in order to calculate surface area. Where alluvial fans overlapped, we used modern alluvial fan surface slope aspects to define the boundary between them. We calculated surface areas in 3-d to avoid the slope bias caused by the reduced surface areas of steeper slopes in 2-d plan view.
(color online) Example of alluvial fan reconstruction. (a) Depiction of a dissected alluvial fan with reconstructed volume in grey. (b) Example of reconstructed of the dissected fan for catchment 13 (see Supplement 1 for all fan reconstructions).

We extrapolated sample depths and ages across reconstructed alluvial fan surfaces to yield deposit volumes and volumetric rates of deposition. Multiplying reconstructed fan 3-d surface areas by surface-normal sample depths yielded fan volume estimates above each sample. We calculated alluvial fan deposition rates by dividing fan volumes by the weighted mean calibrated age. Because sediment yields scale with catchment size, which complicates comparison, we converted fan deposition rates to catchment-averaged deposition rates by normalizing by source catchment 3-d surface areas. The combined calculations are shown in Equation 1:
 \eqalignno{ &$${Volumetric}\,{deposition}\,{rate}\,\left( {{{{mm}} \over {{ka}}}} \right){\equals}\cr&{{{Deposit}\,{Thickness}{\times}{Fan}\,{Area}} \over {{Deposit}\,{Age}{\times}{Source}\,{Catchment}\,{Area}}} {{{mm}{\times}{m}^{2} } \over {{ka}{\times}{m}^{2} }}$$
Following the methods of Meyer et al. (Reference Meyer, Pierce, Wood and Jull2001), we converted volumetric deposition rates to mass-based sediment yields using a regional average sediment bulk density of 1500 kg m–3. This allowed us to compare our sediment yields to those calculated by Meyer et al. (Reference Meyer, Pierce, Wood and Jull2001) for their study and other studies in the region (Clayton and Megahan, Reference Clayton and Megahan1986; Sweetkind and Blackwell, Reference Sweetkind and Blackwell1989; Kirchner et al., Reference Kirchner, Finkel, Riebe, Granger, Clayton, King and Megahan2001).
Importantly, although catchment-averaged volumetric alluvial fan deposition rates may reflect catchment erosion rates, they inherently underestimate total catchment erosion because some sediment exported from the catchment is transported past the fan into the trunk stream. Additionally, alluvial fan sediment may be remobilized both by incision of the source streams, and undercutting at the foot of the fans by trunk streams. Missing sediment may not always be apparent, as subsequent deposition may refill missing volumes. Estimates of deposition rates represent minimum constrainable rates of catchment erosion.
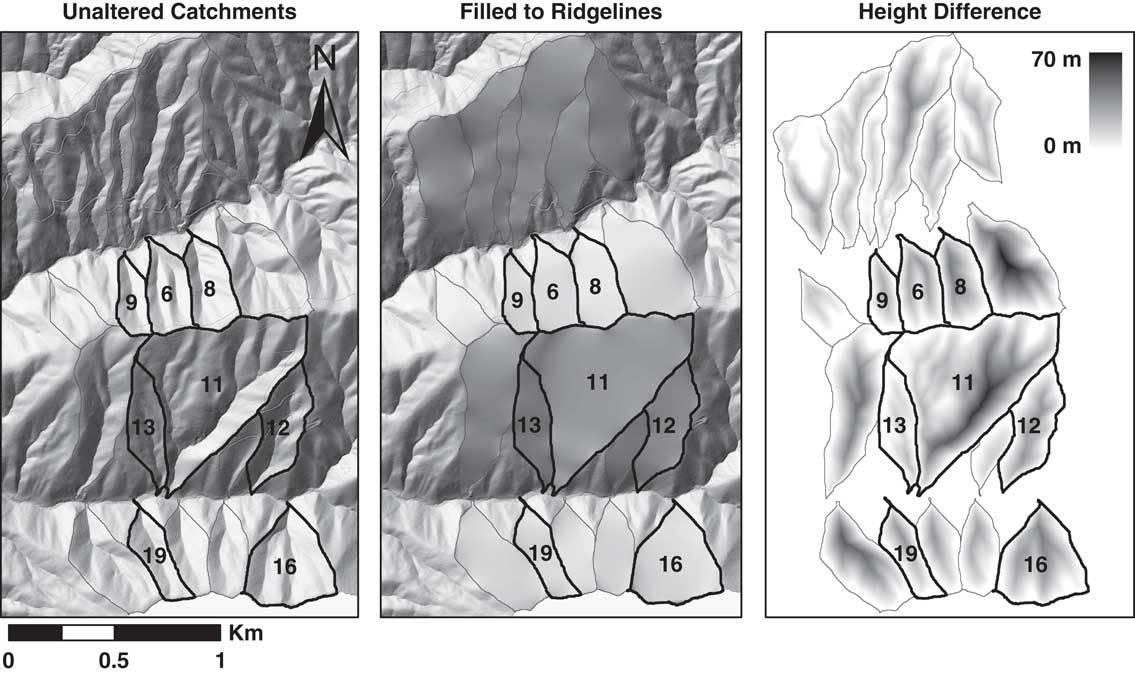
We estimated the total amount of material excavated from each catchment to compare with alluvial fan deposit volumes, and assess the relative amount of catchment evolution occurring during the late Holocene. We fit elevation surfaces through the boundary of each catchment using the Natural Neighbor tool in ArcGIS, essentially filling in the catchments up to their ridgelines (Fig. 4). We subtracted the modern elevations from the capping surface elevations for each cell, multiplied by the cell size (1 m2), and summed within each catchment to determine minimum volumes removed. Because this approach does not account for ridgeline lowering, the resulting estimates are minimum values for total eroded volume.
Sequence showing how catchments are filled by projecting ridgeline elevations across catchments, with the total volumes of material removed from each catchment calculated by summing the height differences within each catchment. Note that these estimates cannot account for ridgeline lowering.

We estimated maximum and minimum uncertainty ranges of alluvial fan aggradation and catchment-averaged deposition rates by propagating errors associated with depth measurement, charcoal ages, and surface areas through the calculations of Equation 1. In order to calculate minimum uncertainty range values, we used minimum error or uncertainty ranges in the calculations for numerator variables positively correlated with the result, and maximum values for inversely correlated denominator variables. We calculated maximum uncertainty ranges using the opposite approach. We used sampling depth intervals of bulk sediment for min and max values of depth. For fan and catchment surface areas, we assumed a±1 m (i.e.,±2 pixels) accuracy in boundary delineation from the 0.5-m-resolution elevation data, based upon our ability to distinguish debris flow levees and other features of similar scale.
RESULTS
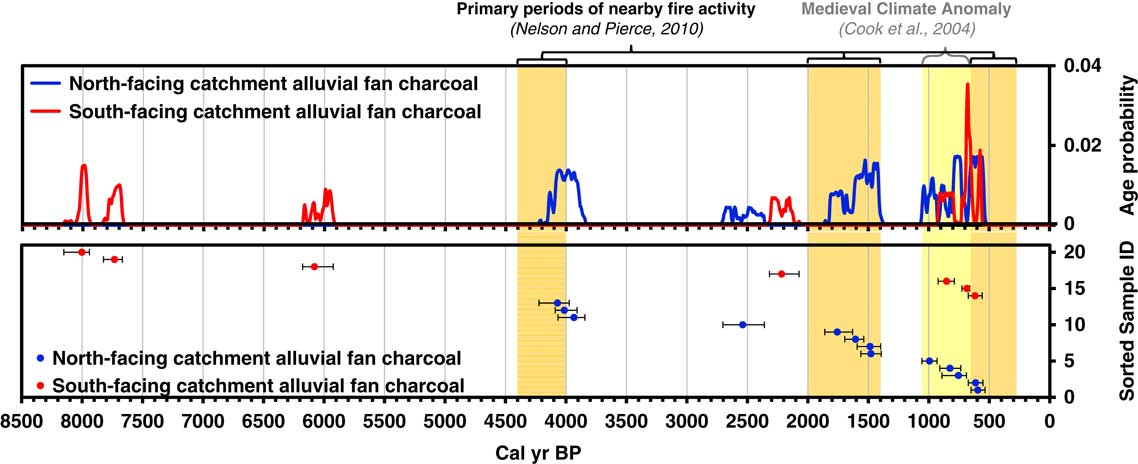
Calibrated alluvial fan weighted-mean charcoal ages ranged from 8002 to 595 cal yr BP (Table 1), with an average 2-sigma (2 standard deviation) range of±92 cal yr BP. Charcoal age probability distributions for north and south-facing slopes generally spanned different time periods, except from 1000–500 cal yr BP, when numerous samples for both north and south-facing slopes were produced (Fig. 5). Charcoal samples from north-facing catchments also exhibited more overlapping (i.e., possibly concurrent) age distributions from different catchments.
(color online) Fire record showing the summed calibrated age probabilities for charcoal from north (n = 13) and south-facing (n = 7) catchments (top). Samples making up each probability distribution plotted as weighted mean sample ages with 2-sigma age ranges (bottom; error bars). Vertical position on lower graph is sorted by aspect and age for display. Overlapping age distributions indicate samples are likely from the same episode of fire-related erosion, and in some cases the same deposit. The absence of samples younger than 500 cal yr BP may reflect the preference for dating of samples from deeper in the deposits in order to obtain time-averaged erosion rates.

Alluvial fan deposit charcoal ages and sampling depths.

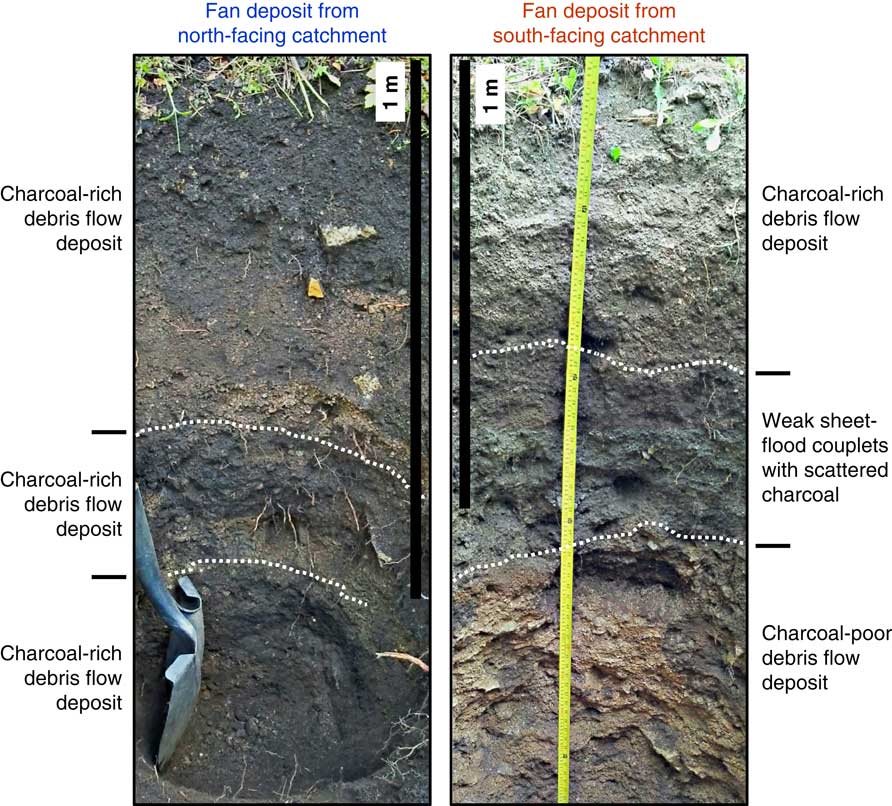
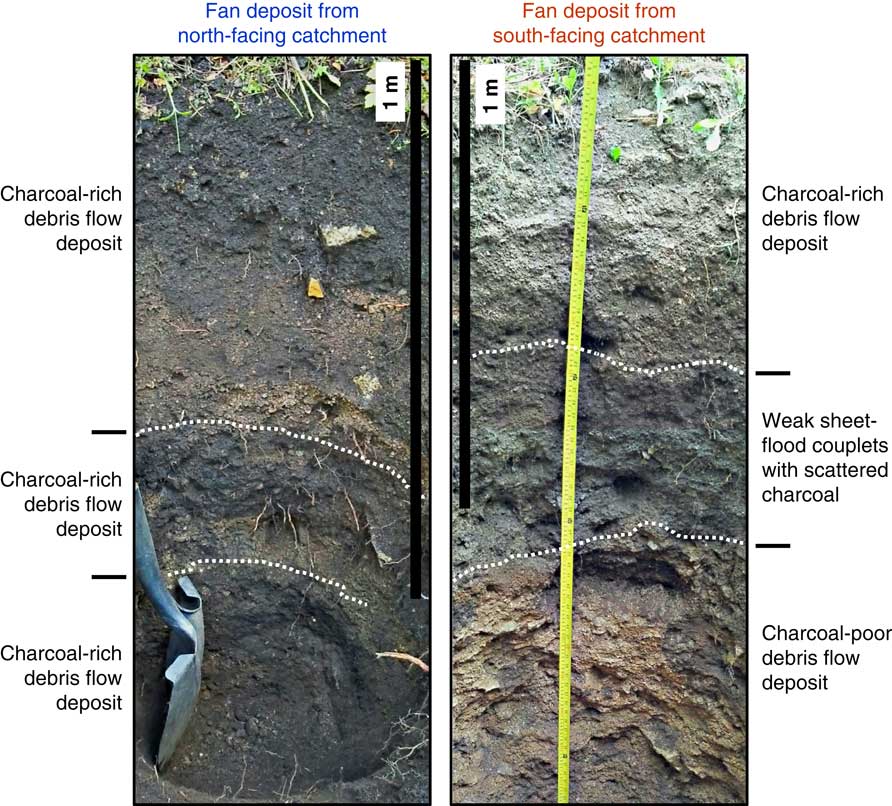
The alluvial fan deposits for south-facing catchments are generally better sorted, with less silt and clay sized-material, and commonly indicate sheetfloods in the form of sheetflood couplets and massive units (Fig. 6). Charcoal fragments are scarcer and smaller in alluvial fan deposits from the mostly unforested south-facing catchments. South-facing alluvial fans more commonly required bulk sampling in order to aggregate enough charcoal mass for dating. North-facing alluvial fans contained more debris flow deposits, with angular cobble-sized clasts and abundant charcoal (Fig p 6). There are more samples for north-facing slopes (n=13) than for south-facing slopes (n=7), because charcoal is scarce in deposits from south-facing slopes, and some samples contain insufficient charcoal.
(color online) Stratigraphic profiles of alluvial fan deposits for two fans. Most alluvial fan deposits for south-facing catchments did not exhibit distinct boundaries or stratigraphy related to processes, such as sheetflood couplets, large matrix-supported clasts, sediment sorting, or charcoal-rich layers. Note that bottom of pit is seen obliquely in these HDR vertically stitched photos, falsely giving the appearance of plate-like structure in the south-facing pit.
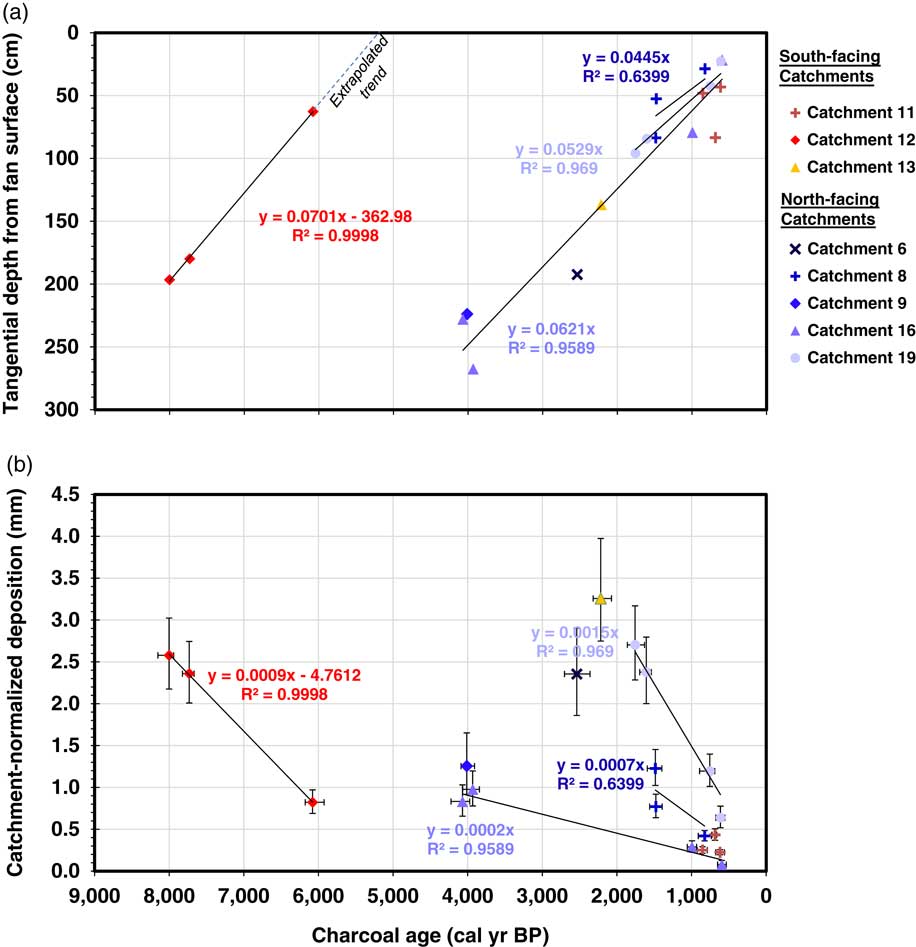
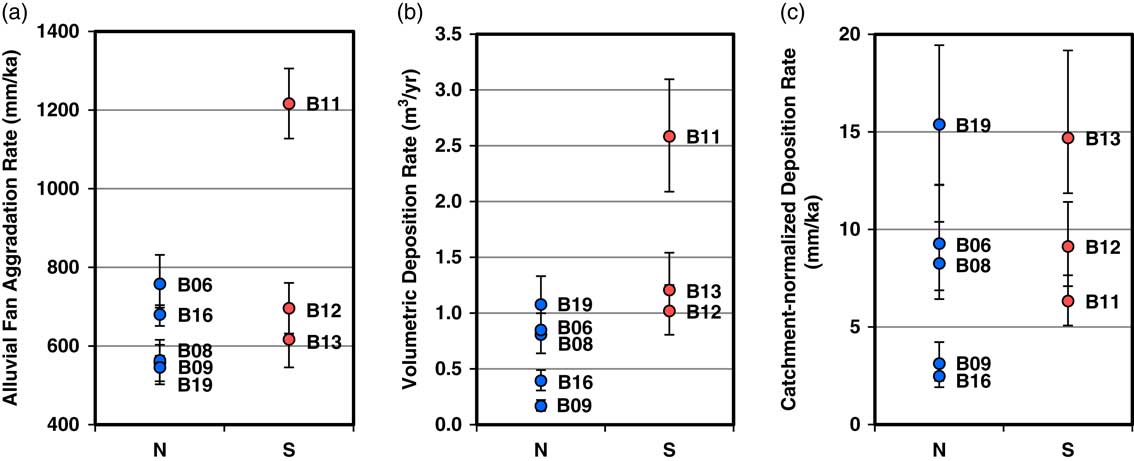
Time-averaged fan aggradation rates, calculated using the deepest charcoal sample for each of the five north-facing catchments and three south-facing catchments, ranged from 550 to 1220 mm/ka, with average rates of 620 and 840 mm/ka for north- and south-facing catchments, respectively (Table 2). For individual alluvial fan profiles with multiple dated samples, linear aggradation trend slopes ranged from 450 to 790 mm/ka (n=4; Fig. 7a). Catchment 11 had a higher aggradation rate because the record spans less than 1000 cal yr BP and was affected by a large event. Nevertheless, as indicated by the linear trends (Fig. 7), alluvial fan aggradation appears to be relatively constant over timescales greater than a thousand years. An estimated deposition event recurrence interval of 200–600 years suggests that deposition rates measured over thousands of years may effectively average out the episodic nature of depositional processes.
(color online) (a) Relationship between charcoal age and burial depth, tangential to the fan surface, for north and south-facing catchments. Aggradation rates are depicted by the slopes of trend lines. (b) Relationship between charcoal age and catchment-averaged deposition. Rates of deposition are depicted by the slopes of trend. We only fit trend lines for datasets with samples at multiple depths that exhibited statistically different ages.

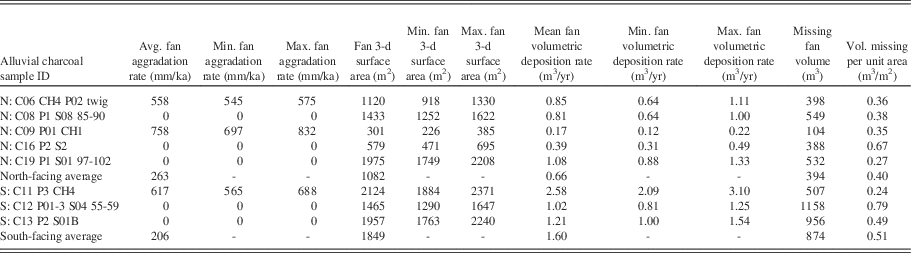
Alluvial fan aggradation rates, reconstructed surface areas, volumetric rates of deposition, and dissection.

Aggradation time-series show the expected increase in age with profile depth (Fig. 7a), indicating that none of the deposits lower in the profiles are inverted in age; there is neither evidence of cut-and-fill cycles producing inset younger deposits, nor evidence of reworked charcoal from older fire events included in younger deposits. We did not calculate a trend for Catchment 11 because all three samples appear to be within the same deposit and are not significantly different in age.
The alluvial fan in south-facing Catchment 12 aggraded earlier than the other fans, and its aggradation trend is quite linear (Fig. 7a). If it is a relict and abandoned alluvial surface, this could yield erroneously low aggradation rates when averaged over the time period of inactivity. We extrapolated the Catchment 12 aggradation trend, based on its prior linearity, to intersect the age axis, yielding a possible time of abandonment between 5100 and 5300 cal yr BP, based on the average error of the samples defining the trend. We utilized the aggradation trend from Catchment 12 to limit aggradation rate calculations to the time period of alluvial fan activity, and we propagated the minimum and maximum ranges as errors. Aggradation trends for the rest of the alluvial fans appear to intersect the origin at the present time, so we did not perform abandonment corrections for these fans.
When normalized by basin area, fan deposition rates during the late Holocene differ with aspect (7.7 mm/ka average for north-facing catchments, versus 10.1 mm/ka average for south-facing catchments). However, highly variable data produce results that are not statistically different. The reconstructed surface areas of alluvial fans ranged from 300 to 2100 m2, with average values of 1100 and 1800 m2 for north- and south-facing catchments, respectively (Table 2). Extrapolating the aggradation rates across the alluvial fan surface areas yielded volumetric fan deposition rates ranging from 0.17 to 2.58 m3/yr. Average deposition rates for north-facing catchments (0.7 m3/yr) are lower than those for south-facing catchments (1.6 m3/yr).
The modern volumes missing from the alluvial fans, measured as the difference between the reconstructed surface and modern elevations, are 100–1160 m3, with averages of 400 and 880 m3 for the fans of north and south-facing catchments, respectively (Table 2). When normalized by fan surface area, missing volumes ranged from 0.3–0.8 m3/m2, with averages of 0.4 and 0.5 m3/m2 for north and south-facing alluvial fans, respectively. Reconstructed surfaces and missing fan volumes are shown for each fan in Supplement 1.
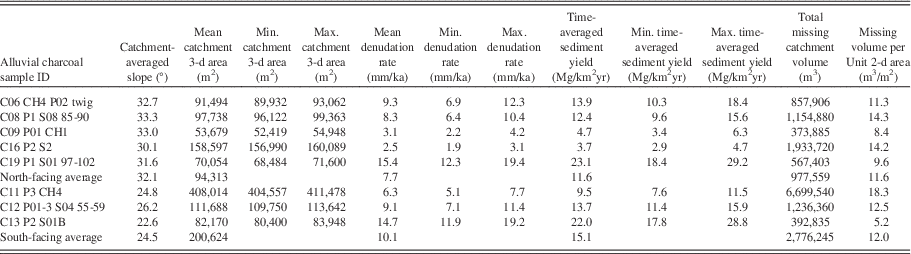
Source-catchment slopes are 7.6° gentler for south-facing catchments, on average, with average slopes of 24.5° versus 32.1° (Table 3). Source-catchment surface areas are higher for south-facing catchments: north-facing catchments are 94,000 m2, on average, while south-facing catchments are 201,000 m2 (Table 3). Normalizing volumetric deposition rates by source-catchment areas yielded catchment-averaged deposition rates (Fig. 7b, Table 3) ranging from 2.5–15.4 mm/ka for north-facing catchments (7.7 mm/ka average), and from 6.3–14.7 mm/ka for south-facing catchments (10.1 mm/ka average). Although catchment-normalized deposition rates averaged slightly higher for south-facing slopes (Table 3), this difference is exceeded by the variability within each aspect grouping (Fig. 8c). The differences in the averages are mainly due to south-facing catchment 11, which is larger and has a higher deposition rate.
(color online) (a) Aggradation, (b) volumetric deposition, and (c) catchment-averaged deposition rates calculated using the deepest samples for each north (n = 5) and south-facing (n = 3) catchment alluvial fan. Differences between aspects become greater for volumetric deposition because south-facing fans are larger on average, but decrease for source-catchment averaged deposition rates because south-facing catchments are also larger.

Source catchment areas, catchment averaged deposition rates, sediment yields, and total volumes eroded from catchments.

Individual alluvial fan aggradation and catchment deposition rates vary within aspect groupings, and the variability increased with each step of the calculation (Fig. 8). Since both alluvial fan and catchment surface areas are greater on south-facing valley sides, normalizing by source catchment areas counteracts their larger fans. Much of the differences in aggradation and volumetric deposition values with aspect are due to the inclusion of the Catchment 11 values, which records a single large event within the last 1000 years. The increase in variability through the calculations is due to variability in the surface areas of both the fans and catchments.
The estimates of total catchment volumes removed varied from 370,000–6,700,000 m3, with averages of 980,000 and 2,800,000 m3 for north and south-facing catchments, respectively (Table 3). When normalized by catchment 2-d surface area, total volumes removed per unit area ranged from 5.2–18.3 m3/m2, with averages of 11.6 and 12.0 m3/m2 for north and south-facing catchments, respectively.
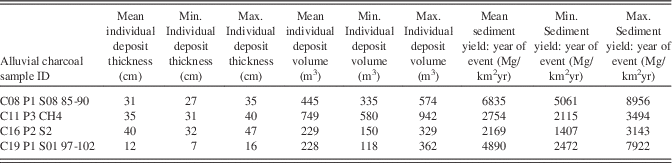
The minimum sediment yields for individual debris flow and sheetflooding events, constrained by samples of similar age at different depths, ranged from 2200–6800 Mg/km2 yr (Table 4). The average of the three values for north-facing slopes was 4900 Mg/km2yr, whereas the lone value for south-facing slopes was 3100 Mg/km2.
Individual deposit thicknesses, volumes, and sediment yields for years of events.

Propagated uncertainties are shown in Tables 1–3 as minimum and maximum values. Uncertainties for calibrated charcoal ages, based on two standard deviations of the probability distribution, ranged from ±24–178 years (±1–18%) for all charcoal samples. The average calibrated age error was±92 years (±6%). For the subset of deepest samples used to calculate aggradation and erosion rates, propagating age uncertainties with sampling depth interval uncertainties yielded errors for aggradation rates ranging from±3–12% of weighted mean values, with an average propagated aggradation error of±7%. For catchment-averaged deposition, propagated errors ranged from±8–14%, with an average value of±11%. The increased error for deposition rates is primarily due to the±0.5 m (i.e.,±1 pixel) boundary uncertainty assumed for fan surface area delineation (±2–6% error, varying inversely with alluvial fan area), as the source catchments are much larger than the estimated scale of measurement error (±0.2–0.4% error, varying inversely with catchment area).
DISCUSSION
Aspect-related differences in fan deposition and erosion
When normalized by source-catchment area, alluvial fan deposition rates during the late Holocene vary from 2.5–15.4 (7.7 average) mm/ka for north-facing catchments, versus 6.3–14.7 (10.1 average) mm/ka for south-facing catchments; the catchment-averaged fan deposition rates are 1.3 times greater for south-facing catchments. However, the difference in average alluvial fan deposition rates is not significant based on the overlapping error and sample ranges (Fig. 8). Furthermore, 1.3 times greater catchment-averaged deposition for south-facing catchments, and minimum catchment-averaged denudation by extrapolation, is not enough to explain the 2.8 times larger volumes eroded from the south-facing catchments; south-facing catchments are 2.1 times larger, with 7.6° gentler slopes (24.5° versus 32.1°, average), and have more deeply incised and extensive drainages (Poulos, Reference Poulos2016). The differences in catchment-normalized alluvial fan deposition rates during the late Holocene cannot explain the difference in volumes, and perhaps the processes, needed to produce the observed differences in catchment morphology formed over the last 10 Ma (Clemens, Reference Clemens1993). The amount of landscape evolution that occurred during the late Holocene is also relatively insignificant compared to the total amount of catchment evolution; total alluvial fan deposit volumes (Table 2) are two orders of magnitude lower than total source catchment erosion (Table 3).
Although a relatively small amount of geomorphic work has occurred during the late Holocene, this is primarily because this period spans <0.1% of the last 10 Ma of landscape evolution, and erosion rates were not necessarily slow. At the average rates of fan-building volumetric deposition ranging from 0.4–2.6 m3/yr (Table 2) during the late Holocene, it would only take 0.4–6.3 Ma to erode the 0.4–6.7 x 10⁶ m3 total volumes of material of missing from the source catchments (Table 3), which suggests that late Holocene catchment-averaged alluvial fan deposition rates are higher than the 10 Ma average erosion rates. This makes sense, because the watershed drained to a local base level created by paleo-Lake Idaho for ~8 of the last ~10 Ma, but geomorphic gradients and erosion rates likely increased while base levels declined over the last 5 Ma due to lake drainage and integration with the Columbia River network (Wood and Clemens, Reference Wood and Clemens2002). This is important because it indicates that, although asymmetry development may have been relatively slow, the landscape was relatively active during the period when fan deposition was measured.
The disparity between the statistically-indistinguishable rates of alluvial fan deposition between north and south-facing slopes during the late Holocene, and the difference in catchment size and slope suggests two possible explanations: (1) asymmetry developed quicker during other climates, such as glacial intervals, or under different geomorphic conditions, such as during initial valley incision; and/or (2) aspect-related differences in erosion are not fully reflected within the alluvial fan records, due to sediment deposition and/or remobilization bias.
If there is a sediment remobilization bias, this should be reflected in the modern dissection of the alluvial fans. Total alluvial fan dissection was greater for south-facing fans, but appears related to their larger sizes, as fan-size-normalized dissection (Table 2) was not significantly different between north and south-facing fans, suggesting that there is not an aspect-related bias in the fraction of sediment remobilized by the dissection of fans. We did not see evidence of cut-and-fill cycles, such as inverted charcoal ages or crosscutting stratigraphy, which could further complicate comparisons. This suggests that the similarity of catchment-averaged fan deposition is not simply due to a sediment remobilization bias.
If there is a sediment deposition bias, this might be evident from modern processes. Modern channelized flow is rare, but minor snowmelt-driven flows occur briefly in south-facing drainages, while north-facing drainages exhibit no evidence surface flow and their channels are filled by soil creep; if fluvial processes are more common on south-facing slopes, they might pass more sediment downstream, rather than being deposited en masse within alluvial fans. We cannot discount the possibility that more sediment from south-facing catchments passed directly over the fans into the main channel. However, sediment transport by rare ephemeral flows would need to transport sediment at even greater rates than the catchment-averaged deposition rates to explain the 2.8 times greater total catchment erosion over longer timescales, which is unlikely given the low magnitude and duration of modern flows.
The most sensible explanation for why aspect-related differences in catchment-averaged fan deposition during late Holocene are lower than the 10 Ma timescale differences in catchment evolution is that asymmetry development was slower during the late Holocene. This implies that asymmetry developed quicker under other conditions. It has long been recognized that landscapes evolve more rapidly when farther from steady state (Abrahams, Reference Abrahams1968); aspect-induced valley asymmetry likely develops most quickly when a geomorphic system is far from steady state. The DCEW valleys could be approaching, or near, steady state, where the developed asymmetry enables opposite valley sides to erode at similar rates, despite aspect-related differences in landscape characteristics.
During initial drainage incision, newly forming valleys begin to experience the effects of aspect, and differences in erosion with aspect are likely high. Additionally, following episodic changes in climate, such as glacial-interglacial transitions, land surface characteristics, such as vegetation cover, may change and disturb landform equilibrium, requiring valley morphology to readjust in a manner that equalizes erosion on opposite valley sides in order to reach steady state again. More research is needed to elucidate whether asymmetry develops primarily as an initial valley response, and whether asymmetry develops more rapidly during specific climate intervals.
Valley asymmetry development might be better understood by examining older landscapes, where valleys have had more time to adjust to aspect-induced climate differences. In the Appalachian Range, which has been evolving for ~108 years (Matmon et al., Reference Matmon, Bierman, Larsen, Southworth, Pavich and Caffee2003), West et al. (Reference West, Kirby, Bierman and Clarke2014) used meteoric 10Be to compare erosion rates between north-facing and south-facing slopes in the Susquehanna Shale Hills CZO. Like our study, they found that erosion rates over 104–105 year timescales were similar for north and south-facing hillslopes despite differences in gradients, landforms, vegetation, and soils, concluding that south-facing slopes have higher transport efficiency because they transport similar amounts of material despite lower gradients. This could explain why erosion rates in the DCEW are similar for opposing aspects. Transport efficacy may be greater for south-facing slopes in our study area, due to reduced vegetation cover and soil cohesion, combined with more frequent freeze-thaw (e.g., Anderson et al., Reference Anderson, Anderson and Tucker2013) and increased runoff, but reduced gradients may counteract these differences and yield similar denudation rates.
Studying aspect-related differences in erosion in relatively young landscapes, where the timescales of measurement span the timescales of landform evolution, might shed a different light on the problem. A study of cinder cone asymmetry by McGuire et al. (Reference McGuire, Pelletier and Roering2014) suggests that topographic asymmetry may have developed during the glacial periods that have prevailed for much of the Quaternary. Punctuated asymmetry development during glacial intervals would still be subject to negative feedbacks caused by erosion-induced gradient changes. If valley asymmetry only develops during glacial climates, it will still develop more rapidly at first, and aspect-induced erosion differences will be counteracted by asymmetric degradation, causing erosion rates for both slopes to approach regional steady-state erosion rates. Additional research is needed to help elucidate how asymmetry develops and responds to specific climates. Longer-term metrics of erosion, spanning the timescales of landscape evolution, would also aide in understanding asymmetry development.
We propose that landscapes respond to, and counteract, aspect-induced erosion rate differences by adjusting the gradients and other land surface characteristics of opposite valley sides, thereby equalizing erosion across valleys and allowing the landscape to approach steady state. Aspect-induced ecohydrologic feedbacks may initially cause differences in erosion, but more quickly eroding southern aspects develop gentler gradients, which reduces differences in denudation with aspect. Valley asymmetry is clearly the result of asymmetric degradation, but asymmetric degradation appears to be a self-attenuating landscape response that counteracts asymmetric erosion and drives valley evolution towards steady state.
Relationships with regional fire and erosion
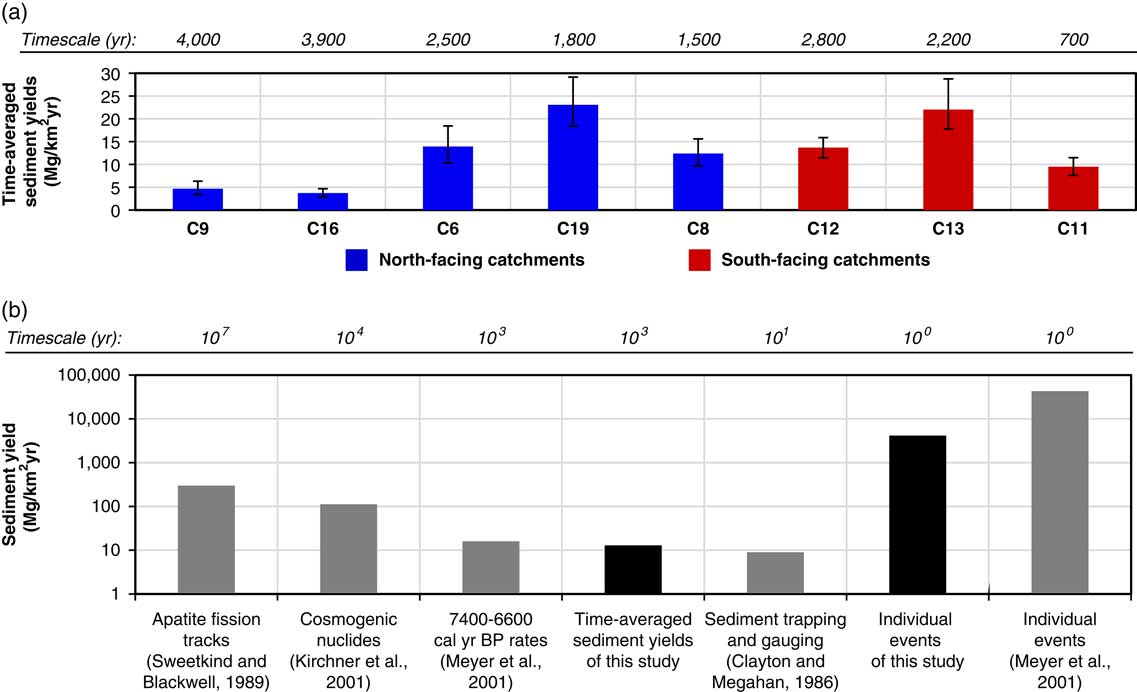
In addition to providing a metric of hillslope-scale variability in erosion rates, the estimates of denudation rates from this study add a valuable data point to compare with other studies of denudation within the Idaho Batholith. Estimated denudation rates for DCEW appear lower than that for those in the central Idaho Batholith; sediment yields over 103 to 104 timescales measured from cosmogenic samples in the interior Idaho Batholith average 112 Mg/km2yr (Kirchner et al., Reference Kirchner, Finkel, Riebe, Granger, Clayton, King and Megahan2001). Time averaged sediment yields from the small catchments within the DCEW range from ~3–29 Mg/km2yr, over ~0.5–8 ka timescales, similar to the ~16 Mg/km2yr over 1 ka, measured by Meyer et al. (Reference Meyer, Pierce, Wood and Jull2001) for the South Fork Payette River (Fig. 9). In addition, sediment yields for individual events from the DCEW record (~4000 Mg/km2yr, on average; Table 4) are up to an order of magnitude lower than individual events for similar sized catchments along the South Fork Payette (~43,000 Mg/km2yr; Fig. 9). This is possibly because the sediment yields from this study could not be constrained by deposit boundaries, which were absent. Rather, our sediment yields represent the minimum values that could be constrained based on sample depths and ages within the stratigraphy, but deposit thickness probably exceeded those constrained by sample positions and ages. It seems unlikely, given the observed trends between depth and age, that we underestimated deposit thicknesses by an order of magnitude; the fans are not large enough to contain an order of magnitude more sediment. Given the lower regional rates of uplift and incision in the DCEW compared to the South Fork Payette system, as well as the smaller size and higher position of the catchments in the watershed, it makes sense that the catchments have lower sediment yields and erosion rates.
(color online) (a) Time-averaged sediment yields with propagated uncertainty ranges and timescales of measurement. (b) The time-averaged sediment yields and yields from individual deposits are compared to sediment yields from elsewhere in the region (modified from Meyer and Pierce, Reference Meyer and Pierce2003).

Fire is a significant cause of erosion in mountainous central Idaho (Meyer and Pierce, Reference Meyer and Pierce2003; Pierce et al., Reference Pierce, Meyer and Jull2004; Riley et al., Reference Riley, Pierce and Meyer2015). In the DCEW, charcoal ages indicate fires burned on both northern and southern aspects ~900–700 cal yr BP during the Medieval Climate Anomaly (Cook et al., Reference Cook, Woodhouse, Eakin, Meko and Stahle2004), but fires were not synchronous between north and south-facing slopes during other intervals. Other studies from the Northern Rockies show the variable and dry climatic conditions of the Medieval Climate Anomaly (Cook et al., Reference Cook, Woodhouse, Eakin, Meko and Stahle2004) promoted fire throughout a range of ecosystems, including high-elevation, moist coniferous forests and drier open forests and sagebrush steppe ecosystems (Meyer et al., Reference Meyer, Wells and Jull1995; Pierce et al., Reference Pierce, Meyer and Jull2004; Nelson and Pierce, Reference Nelson and Pierce2010; Weppner et al., Reference Weppner, Pierce and Betancourt2013; Riley et al., Reference Riley, Pierce and Meyer2015). During the generally cooler Little Ice Age (Luckman, Reference Luckman2000), fires generally burned more frequently, but less severely, in drier forests and sagebrush steppe (Pierce et al., Reference Pierce, Meyer and Jull2004; Heyerdahl et al., Reference Heyerdahl, Morgan and Riser2008; Nelson and Pierce, Reference Nelson and Pierce2010; Weppner et al., Reference Weppner, Pierce and Betancourt2013; Riley et al., Reference Riley, Pierce and Meyer2015) but did not typically burn in high-elevation forests (Meyer et al., Reference Meyer, Wells and Jull1995). Many of the charcoal ages lie within primary periods of fire activity highlighted by Nelson and Pierce (Reference Nelson and Pierce2010; Fig. 7) in the comparable Wood Creek watershed, ~30 km southeast.
Since the frequency and severity of fire changes with vegetation, and vegetation varies notably with aspect-induced microclimate, it follows that the frequency and severity of erosional events should also vary with aspect. In particular, the frequency of fire and resulting erosional episodes may be less in the north-facing basins where fire return intervals are likely 300–400 years for conifer ecosystems (Heyerdahl et al., Reference Heyerdahl, Morgan and Riser2008; Riley et al., Reference Riley, Pierce and Meyer2015). In contrast, for the sparse ponderosa pine and grass-dominated ecosystems of south-facing basins, fire frequency is typically 10–200 yr, and likely has more frequent episodes of fire-related erosion (Miller and Tausch, Reference Miller and Tausch2001; Baker, Reference Baker2006). Within the nearby Salmon River watershed, also underlain by the Idaho Batholith, Riley et al. (Reference Riley, Pierce and Meyer2015) found that higher and lower elevation regions burn at different times, triggered by differences in sensitivity to Holocene changes in climate associated with elevation-driven changes in precipitation, temperature, and fuel types and abundance; low elevation areas burned less severely, but yielded frequent sheetfloods, while high-elevation areas burned less frequently but produced relatively larger debris flows. North-facing slopes in the DCEW are similar in vegetation cover and cooler temperatures to higher elevations in the Salmon River watershed, whereas south-facing slopes are more similar to lower elevations. In the Jemez Mountains of New Mexico, fire-related deposits comprised only 39% of the alluvial fan thicknesses for south-facing slopes, compared to 77% for north-facing slopes (Fitch and Meyer, Reference Fitch and Meyer2016). In 1959 in catchments near the DCEW in the Boise Foothills, a severe range fire, followed by a summer convective cloudburst storm, produced sediment-charged floods and muddy debris flows that inundated city streets and removed large amounts of sediment from the foothills (Thomas, Reference Thomas1963). While they did not specifically assess the relative sediment contributions from north versus south aspects due to this event, observers noted generally deeper rilling and more severe erosion of north-facing slopes. The timing, recurrence, and severity of fires, as well as the resulting erosional processes, likely vary with aspect in the DCEW, but the impact of these differences on overall erosion rates is unclear.
Time-averaged erosion rates are strongly influenced by the yields and recurrence intervals of individual episodic events (e.g., Kirchner et al., Reference Kirchner, Finkel, Riebe, Granger, Clayton, King and Megahan2001; Meyer and Pierce, Reference Meyer and Pierce2003). A recurrence interval of 200–600 years for the four individual events is necessary to produce the observed late Holocene erosion rates for the DCEW catchments. Large erosional responses to fire, such as debris flows, occur less frequently than fire, because they also typically require a cloud burst storm or a rain-on-snow event in order to initiate (Meyer and Wells, Reference Meyer and Wells1997; Cannon 2001; Cannon et al., Reference Cannon, Gartner, Wilson, Bowers and Laber2008; Welcker, Reference Welcker2011). Depletion of sediment stored in hollows may also require time to refill, via erosion from adjacent slopes, before mass wasting can recur. We propose that similar erosion rates with aspect could be achieved by a balance between the severity and recurrence interval of fire-related erosional events; south-facing catchments experience more frequent fires, but produce less severe erosional responses, primarily as sheetfloods, while north-facing catchments burn less frequently, but erode more severely, producing more debris flows.
CONCLUSIONS
Radiocarbon dating of alluvial fan deposits coupled with high-resolution fan surface reconstruction and catchment delineation, yields reasonable estimates of fan aggradation rates and catchment-averaged volumetric deposition rates in the DCEW. These methods are applicable to small, steep first-order catchments, where episodic accelerated erosion following fire and other disturbances account for a majority of the sediment budget, and fluvial processes that tend to remobilize deposits are relatively inactive. North- and south-facing source-catchments have eroded and evolved differently, as expressed by differences in catchment-averaged volumetric deposition and landforms and gradients. Catchments incised into south-facing slopes are 2.1 times larger, and produced 1.7 times larger alluvial fans with 2.4 times greater rates of volumetric deposition during the late Holocene, which makes sense because larger catchments produce more sediment. However, when normalized by source-catchment area to estimate catchment denudation rates, late Holocene catchment-averaged deposition rates are only 1.3 times higher for south-facing catchments, on average, and are not significantly different from north-facing slopes based on sample value and error ranges. The 1.3 times greater catchment-averaged alluvial fan deposition for south-facing catchments cannot fully explain their 2.1 times larger size, 2.8 times greater eroded volumes, 7.6° gentler slopes, and more incised and expanded drainage networks compared to opposing north-facing slopes. Valley asymmetry development during the late Holocene appears slow relative to 10 Ma timescale differences in catchment erosion, despite relatively high denudation rates, suggesting that asymmetry development primarily occurred over longer or different timescales than those over which we measured erosion. Potential biases in sediment deposition and/or retention cannot fully make up the difference in late Holocene and 10 Ma valley asymmetry development. In light of these results, and related studies, we propose that valley asymmetry development and asymmetric degradation act as self-attenuating negative feedbacks that reduce aspect-induced differences in erosion and allow landscapes to approach steady state at valley scales. This implies that valley asymmetry must develop early in a valley’s history, reaching a steady state form in balance with aspect-influenced erosion rates.
ACKNOWLEDGMENTS
Support provided by the NSF Idaho EPSCoR (EPS – 0814387), and the Department of Geosciences at Boise State University, USA. Lawrence Livermore National Laboratory provided Analytical assistance. Chris Stanbery provided field and lab assistance. Feedback from Kerrie Weppner improved this work.
Supplementary material
To view supplementary material for this article, please visit https://doi.org/10.1017/qua.2017.98