


Introduction
Children impacted by parents diagnosed with cancer will reach numbers over 300,000 in the year 2026, and approximately 20% of these parents will be diagnosed with advanced disease for which there is no known cure (ACS 2026). Few programs or services exist to assist families in dealing with advanced disease and its impact on dependent children. There is only one known intervention that has been tested for efficacy in helping parents with advanced cancer improve their skills and confidence in talking to their young children about their cancer: the Enhancing Connections-Palliative Care (EC-PC) program (Lewis et al. Reference Lewis, Griffith and Ganschow2026). See Table 1 for a description of the 5 intervention sessions in the experimental intervention group. The comparison group, an alternative treatment control group, received a booklet followed by a phone call from a trained nurse educator highlighting key points in the booklet. The booklet, entitled “Having Successful Conversations with Your Child,” focused on ways the parent could talk with and support their child about the cancer; each recommendation or “tip” in the booklet was based on published studies. Outcomes at 3 months showed that parents randomized to a 5-session, telephone-delivered parenting program significantly improved in parenting skills compared to an alternative treatment control group (Lewis et al. Reference Lewis, Griffith and Ganschow2026). Still unknown are the longer-term outcomes at 6- and 9-month follow-ups.
Description of experimental intervention sessions

Table 1 Long description
Content is organized by session number and session title, with a description of each session focus for an intervention for an ill or diagnosed parent. Session 1, Anchoring yourself to help your child, separates the childs experience from the parents and builds the parents self-regulation of cancer-related emotions to avoid emotionally flooding the child. Session 2, Adding to your listening skills, teaches deep listening without judgment and distinguishes listening from teaching or problem-solving. Session 3, Building on your listening skills, extends Session 2 by helping parents elicit and expand a childs concerns or feelings, including when the child is not forthcoming, contrasting talkative and not talkative children. Session 4, Being a detective of your childs coping, focuses on understanding and not judging the childs coping, practicing letting go of negative assumptions about behavior, and supporting the childs coping with cancer-related concerns. Session 5, Celebrating your success, centers on parent reflection on gains, using self-monitoring and self-reflection to enhance parenting self-efficacy and internalize a view of being skilled and confident.
The purpose of the current study is to examine parents’ behavioral-emotional adjustment outcomes, cancer-related parenting competency outcomes, and child behavioral-emotional adjustment outcomes of the experimental group compared to the control group at 6- and 9-month follow-ups in the EC-PC program.
Methods
Study design
The study was a 2-group, randomized controlled trial with 3-, 6-, and 9-month follow-ups. See details reported earlier (Lewis et al. Reference Lewis, Griffith and Ganschow2026). Briefly, study participants were child-rearing parents diagnosed with advanced, non-curable cancer who had a co-parent or surrogate parent who lived with them, a child aged 5–17, spoke English among their languages, and had access to a telephone. Diagnosis was based on a TNM (Tumor, Nodes, Metastasis) Stage IV diagnosis for solid tumors, Stage III for Ovarian cancer, or 2 or more cycles of treatment failure with relapse for nonsolid tumors. After obtaining signed informed consent, baseline data were collected, after which the diagnosed parent was randomized to the experimental treatment or alternative treatment control group. Outcome data were collected at 3, 6, and 9 months post-baseline.
Study measures
Baseline demographic, diagnosis, and treatment data, collected at baseline, included type of cancer, time since initial diagnosis, time since diagnosis with advanced cancer, and specifics about medical, surgical, and treatment care.
All outcome measures and demographic data were self-reported; diagnosis and staging were self-reported and verified against physician reports. Eligibility was confirmed by screening prior to enrollment.
Depressed mood was measured by the Center for Epidemiologic Studies–Depression (CES-D) Scale (Radloff Reference Radloff1977; Lewis et al. Reference Lewis, Woods and Hough1989, Reference Lewis, Fletcher and Cochrane2008; Benazon and Coyne Reference Benazon and Coyne2000). The CES-D is a self-reported 20-item questionnaire that measures the occurrence of recent depressive symptoms. Responses range from 0 to 3, with a total score ranging from 0 to 60. For each item, the respondent indicates how frequently that symptom had occurred in the past week. A higher score indicates a higher depressed mood. Previous studies by Radloff (Reference Radloff1977) reported an internal consistency from 3 samples from the general population, which ranged from 0.84 to 0.85 (Radloff Reference Radloff1977; Coyne et al. Reference Coyne, Kessler and Tal1987; Benazon and Coyne Reference Benazon and Coyne2000; Given et al. Reference Given, Given and Rahbar2004). Internal consistency reliability for the current study sample was 0.85.
Anxiety was measured using the state component of the Spielberger State-Trait Anxiety Scale (STAI) (Spielberger Reference Spielberger1983; Spielberger and Rickman Reference Spielberger, Rickman, Sartorius, Andreoli, Cassano, Eisenberg and Kielholz1990; Spielberger et al. Reference Spielberger, Sydeman, Owen and Maruish1999). This is a 20-item self-reported questionnaire that measures how apprehensive, tense, nervous, or worried the participant is “right now.” Responses range from 1 to 4, with a total anxiety score ranging from 20 to 80. A higher score indicates higher anxiety and tension in a participant. Internal consistency and reliability for the STAI scale was 0.90 for this study.
Parenting confidence was measured by the Cancer Self-efficacy (CASE) (Lewis et al. Reference Lewis, Brandt and Cochrane2015, Reference Lewis, Griffith and Ganschow2026). This scale measures the parent’s confidence in his or her ability to talk with the child about any cancer-related concerns. The scale includes 3 subscales, Help Child (9 items), Deal and Manage (13 items), and Stay Calm (6 items). Responses ranged from 1 – “not at all confident” to 10 – “very confident.” Higher scores denote higher self-efficacy. The Help Child subscale scores can range from 9 to 90 and are a measure of how confident the parent is in their ability to talk with their child about any cancer-related concerns and ways to manage any concerns. The Deal and Manage subscale scores can range from 13 to 130 and measure how confident the parent is in helping themselves and their family deal with the cancer. The Stay Calm subscale scores can range from 6 to 60 and measure the parent’s confidence that they can stay calm during difficult interactions with their child about the parent’s cancer. The internal consistency reliabilities for the 3 CASE subscales in this study sample were 0.95, 0.82, and 0.86, respectively.
Parenting skills were measured by the Parenting Skills Checklist (Lewis et al. Reference Lewis, Brandt and Cochrane2015). The measure is a 10-item self-reported assessment of a parent’s skills in assisting their child to disclose, discuss, and better manage the impact of the cancer on the child. The Parenting Skills measure was developed by the study team conducting this trial and has been tested in prior clinical trials (Lewis et al. Reference Lewis, Brandt and Cochrane2015, Reference Lewis, Griffith and Walker2017; Lewis et al. Reference Lewis, Zahlis and Shands2020). The items query the parent about specific cancer-related connecting and coping skills and are not just general parenting skills measures. Example items include “I draw out my child’s concerns or questions about my cancer,” “I work with my child to help my child specifically manage the child’s stress related to my cancer,” and “I focus on my child’s response to my cancer on a regular basis.” Response options range from 0 (Never) to 5 (All of the time), and the total score can range from 0 to 50. Higher scores denote greater skills. Internal consistency reliability for this study sample was 0.93.
Child behavioral-emotional adjustment was measured by the parent-reported measure of the Child Behavior Checklist (CBCL) (Achenbach and Edelbrock Reference Achenbach and Edelbrock1978; Achenbach and Rescorla Reference Achenbach and Rescorla2001). The measure assesses a range of behavioral problems in children ages 6–18. Response options range from 0 (not true) to 2 (very true); higher scores reflect more problems. Two subscales were assessed for the current study: Internalizing and Externalizing Problems. Internalizing Problems is a 32-item subscale that measures a child’s fearful, inhibited, and over-controlled behavior. Its internal consistency reliability was 0.90 for the study sample. Externalizing Problems is a 35-item subscale that measures a child’s aggressive, anti-social, and under-controlled behavior; its internal consistency reliability was 0.94 for the study sample.
Physical and psychological symptom burden and distress were assessed by parent self-report using the Condensed Memorial Symptom Assessment Scale (CMSAS) (Chang et al. Reference Chang, Hwang and Kasimis2004). This is a 14-item self-report scale that includes 2 subscales that measure what physical and psychological symptoms a patient has experienced over the past 7 days. Higher values on these 2 subscales indicate higher symptoms. For this study, the internal consistency reliabilities were 0.82 and 0.72, respectively, for the 2 subscales.
Study aims
The purpose of the current study is to compare parents’ behavioral-emotional adjustment outcomes, cancer-related parenting competency outcomes, and child behavioral-emotional adjustment outcomes of the experimental group compared to the control group at 6- and 9-month post-baseline.
Study sample
Of the initial 403 ill parents who were screened for eligibility, 306 were excluded, including 95 who were not eligible, 122 who declined to participate, 74 who could not be reached for screening, and 14 who agreed to participate but were unable to be reached to complete consent. Of the remaining 98 who were enrolled, 84 parents were randomized. See Figure 1 for participant flow sheet.
Flowchart of study participants.

Figure 1 Long description
The process of screening, enrollment and follow-up of study participants. Initially, 403 individuals were screened for eligibility. Of these, 306 were excluded for reasons such as ineligibility (95), declining participation (122), inability to reach for screening (74) and inability to reach for consent (14). Ninety-eight participants were enrolled and 84 were randomized into two groups: Intervention Group (42) and Alternative Control Group (42). For the Intervention Group, at baseline, 42 were analyzed. At the 3-month follow-up, 26 were analyzed, with reasons for non-participation including death (6), inability to contact (3), being too busy or not wanting to continue (3) and entering hospice or being too ill (4). At the 6-month follow-up, 18 were analyzed, with reasons for non-participation including death (1), inability to contact (2), not wanting to continue (1) and end of study (4). At the 9-month follow-up, 12 were analyzed, with reasons for non-participation including death (1), inability to contact (1), not wanting to continue (1) and end of study (3). For the Alternative Control Group, at baseline, 42 were analyzed. At the 3-month follow-up, 30 were analyzed, with reasons for non-participation including death (6), inability to contact (2), not needing or wanting to continue (3) and no longer being eligible (1). At the 6-month follow-up, 17 were analyzed, with reasons for non-participation including death (3), inability to contact (3), not needing or wanting to continue (1) and end of study (6). At the 9-month follow-up, 12 were analyzed, with reasons for non-participation including death (1), inability to contact (1) and end of study (3). The funding was terminated early by NINR, NIH.
Forty-two parents were randomized to the experimental group, and 42 were randomized to the alternative control group. Fifty-six of the initial 84 parents (26 in the experimental group, 30 in the alternative control group) completed 3-month follow-up data. Sixteen patients died or became too ill to continue the study; 5 were lost to follow-up, 6 withdrew citing that they no longer needed or wanted the study, and 1 parent became ineligible to continue.
Of the 56 parents who completed 3-month outcome data, 35 (18 experimental and 17 control group) completed 6-month follow-up data. See Figure 1 for detailed reasons for patient attrition. There were 24 participants who completed 9-month follow-up data (12 experimental and 12 control group).
Description of study sample
Eighty-four parents were enrolled and randomized to this study. Parents averaged 46.89 ± 7.24 years of age, and 57 (67.86%) were female. Eighty (95.23%) of the dyads were married for an average of 16.35 ± 3.49 years. Children had an average age of 11.29 ± 3.42 years, and the majority (57.14%) were female.
The largest proportion of enrolled patients had a diagnosis of breast (28.57%), colorectal (23.81%), lung (10.71%), or brain cancer (15.48%). Patients had been diagnosed with advanced cancer for an average of 32.02 ± 36.61 months, and over 70% of the participants had undergone surgery for their cancer. Within the last 6 months, 46.67% received chemotherapy, 4.00% received radiation, and 49.33% received both types of therapy for their cancer.
The 35 participants who completed 6-month data collection were similar in the majority of demographic variables, for example, parents’ age (mean 46.14 ± 6.51), number of females (65.71%), and age of child (11.14 ± 2.91). Participants who completed 9-month data collection were on average 45.92 ± 5.64 years old, 62.50% were females, and children were a mean of 11.29 ± 3.07 years old. See Tables 2 and 3 for demographic, diagnosis, and treatment data at baseline and for those who completed 6- and 9-month follow-ups.
Study participants characteristics

Table 2 Long description
Demographic information is reported for study participants at baseline with N 84, at 6 months with N 35, and at 9 months with N 24. Age mean and standard deviation with median were 46.89 and 7.24 with median 47.00 at baseline, 46.14 and 6.51 with median 47.00 at 6 months, and 45.92 and 5.64 with median 46.50 at 9 months. Sex assigned at birth counts and percentages were males 26 and 30.95 percent, females 57 and 67.86 percent, and non binary 1 and 1.19 percent at baseline; males 11 and 31.43 percent, females 23 and 65.71 percent, and non binary 1 and 2.86 percent at 6 months; males 9 and 37.50 percent and females 15 and 62.50 percent at 9 months. Highest education completed was some high school or high school graduate 6 and 7.14 percent, some college or college graduate 41 and 48.81 percent, and masters or doctorate degree 37 and 44.05 percent at baseline; 1 and 2.86 percent, 21 and 60.00 percent, and 13 and 37.14 percent at 6 months; and 1 and 4.17 percent, 15 and 62.50 percent, and 8 and 33.33 percent at 9 months. Parent ethnicity Hispanic was 8 and 9.52 percent at baseline, 4 and 11.43 percent at 6 months, and 2 and 8.33 percent at 9 months, and parent White was 65 and 77.38 percent, 29 and 82.86 percent, and 18 and 75.00 percent. Marital status married was 80 and 95.23 percent at baseline, 34 and 97.14 percent at 6 months, and 24 and 100.00 percent at 9 months, and years in relationship with non ill partner mean and standard deviation with median were 16.35 and 3.49 with median 16.50, 17.28 and 5.03 with median 16.00, and 18.32 and 5.48 with median 17.50. Parent employment was full or part time 31 and 36.90 percent, medical leave of absence 18 and 21.43 percent, and staying at home full time retired not working 35 and 41.67 percent at baseline; 14 and 40.00 percent, 9 and 25.71 percent, and 12 and 34.29 percent at 6 months; and 9 and 37.50 percent, 8 and 33.33 percent, and 7 and 29.17 percent at 9 months. Income was under 50,000 with 9 and 10.71 percent at baseline, 3 and 8.57 percent at 6 months, and 1 and 4.17 percent at 9 months; 50,000 to 150,000 with 26 and 30.95 percent, 7 and 20.00 percent, and 4 and 16.67 percent; over 150,000 with 43 and 51.19 percent, 21 and 60.00 percent, and 17 and 70.83 percent; and do not know prefer not to answer with 6 and 7.14 percent, 4 and 11.43 percent, and 2 and 8.33 percent. Child age mean and standard deviation with median were 11.29 and 3.42 with median 11.00 at baseline, 11.14 and 2.91 with median 11.00 at 6 months, and 11.29 and 3.07 with median 11.00 at 9 months. Child gender was male 35 and 41.67 percent, female 48 and 57.14 percent, and non binary 1 and 1.19 percent at baseline; male 18 and 51.43 percent and female 17 and 48.57 percent at 6 months; and male 12 and 50.00 percent and female 12 and 50.00 percent at 9 months. Number of children in house was 1 to 2 with 66 and 78.57 percent at baseline, 29 and 82.86 percent at 6 months, and 19 and 79.186 percent at 9 months, and 3 or more with 18 and 21.43 percent, 6 and 17.14 percent, and 5 and 20.83 percent.
Description of diagnosis, type of cancer, and medical treatment

Table 3 Long description
Columns report study participants at baseline with N 84, at 6 months with N 35, and at 9 months with N 24. Months since initial cancer diagnosis are 51.03 mean with 54.98 SD and median 37.58 at baseline, 46.40 mean with 59.40 SD and median 23.03 at 6 months, and 44.30 mean with 66.22 SD and median 18.87 at 9 months; length of time modal is 2.00 months, 1.84 months, and 1.84 months. Months since adv cancer diagnosis are 32.02 mean with 36.61 SD and median 15.85 at baseline, 27.36 mean with 29.46 SD and median 15.28 at 6 months, and 23.38 mean with 24.59 SD and median 13.11 at 9 months; length of time modal is 2.37 months, 0.46 months, and 0.46 months. Type of cancer counts and percentages at baseline include breast 24 at 28.57%, colorectal 20 at 23.81%, lung 9 at 10.71%, stomach 2 at 2.38%, brain 13 at 15.48%, esophageal 2 at 2.38%, and single cases at 1.19% each for melanoma, lymphoma, uterine, bone, pancreatic, appendix, ocular melanoma, thymus carcinoma, RET genetic mutation, paraganglioma, sarcoma, neuroendocrine carcinoma, chondrosarcoma, and bile duct cancer. At 6 months, breast is 10 at 28.57%, colorectal 11 at 31.43%, lung 6 at 17.14%, stomach 1 at 2.86%, brain 3 at 8.57%, esophageal 1 at 2.86%, bone 1 at 2.86%, appendix 1 at 2.86%, and RET genetic mutation 1 at 2.86%. At 9 months, breast is 7 at 29.17%, colorectal 8 at 33.33%, lung 4 at 16.67%, stomach 1 at 4.17%, brain 2 at 8.33%, esophageal 1 at 4.17%, and appendix 1 at 4.17%. Surgery for cancer is 59 at 70.24% at baseline, 25 at 71.43% at 6 months, and 17 at 70.83% at 9 months. Received chemo or radiation in last 6 months is 75 at 88.10% at baseline, 31 at 88.57% at 6 months, and 21 at 87.50% at 9 months, with breakdowns of radiation 3 at 4.00%, 2 at 6.45%, and 2 at 9.52%; chemotherapy 35 at 46.67%, 16 at 51.61%, and 12 at 57.14%; and both 37 at 49.33%, 13 at 41.94%, and 7 at 33.33%.
Results
Data analysis methods
Prior to testing efficacy, outcome measures were inspected for sampling distributions, outliers, and covariates. All outcome measures were normally distributed; no data transformation was needed.
Pretreatment equivalence between the randomization groups was examined on demographic and diagnostic measures using independent t-tests and chi-squared analysis. No significant differences were found between the 2 randomization groups on any of the demographic or diagnostic variables.
Randomization groups were additionally tested to assess comparability on outcome measures at baseline for participants who completed 3-month assessments. The 2 groups were comparable with 1 exception. Participants in the control group had significantly higher scores on the psychological symptoms score on the Condensed Memorial Symptoms Assessment scale compared to participants in the experimental group for those who completed 3-month assessments (p = 0.007, 2-tailed independent t-test). Additionally, baseline measures were analyzed by comparing randomization groups for participants who completed 6- and 9-month follow-up dates. As with the full sample size, the 2 groups were comparable with the exception of the Condensed Memorial Symptoms Assessment scale psychological symptoms score, which was significantly higher for participants in the alternative treatment control group. The psychological symptoms score was used as a covariate in all subsequent analyses.
Linear Mixed Models with intent-to-treat analyses were used to determine changes in outcome measures over time. Planned comparisons were made between baseline and 6 months and between baseline and 9 months follow-up.
Results
Overall results: There were significant improvements for the experimental group compared to the control group at 6- and 9-month follow-ups for all time points on parenting skills. There were significant improvements in the control group compared to the experimental group at 6- and 9-month follow-ups on the parents’ self-confidence in helping their family manage the cancer. See Table 4.
Outcome measures over time by randomization groupa

Table 4 Long description
Outcome measures are reported as mean and standard error for control and experimental groups at baseline and at 3, 6, and 9 months post baseline, with effect size and p value columns for change from baseline at each follow up. Depressed Mood means and standard errors were 15.86 and 1.06 for control and 17.41 and 1.05 for experimental at baseline; 14.96 and 1.48 for control and 15.07 and 1.57 for experimental at 3 months with d a 0.28 and p value a 0.502; 14.24 and 2.19 for control and 17.07 and 2.15 for experimental at 6 months with d b 0.04 and p value b 0.695; 10.92 and 1.94 for control and 17.67 and 1.96 for experimental at 9 months with d c 0.14 and p value c 0.098. Anxiety means and standard errors were 37.93 and 1.36 for control and 36.77 and 1.35 for experimental at baseline; 36.55 and 1.92 for control and 36.39 and 2.02 for experimental at 3 months with d a 0.06 and p value a 0.686; 36.68 and 2.70 for control and 38.94 and 2.67 for experimental at 6 months with d b 0.44 and p value b 0.376; 33.41 and 2.48 for control and 36.13 and 2.50 for experimental at 9 months with d c 0.54 and p value c 0.314. Parenting confidence, CASE includes Help Child, Deal and Manage, and Stay Calm: Help Child was 61.26 and 2.84 for control and 59.72 and 2.83 for experimental at baseline; 69.09 and 2.13 for control and 72.06 and 2.23 for experimental at 3 months with d a 0.29 and p value a 0.171; 71.56 and 2.66 for control and 67.88 and 2.65 for experimental at 6 months with d b 0.52 and p value b 0.633; 72.52 and 2.93 for control and 70.37 and 2.96 for experimental at 9 months with d c 0.19 and p value c 0.908. Deal and Manage was 95.08 and 2.91 for control and 95.49 and 2.89 for experimental at baseline; 102.93 and 2.68 for control and 102.24 and 2.80 for experimental at 3 months with d a 0.09 and p value a 0.768; 106.04 and 3.04 for control and 96.13 and 3.0 for experimental at 6 months with d b 0.48 and p value b 0.040; 110.69 and 3.40 for control and 98.84 and 3.43 for experimental at 9 months with d c 0.32 and p value c 0.038. Stay Calm was 48.90 and 1.48 for control and 47.99 and 1.47 for experimental at baseline; 52.60 and 1.21 for control and 51.00 and 1.28 for experimental at 3 months with d a 0.16 and p value a 0.715; 53.41 and 1.55 for control and 48.72 and 1.53 for experimental at 6 months with d b 0.60 and p value b 0.149; 53.23 and 1.48 for control and 49.10 and 1.51 for experimental at 9 months with d c 0.36 and p value c 0.250. CBCL includes Internalizing and Externalizing: Internalizing was 57.81 and 1.45 for control and 58.48 and 1.44 for experimental at baseline; 55.11 and 1.71 for control and 56.09 and 1.75 for experimental at 3 months with d a 0.01 and p value a 0.874; 55.91 and 2.17 for control and 55.67 and 2.12 for experimental at 6 months with d b 0.02 and p value b 0.755; 55.75 and 1.88 for control and 57.84 and 1.90 for experimental at 9 months with d c 0.24 and p value c 0.631. Externalizing was 50.83 and 1.49 for control and 52.49 and 1.48 for experimental at baseline; 48.20 and 1.75 for control and 49.93 and 1.78 for experimental at 3 months with d a 0.02 and p value a 0.962; 49.14 and 2.02 for control and 49.15 and 2.00 for experimental at 6 months with d b 0.38 and p value b 0.509; 49.88 and 2.08 for control and 49.85 and 2.08 for experimental at 9 months with d c 0.14 and p value c 0.566.
a Analysis controlled for differences between experimental and control groups on psychological symptoms at baseline.
b Cohen’s d/p-value = Effect size and p-value for change from baseline to 3 months by randomization group.
c Cohen’s d /p-value = Effect size and p-value for change from baseline to 6 months by randomization group.
d Cohen’s d /p-value = Effect size and p-value for change from baseline to 9 months by randomization group.
Depressed mood
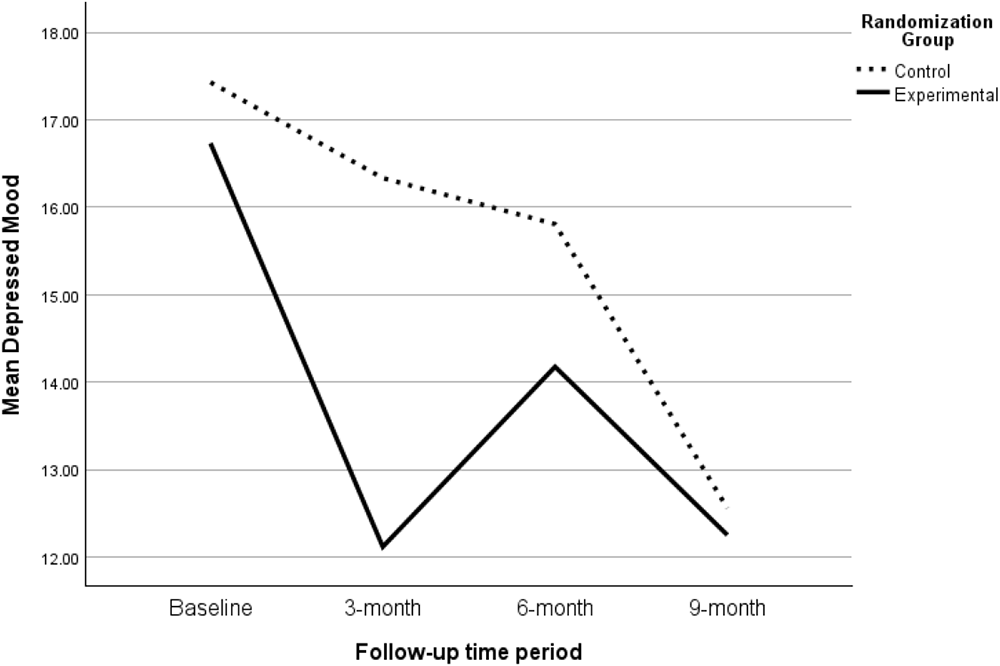
There were no significant differences in parents’ depressed mood between the experimental and control groups at any time point. The pattern was for parents in the control group to show a steady decline in depressed mood over all time periods, while parents in the experimental group declined initially but then increased at 6 months, then decreased again at 9 months. See Figure 2.
Parent depressed mood by randomization group at 3, 6, and 9 months.

Anxiety
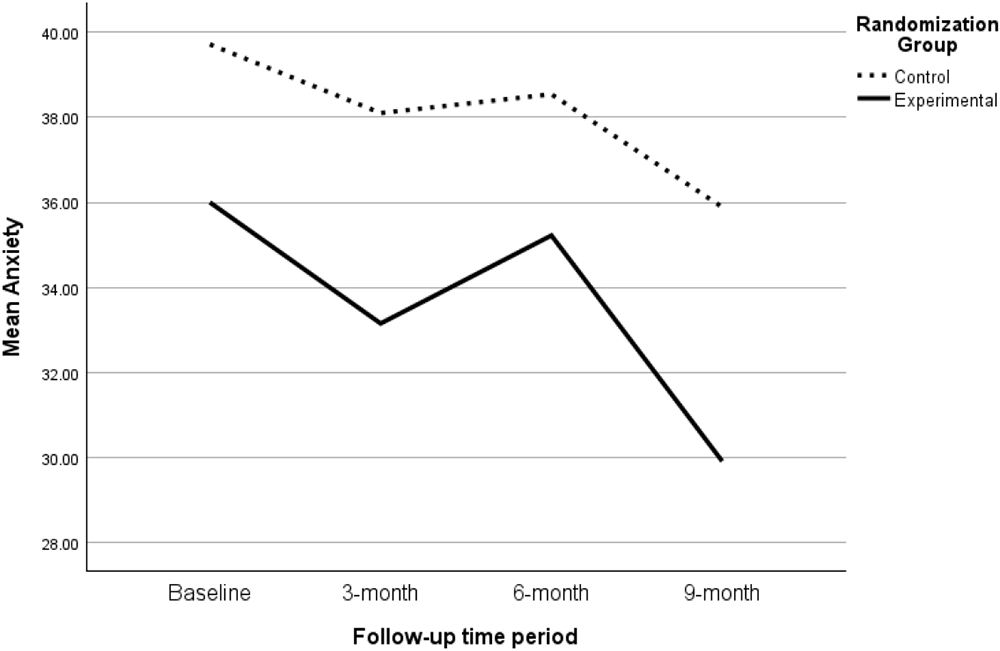
There were no significant differences in parent anxiety between the experimental and control groups at any time point. Parents in both groups declined in anxiety at 3 months and showed increased anxiety at 6 months, which then declined slightly at 9 months. See Figure 3.
Parent anxiety by randomization group at 3, 6, and 9 months.

Parenting skills
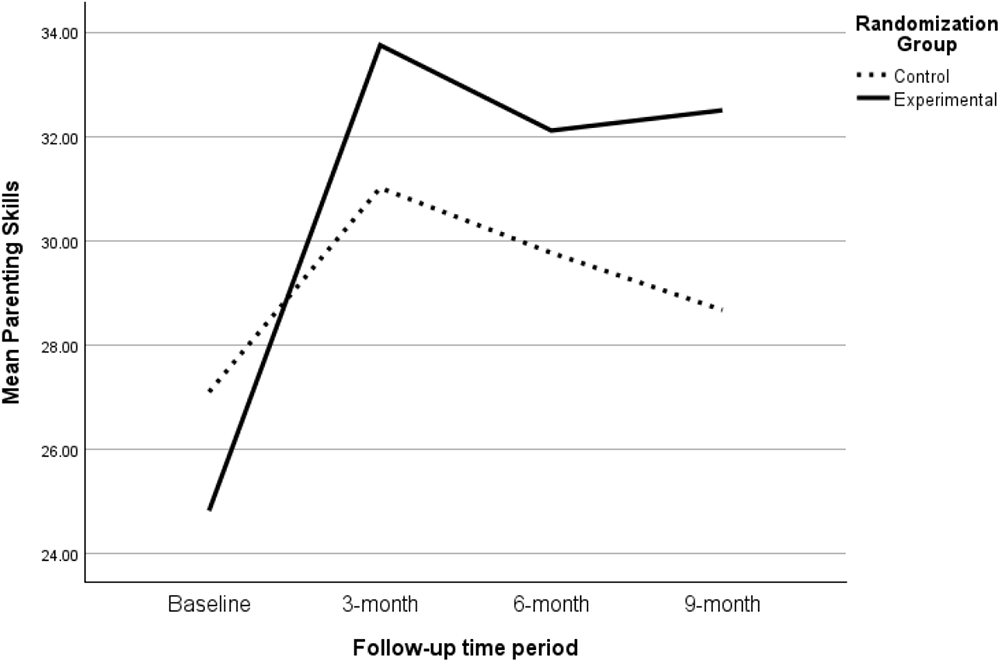
Outcomes at 3 months showed a statistically significant improvement in parenting skills in the experimental group compared to the alternative treatment control group (Lewis et al. Reference Lewis, Griffith and Ganschow2026). These significant differences in parenting skills were sustained at 6- and 9-month follow-ups. Effect sizes were clinically significant at all assessment periods. Effect sizes at 6 and 9 months were larger in magnitude than those at 3 months. Specifically, the d-score at 6 months was 0.89 (p = 0.05) and was 0.92 (p = 0.05) at 9 months, both of which were larger in magnitude than the d-score at 3 months. See Table 5. The pattern in the experimental group was for parenting skills to increase at 3 months, then decrease at 6 months, but then increase at 9 months. Scores in the control group increased at 3 months but steadily decreased at 6 and 9 months. See Figure 4 and Table 4.
Parenting skills by randomization group at 3, 6, and 9 months.

Effect sizes for parenting skills for experimental and control groups at 6- and 9-month post-baseline

Table 5 Long description
Parenting skills are reported for control group, experimental group, and total, with mean, standard deviation, and N at baseline and at 3 months, 6 months, and 9 months, plus the difference from baseline to each follow up. Control group means were 27.17 at baseline and 31.01 at 3 months, difference 3.85, with standard deviations 13.00 and 11.48 and N 30; at 6 months, baseline 28.00 and 6 months 29.76, difference 1.76, standard deviations 12.68 and 12.09 and N 17; at 9 months, baseline 27.00 and 9 months 28.67, difference 1.67, standard deviations 11.73 and 12.12 and N 12. Experimental group means were 24.08 at baseline and 33.75 at 3 months, difference 9.68, standard deviations 11.67 and 10.43 and N 26; at 6 months, baseline 21.89 and 6 months 32.11, difference 10.22, standard deviations 11.13 and 10.64 and N 18; at 9 months, baseline 19.92 and 9 months 32.50, difference 12.58, standard deviations 12.00 and 11.32 and N 12. Total means were 25.73 at baseline and 32.28 at 3 months, difference 6.56, standard deviations 12.39 and 10.99 and N 56; at 6 months, baseline 24.86 and 6 months 30.97, difference 6.11, standard deviations 12.13 and 11.26 and N 35; at 9 months, baseline 23.46 and 9 months 30.58, difference 7.13, standard deviations 12.16 and 11.64 and N 24. Effect size values are listed as 0.54 for the 3 month section, 0.89 for the 6 month section, and 0.92 for the 9 month section.
Parenting self-efficacy
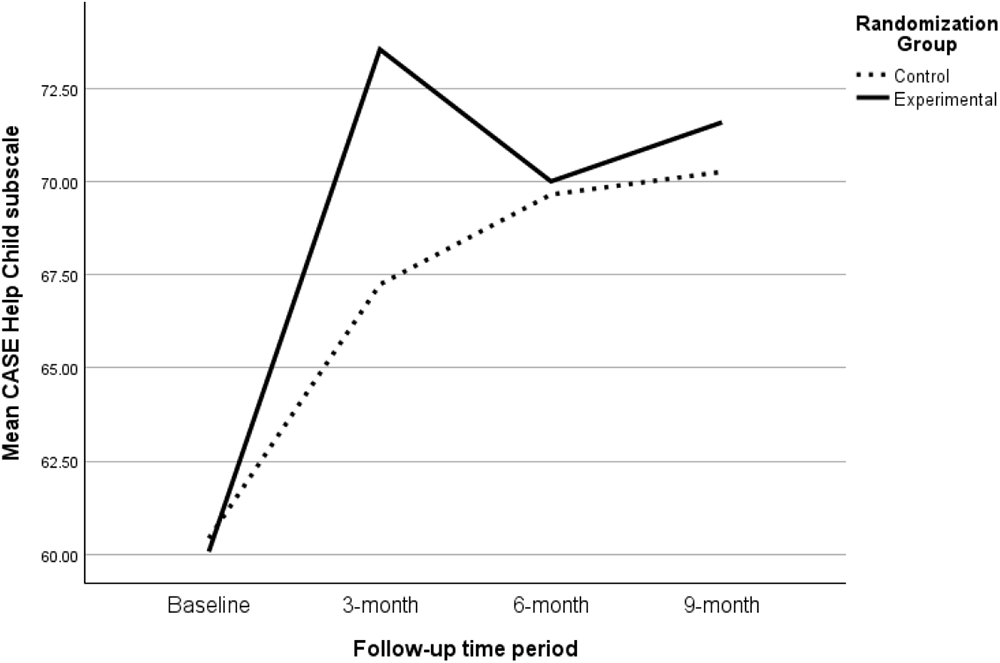
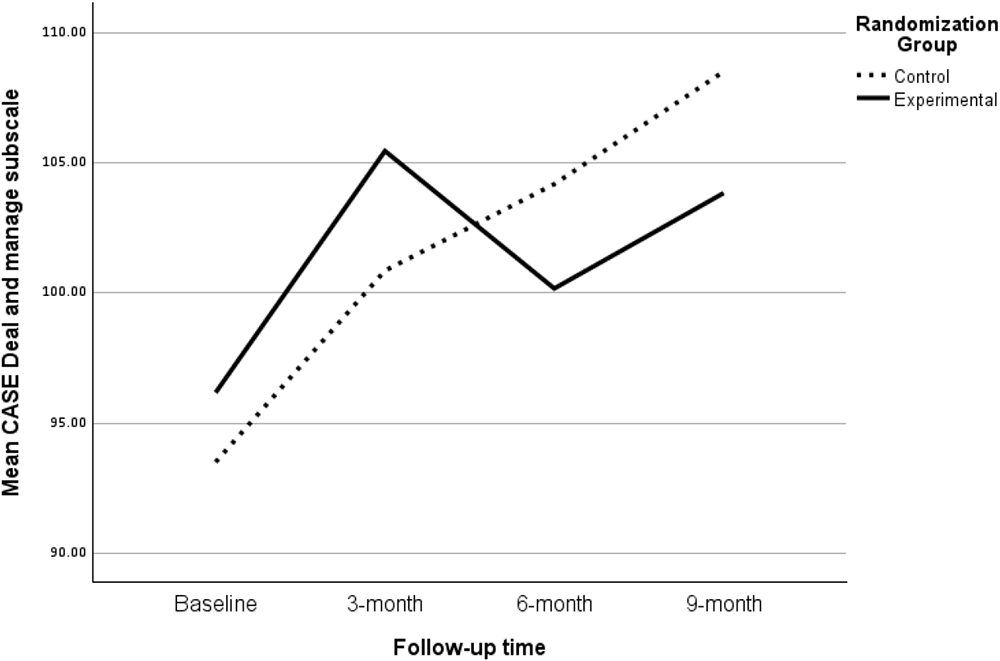
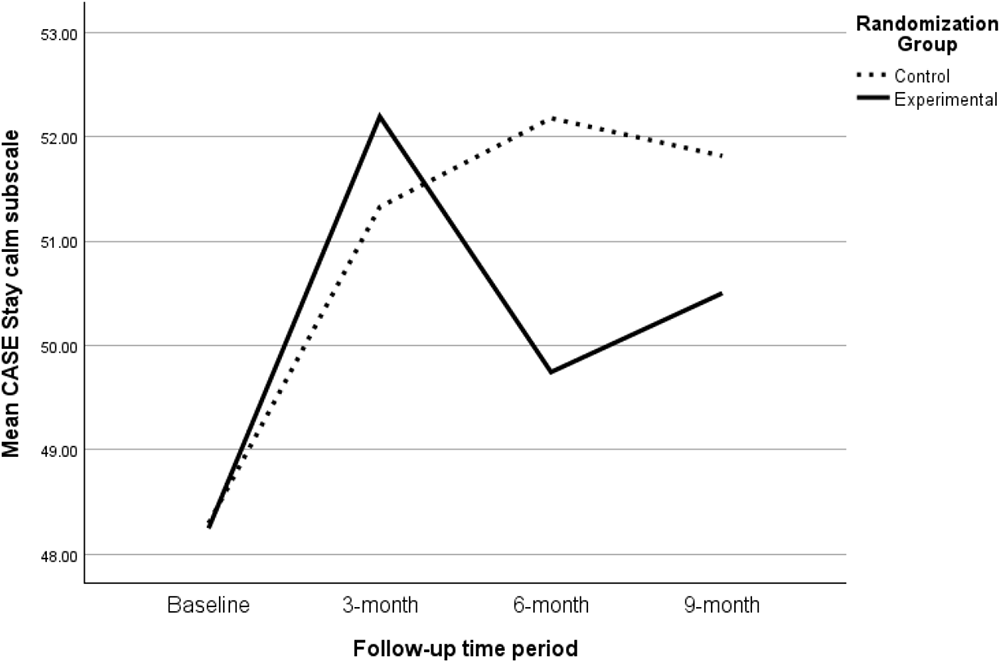
In contrast to results on the measure of parenting skills, improvements in parents’ self-confidence benefited the alternative treatment control group. More specifically, there were significant improvements in scores on the Deal and Manage subscale of the CASE at 6 and 9 months in the control group. The pattern was for the control group to improve continually at each assessment period, while the experimental group improved at 3 months but then declined at the 6-month follow-up. There was improvement in the experimental group at 9 months, but not to the level of improvement observed at 3 months. See Figure 6. The effect size at 3 months for this subscale was only d = 0.09. Scores at 6 and 9 months were statistically significant, with a moderate effect size at 6 months (d = 0.48) and a small effect size at 9 months (d = 0.32). Analysis of the other 2 parenting self-efficacy subscales, the Help Child subscale and the Stay Calm subscale, showed no significant changes over time. The pattern for the Stay Calm subscale mirrored that of the Deal and Manage subscale. See Figures 5 and 7.
CASE – Help Child subscale by randomization group at 3, 6, and 9 months.

CASE – Deal and Manage subscale by randomization group at 3, 6, and 9 months.

CASE – Stay Calm subscale by randomization group at 3, 6, and 9 months.

Child behavioral and emotional (CBCL) adjustment
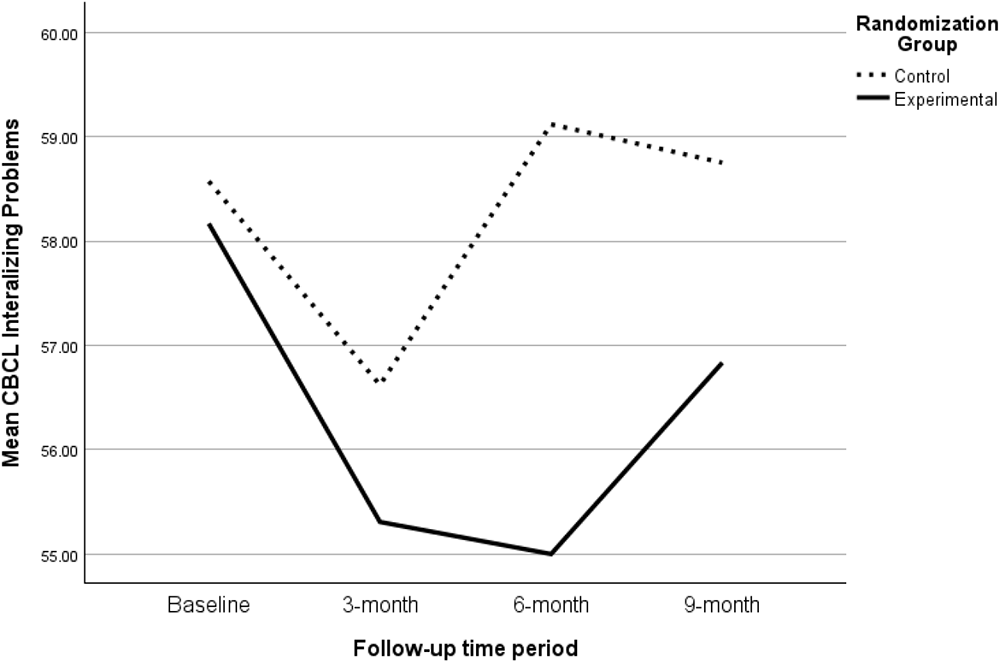
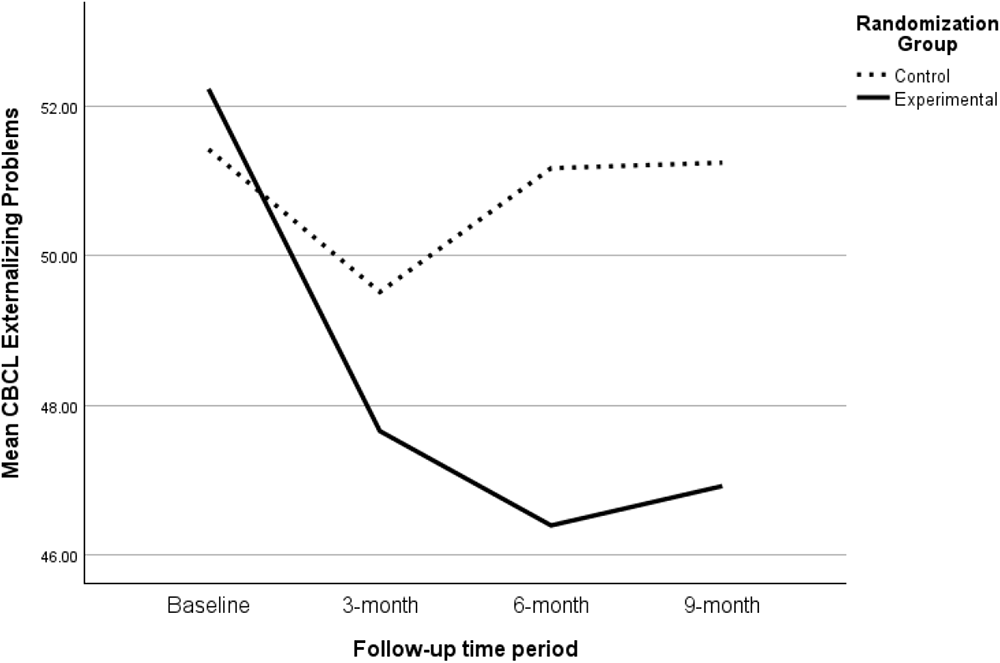
There were no significant changes over time between the experimental and control groups on Internalizing or Externalizing Problems. Although Child Behavioral and Emotional adjustment improved slightly at 3 months on both Internalizing and Externalizing Problems for both randomization groups, the scores stabilized at 6 and 9 months. See Figures 8 and 9. Recall that lower scores on these measures denote better adjustment.
Child Behavioral Checklist – Internalizing Problems subscale by randomization group at 3, 6, and 9 months.

Child Behavioral Checklist – Externalizing Problems subscale by randomization group at 3, 6, and 9 months.

Discussion
A telephone-delivered manualized cancer parenting counseling program for child-rearing parents with advanced cancer significantly improved parenting skills at 3, 6, and 9 months. Results from the current study demonstrated that the early significant gains in skills at 3 months were not just significantly sustained at 6 and 9 months, but the differences between groups steadily increased. More specifically, parenting skills in the experimental group remained significantly higher than controls at all 3 assessment periods: 3, 6, and 9 months. The magnitude of the effect sizes at 6 and 9 months was even larger than the effect sizes achieved at 3 months. Once parents gained skills, they retained them.
Analysis over time revealed another result that benefited the control group. Parenting self-efficacy improved in the control group on the Deal and Manage subscale of the CASE. An inspection of items on that subscale raises a question which we are unable to answer. We do not know why self-efficacy improved on that subscale whose items read, “I am able to deal with the feelings of loss brought on by the cancer” and “I have ways to manage the uncertainty brought on by the cancer.” The EC-PC program did not directly target those areas. We speculate that improvements in this subscale reflected a generalized diffusion of benefit but not an alternative treatment effect. Content of the subscale had nothing to do with the content in the alternative treatment control group booklet.
Attrition from the experimental and control groups was high. See Figure 1. A total of 25 study participants were lost to follow-up at 6 months in the control group and 24 in the experimental group; a total of 30 participants were lost at 9 months in the control group and 30 in the experimental group. Between 6 and 9 months of follow-up, 2 participants died because of illness-related reasons in the experimental group. Four participants died for the same reasons in the alternative control group. This high attrition due to death and illness-related causes at both the primary endpoint and end of study is high compared to studies of palliative care patients; Hui’s team reported a 28% attrition for primary endpoint and 44% for end of study (Hui et al. Reference Hui, Glitza and Chisholm2013).
Estimates in the current study should be considered statistically biased. It is always possible that results in a future study with a different sample from this population would be different than those reported from the current study. We do not know the direction of that bias; one possibility is self-enhancement bias. However, the lack of improvement in parents’ report of their child’s Internalizing and Externalizing Problems in both the experimental and control groups does not support a self-enhancement bias. If such an enhancement bias existed, scores on Externalizing and Internalizing Problems would have improved in both groups. See Figures 8 and 9. Instead of a self-enhancement bias, we suggest that results at both 6 and 9 months are valid and come from highly motivated and accurate reporters who, despite their negative prognosis, were committed to being the best parent they could be (Zahlis et al. Reference Zahlis, Shands and Lewis2020). Less committed and motivated parents would not likely improve to the same extent as did parents in the current study.
Study limitations
Results reported in the current study should be viewed with caution. Outcomes are based on a small sample of parents on whom data were collected at 6 and 9 months. The magnitude of effect sizes (Cohen’s d) for the outcomes should be viewed as preliminary estimates. Recall that effect sizes are calculated on raw data and are a function of sampling variability between occasions and sample size. We are optimistically cautious that the increased magnitude of statistically significant differences between baseline and 6 months and baseline and 9 months represents a true differential benefit of the experimental compared to control group. However, a study with a larger sample size is needed to further examine effects over time.
The current study was statistically underpowered. The target enrollment that would have provided sufficient statistical power was not realized despite best efforts. (See details in the 3-month outcome publication (Lewis et al. Reference Lewis, Griffith and Ganschow2026)).
Data availability statement
The data sets analyzed and used in this current study can be made available from the corresponding author upon reasonable request with limitations.
Acknowledgments
We dedicate this paper to Cynthia Foss Brunk, to the parents who participated, and to providers and site intermediaries who donated their time to refer patients. Additional thanks are due to members of the research staff and team: Ellen H. Zahlis, MN; Mary Ellen Shands, MN; VK Gadi, MD, PhD; Kenneth P. Tercyak, PhD; Jami Fukui, MD; Pam Ganschow, MD; Danny Do; Tessa Floyd; Patricia Brandt, PhD; Priscilla Carmiol Rodriguez, MEd, MS; Tzu- Hsien Lee, MSN, BSN; Patricia J. Li, BSN; Johnny Nguyen, MS; Meshack Otewa, BSN; Avery Park, MSN, MA; Natalie Rejto, PhD; Jennifer Perkins, BSN, MS; Farah AY Schumacher, BSN, MS; Jason C. Schwartz, EdS; Keyona Nelson, BSN; and Xiaoyu Zhang, MS, BSN.
Funding
Research reported in this publication was supported by the National Institute of Nursing Research, National Institutes of Health, under award number R01NR019987. Preparation of this manuscript was supported by funds from the Susan G Komen Foundation Professor of Cancer Survivorship Award given to Lewis. The content is solely the responsibility of the authors and does not necessarily reflect any official views of the National Institutes of Health or the Komen Foundation.
Competing interests
The authors have no conflicts of interest to declare.
Ethical approval
This grant was reviewed and approved by the University of Washington Human Subjects Committee (STUDY00011221). All participants signed informed consent.
Ethics and consents
NCT05477784.




 Open access

