Implications
Sub-clinical stress responses can be identified by observing haematological profiles. We have shown using haematological profiles that gradual weaning of artificially reared dairy calves is welfare friendly, as it does not induce the typical neutrophilia and lymphopaenia associated with a pro-inflammatory stress response, in either Holstein-Friesian or Jersey calves. Furthermore, plane of nutrition does not affect the artificially reared dairy calves’ immune response to gradual weaning. Breed influences both haematological profiles and whole blood gene expression, with Jersey calves having a more sensitive immune system. Knowledge of breed-specific differences in immune responsiveness should lead to improvements in breed targeted veterinary treatments.
Introduction
Weaning is a fundamental husbandry management practice but is also a multifactorial stressor as it often involves a combination of dietary change, maternal separation, social disruption and movement to a new environment (Weary et al., Reference Weary, Jasper and Hötzel2008). Stress induced by abrupt weaning, maternal separation and transportation of suckled beef calves alters the immune response and increases susceptibility to fatal bovine respiratory disease (Hodgson et al., Reference Hodgson, Aich, Stookey, Popowych, Potter, Babiuk and Griebel2012). Our group has previously reported that abrupt weaning exerts an acute stress response in single-suckled beef calves, characterised by changes in the distribution of haematological cells (Lynch et al., Reference Lynch, Earley, McGee and Doyle2010; O’Loughlin et al., Reference O’Loughlin, McGee, Doyle and Earley2011) and up-regulation in expression of genes involved in the pro-inflammatory response (O’Loughlin et al., Reference O’Loughlin, McGee, Doyle and Earley2011).
The effect of weaning from milk independent of the other associated stressors can be examined using artificially reared dairy calves, as dairy calves are normally removed from their dams at birth and fed by artificial means thereafter. However, there is a paucity of published research on the immune response to weaning from a liquid based diet in the artificially reared dairy calf. Artificially reared dairy calves are typically weaned from milk either abruptly, or gradually. Abrupt weaning of artificially reared dairy calves has led to increased vocalisation, activity, cross-suckling and unrewarded occupancy at a milk feeder (Budzynska and Weary, Reference Budzynska and Weary2008; Nielsen et al., Reference Nielsen, Jensen and Lidfors2008), whereas gradual weaning has increased both starter consumption and feed efficiency, improved rumen function and reduced losses in average daily gain (Khan et al., Reference Khan, Lee, Lee, Kim, Kim, Ki, Ha, Lee and Choi2007; Sweeney et al., Reference Sweeney, Rushen, Weary and de Passillé2010).
Breed can influence immune responses. For example, during the immediate post-weaning period, tumour necrosis factor-α was secreted in greater quantities from stimulated mononuclear cells isolated from Holstein-Friesian (H-F) calves compared with Jersey (J) calves, and additionally, blood from H-F calves had more intense neutrophil oxidative burst activity and cytotoxic potential in response to incubation with Escherichia coli (Ballou, Reference Ballou, Cobb, Earleywine and Obeidat2012). However, studies investigating the effect of plane of nutrition on dairy calf health parameters have produced varying results. Feeding dairy calves a higher plane of nutrition improved neutrophil oxidative burst intensities after co-culture with E. coli in one study (Ballou, Reference Ballou, Cobb, Earleywine and Obeidat2012), while in another study the authors found increased oxidative burst intensities from calves on a low plane of nutrition (Obeidat et al., Reference O’Loughlin, McGee, Waters, Doyle and Earley2013). More nitric oxide, which can cause tissue damage, when produced in excess, was secreted from mononuclear leukocytes of calves fed greater quantities of milk replacer (MR) to achieve a high growth rate (Foote et al., Reference Foote, Nonnecke, Beitz and Waters2007). Furthermore, viabilities of specific T cell subsets were lower in cells cultured from these calves (Foote et al., Reference Foote, Nonnecke, Beitz and Waters2007).
Two of the predominant dairy breeds used internationally, including in Ireland, are H-F and J (DAFM, 2013; Dhakal et al., Reference Dhakal, Maltecca, Cassady, Baloche, Williams and Washburn2013). They also vary greatly in many body characteristics including birth weight (Dhakal et al., Reference Dhakal, Maltecca, Cassady, Baloche, Williams and Washburn2013) and subsequent growth rate (Ballou et al., Reference Ballou2013). Therefore, these breeds were chosen to characterise the immune response to gradual weaning in dairy calves. The objectives of the study were (i) to examine the effect of breed and plane of nutrition, on the haematological profiles of artificially reared dairy calves in response to gradual weaning, and (ii) to examine the effect of breed on the expression of genes involved in the immune response in whole blood using real-time quantitative PCR (qPCR).
Material and methods
All animal procedures performed in this study were conducted under experimental licence from the Irish Department of Health and Children (licence number B100/2869). Protocols were in accordance with the Cruelty to Animals Act (Ireland 1876, as amended by European Communities regulations 2002 and 2005) and the European Community Directive 86/609/EC.
Animal management
H-F (n=44) and J (n=29) clinically healthy bull calves were purchased at (mean age (SD)) 19 (8) days, acclimatised to electronic feeding and subsequently group housed indoors at Teagasc, Grange Beef Research Centre on sawdust floored pens (balanced for breed) from day (d) −56 (relative to weaning (d 0)) to d 28 of the study. All H-F calves came from a single farm and J calves were sourced from three farms. Calves were sourced from preferential supplier farms which all practiced excellent postnatal health management (Lorenz et al., Reference Lorenz, Mee, Earley and More2011). Calves were immunised on arrival against infectious bovine rhinotracheitis (IBR), PI-3-virus, BRS-virus, Mannheimia haemolytica serotypes A1 and A6 and Salmonella dublin and Salmonella typhimurium using Rispoval IBR-Marker live, Bovipast RSP and Bovivac S vaccines, respectively.
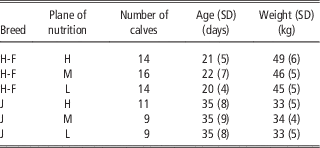
The study was structured as a factorial design with two breeds H-F and J, and three planes of nutrition (high (H), medium (M) and low (L)) within breed. Within each breed, calves were stratified to a nutrition treatment on the basis of live-weight, age at the first day of the study (d −56) and sire (Table 1). The planes of nutrition for each breed were devised using National Research Council (NRC, 2001) guidelines to achieve a target growth rate of ⩾1.0, 0.7 and <0.5 kg/day, for H-F on the H, M and L planes of nutrition and a target growth rate of 0.7, 0.5 and ⩽0.3 kg/day, for J on the H, M and L planes of nutrition, respectively (NRC, 2001) (Table 1).
Calves per nutrition treatment

H-F=Holstein-Friesian; J=Jersey; H=high plane of nutrition; M=medium plane of nutrition; L=low plane of nutrition.
Calves were fed a 23% CP, 18% lipid MR (Blossom Easymix; Volac, Co., Cavan, Ireland) and concentrate (26.5% barley, 25% soya, 15% maize, 12.5% beet pulp, 12.5% soya hulls, 5% molasses, 2.5% minerals, 1% vegetable oil (18.8% CP, 22.4% NDF, 11.06 MJ ME/kg dry matter (DM)) using automatic milk (Vario Powder; Förster-Technik GmbH, Engen, Germany) and concentrate (KFA3-MA3; Förster-Technik GmbH) feeders. The pre-weaning, weaning and post-weaning periods were defined as days −56 to −14, −13 to 0 (milk feeding ceased) and 1 to 14, respectively. During the pre-weaning period, H-F calves on the H, M and L planes of nutrition were offered 1.2 kg MR (8 l at 150 g/l) with ad libitum concentrate, 0.8 kg MR (6 l at 133.33 g/l) with a maximum of 1.5 kg concentrate and 0.5 kg MR (4 l at 125 g/l) with a maximum of 1 kg concentrate, daily, respectively. The J calves on the H, M and L planes of nutrition were offered 0.8 kg MR (6 l at 133.33 g/l) with ad libitum concentrate, 0.5 kg MR (4 l at 125 g/l) with a maximum of 1.5 kg concentrate and 0.35 kg MR (3.5 l at 100 g/l) with a maximum of 1 kg concentrate, daily, respectively.
During the weaning phase daily MR was gradually reduced and by d −1, all calves were consuming at least 1 kg of concentrate per day for 3 consecutive days. On d 0, MR was eliminated from the diet of all calves. Concentrate allocation increased post-weaning to 2 kg and 1.7 kg, for H-F calves on the M and L nutrition treatments, respectively, and increased to 1.7 kg and 1.4 kg, for J calves on the M and L nutrition treatments, respectively. Animals on the H treatment within both breeds received ad libitum access to concentrate feed. Throughout the study period, calves were weighed on a weekly basis, at approximately the same time each day using a calibrated weighing system.
Blood sample collection
At arrival, blood samples were collected from all calves via jugular venepuncture into 8.5 ml BD Serum Separator Tube II Advance tubes (BD Vacutainer; Unitech, Dublin, Ireland). The serum was harvested and samples were stored at −20°C pending zinc sulphate turbidity (ZST) test analysis.
On d −14, −6, −3, 0, 1, 3, 8 and 14 relative to weaning (d 0), calves were blood sampled via jugular venepuncture for subsequent haematological analysis. Blood samples were collected in 6 ml K3Ethylenediaminetetraacetic acid (K3EDTA) tubes (Vacuette; Cruinn Diagnostics, Dublin, Ireland). Blood samples were also collected in 9 ml Lithium Heparin (LH) tubes (Vacuette; Cruinn Diagnostics) for determination of the quantity of the acute phase protein, haptoglobin, on d −14, −3, 1, 8 and 14 relative to weaning (d 0).
A subset of eight H-F calves randomly selected from calves offered the M plane of nutrition and eight J calves randomly selected from calves offered the H plane of nutrition, were blood sampled for gene expression profiling, targeting genes previously found to be affected by weaning (O’Loughlin et al., Reference O’Loughlin, McGee, Doyle and Earley2011). These two treatment groups were chosen to examine the effect of breed on expression of the genes of interest, as energy intake and animal performance were similar. Calves on both treatments were offered 0.8 kg MR (6 l at 133.33 g/l) and at least 1.5 kg concentrates pre-weaning and at least 2 kg concentrates post-weaning. Eight H-F ((mean age (SD)) 23 (7) d, (mean weight (SD)) 46 (6) kg) and eight J bull calves (37 (8) d, 34 (5) kg), were blood sampled via jugular venepuncture on d −14, 1 and 8, relative to weaning, d 0. Jugular vein blood samples (3 ml) were collected in TempusTM blood RNA Tubes containing RNA stabilisation solution (Applied Biosystems, Foster City, CA, USA). These blood samples were shaken vigorously by hand for 20 s immediately after collection and were stored at −80°C until analysis.
Haematology
The ZST test (proxy for immunoglobulin status; Earley et al., Reference Earley, McGee, Fallon, Drennan, Murray and Farrell2000) was performed at 20°C on serum samples collected from the calves at arrival with the turbidity subsequently measured at 520 nm using a spectrophotometer (McEwan et al., Reference McEwan, Fisher, Selman and Penhale1970).
Whole K3EDTA blood samples were analysed immediately after collection using an ADVIA 2120 analyser (AV ADVIA 2120; Bayer Healthcare, Siemens, UK), which contained software necessary for the analysis of bovine blood.
LH blood samples were centrifuged at 4°C (1600×g for 15 min) and plasma was harvested and stored at −20°C until assayed. The haptoglobin concentration was measured using an automatic analyser (Olympus AU 400 Analyser; Beckman Coulter, Inc., Clare, Ireland) and a commercial assay kit (Tridelta Development Ltd, Wicklow, Ireland) using the manufacturer’s procedure, described by Eckersall et al. (Reference Eckersall, Duthie, Safi, Moffatt, Horadagoda, Doyle, Parton, Bennett and Fitzpatrick1999).
RNA extraction and complementary DNA (cDNA) synthesis
RNA was extracted from whole blood using the TempusTM Spin RNA Isolation Reagent Kit (Applied Biosystems, Foster City, CA, USA) according to manufacturer’s instructions, utilising the optional DNase step. A Nanodrop spectrophotometer (NanoDrop Technologies, Wilmington, DE, USA) was used to quantify the RNA. The quality of the RNA was assessed with an Agilent 2100 Bioanalyser (Agilent Technologies Ireland Ltd, Dublin, Ireland). All samples had an RNA integrity number of between 8.9 and 10. The cDNA was synthesised in a 20 µl reaction, according to the manufacturer’s instructions, from 1 µg of total RNA per sample, utilising the High Capacity cDNA Reverse Transcription kit (Applied Biosystems). The cDNA was stored at −20°C until analysis.
Real-time qPCR
Primer sequences for the candidate genes were obtained from the literature (Supplementary Table S1) and were commercially synthesised (Sigma-Aldrich Ireland Ltd, Dublin, Ireland). Serial dilutions of pooled cDNA samples were used to determine amplification efficiencies using the equation E=−1+10(−1/slope). The slope was calculated by plotting the linear curve of cycle threshold (Cq) values against the log dilutions (Pfaffl, Reference Pfaffl2001). Primers had PCR efficiencies of between 88% and 107% (Table 2).
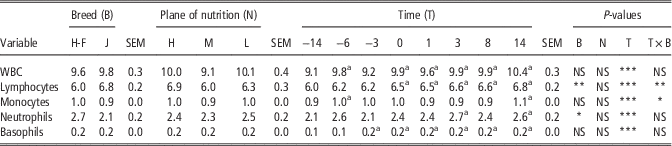
Effect of breed and plane of nutrition on WBC, lymphocyte, monocyte, neutrophil and basophil number, during gradual weaning in H-F and J calves

H-F=Holstein-Friesian; J=Jersey; WBC=white blood cell (×103 cells/µl); Lymphocytes=lymphocytes (×103 cells/µl); Monocytes=monocytes (×103 cells/µl); Neutrophils=neutrophils (×103 cells/µl); Basophils=basophils (×103 cells/µl); H=high plane of nutrition; M=medium plane of nutrition; L=low plane of nutrition; B = effect of breed.
Time (T) represents day number relative to weaning (day 0).
T×B is an interaction between ‘Time (T)’ and ‘Breed (B)’.
The values are expressed as least square means (Lsmeans) and SEM.
a Within rows, Lsmeans differ from pre-weaning baseline by P<0.05. Pre-weaning baseline is day −14 (1 day before gradual weaning was initiated).
*P<0.05, **P<0.01, ***P<0.001, NS=not significant (P>0.05).
Three reference genes, β-actin, glyceraldehyde-3-phosphate dehydrogenase and tyrosine 3-monooxygenase/tryptophan 5-monooxygenase activation protein, zeta polypeptide, found by Spalenza et al. (Reference Spalenza, Girolami, Bevilacqua, Riondato, Rasero, Nebbia, Sacchi and Martin2011) to have stable expression in bovine circulating lymphocytes were used in this study. Using geNorm in the GenEx Software v.5.2.7.44 (2010), an average stability M value of 0.21 was calculated for these genes based on average pairwise variations. The geometric mean of the reference genes was used to calculate a normalisation factor and this was subsequently used to normalise expression of each gene of interest.
Real-time qPCR was used to measure gene expression of the reference genes and the pro-inflammatory cytokine (CXCL8), the glucocorticoid receptor (GRα), the pro-apoptotic gene (Fas), toll-like receptor 4 (TLR4) and tumour necrosis factor (TNF)α, according to MIQE guidelines (Bustin et al., Reference Bustin, Benes, Garson, Hellemans, Huggett, Kubista, Mueller, Nolan, Pfaffl and Shipley2009). Each reaction was performed in triplicate and consisted of 2 µl of the optimal (determined when calculating efficiencies using serial dilutions) concentration of cDNA and 18 µl of master mix (10 µl Fast SYBR Green 1 master mix (Applied Biosystems), 7 µl nuclease-free water and 0.5 µl each of forward and reverse primers at individually optimised concentrations). Applied Biosystems 7500 FAST RT-PCR equipment v2.0.1 was used (Applied Biosystems). The conditions applied were as follows; 95°C for 20 s followed by 40 cycles of 95°C for 3 s and 60°C for 30 s, finishing with amplicon dissociation at 95°C for 15 s, 60°C for 1 min increasing 1°C/cycle until 95°C was reached for 15 s followed by 60°C for 15 s.
The Cq values were imported into GenEx Software v.5.2.7.44 (2010) (MultiD Analyses AB, Göteborg, Sweden). A modified Grubbs test, with α set at P<0.05 confidence interval, was used to remove outliers from replicate wells that differed from the replicate mean by a SD of >0.25 cycles. Adjustments were performed to account for inter-plate variation using the inter-plate calibrator sample included on all plates. The Cq values were adjusted for amplification efficiencies and replicates were averaged. The resulting values were normalised to the reference genes and relative quantities were calculated to the highest Cq value.
Statistical analysis
All data were examined for adherence to a normal distribution (PROC UNIVARIARTE, SAS v 9.3). Neutrophil number and haptoglobin concentration were not normally distributed and were transformed by raising the variable, as appropriate, to the power of λ. The required λ value was calculated by conducting a Box-Cox transformation analysis using the TRANSREG procedure of SAS. Relative gene expression values were all log2 transformed before statistical analysis. Data subjected to transformations were used for P-values. However, the corresponding non-transformed least squares means (Lsmeans) and SEM are presented to facilitate interpretation of results.
Average daily gain data were analysed using mixed models ANOVA (PROC MIXED, SAS v 9.3) with breed, plane of nutrition and their interactions included as fixed effects. Animal was the experimental unit in all analyses.
Haematological data and plasma haptoglobin concentration were analysed in accordance with the factorial nature of the design using repeated measures mixed models ANOVA (PROC MIXED, SAS v 9.3) with breed, plane of nutrition, sampling time and their interactions included as fixed effects. Age at treatment allocation and serum ZST units at arrival on site were included as covariates.
Relative gene expression data were analysed using repeated measures mixed models ANOVA (PROC MIXED, SAS v 9.3) with breed, sampling time and their interaction included as fixed effects. For repeated measures analyses, sampling time was included as the repeated measure. The covariance matrix was determined for each variable by examining the Sawa’s Bayesian Information Criteria value. Animal was included in each model as a random effect. Non-statistically significant interactions and covariates were sequentially removed from the models. Differences between the means were tested using the PDIFF option within the MIXED procedure of SAS. Where the effect of plane of nutrition (three levels) was examined, a Tukey post hoc analysis was employed. Means were considered statistically significantly different at a probability level of P<0.05. Values are expressed as Lsmeans (SEM).
Results
Growth performance
Feed intake and growth performance data will be published separately but in the interests of clarity and context, growth performance data are summarised here. There was no breed×plane of nutrition interactions for average daily gain (P>0.05). Average daily gain was affected by breed both pre- and post-weaning (P<0.01) with H-F having greater gains than J. Plane of nutrition affected average daily gain both pre-weaning (P<0.05) and post-weaning (P<0.01). Pre-weaning average daily gain (Lsmeans (SEM) for H-F on H, M and L planes of nutrition were 0.74 (0.04), 0.66 (0.04), 0.66 (0.03) kg, respectively; while J on H, M and L planes of nutrition achieved pre-weaning average daily gains of 0.68 (0.04), 0.59 (0.05) and 0.53 (0.05) kg, respectively. Post-weaning average daily gains were 1.11 (0.07), 0.87 (0.07) and 0.86 (0.07) kg for H-F on the H, M and L planes of nutrition, respectively, and J calves on the H, M and L planes of nutrition gained 0.84 (0.08), 0.62 (0.09) and 0.57 (0.1) kg/day, respectively.
Maternally derived passive immunity
The ZST test performed on serum collected on arrival of the calves, showed J calves had greater maternally derived passive immunity (19.5 (0.52) units) than H-F calves (16.7 (0.42) units) (P<0.0001).
Haematological profiles
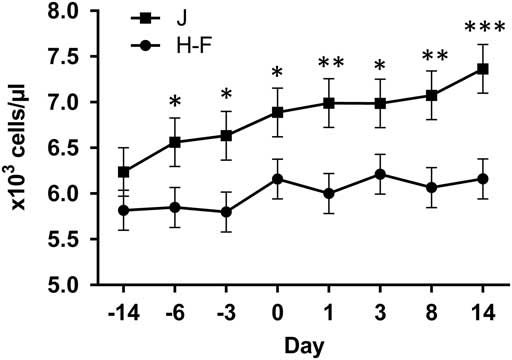
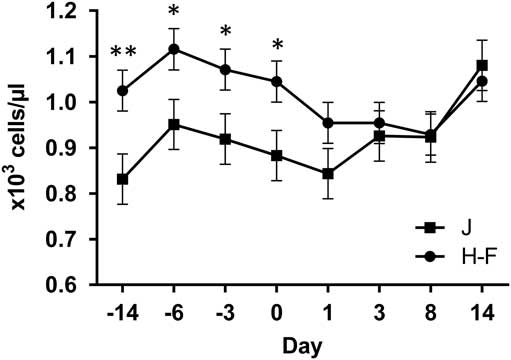
There were no breed×plane of nutrition×sampling time interactions or plane of nutrition×sampling time interactions observed for the distribution of haematological variables (P>0.05). However, breed×sampling time interactions were detected for lymphocyte (P<0.01) and monocyte profiles (P<0.05) (Table 2). Lymphocyte number did not differ between breeds initially but following the onset of gradual weaning J calves had a greater number of lymphocytes throughout both the weaning and post-weaning periods (Figure 1). The H-F and J monocyte profiles differed at d −14 and throughout the weaning period with H-F having ~19% greater monocytes. However, monocyte number converged between the breeds from d 1 post-weaning (Figure 2).
Effect of gradual weaning on lymphocyte number in H-F and J calves. Initially there was no difference between breeds, but following the onset of gradual weaning, J calves had greater lymphocyte numbers. *P<0.05, **P<0.01, ***P<0.001. H-F=Holstein-Friesian; J=Jersey.

Effect of gradual weaning on monocyte number in H-F and J calves. H-F had a greater monocyte number initially and during the weaning period but monocyte number converged between the breeds post-weaning. *P<0.05, **P<0.01. H-F=Holstein-Friesian; J=Jersey.

A breed effect was observed for neutrophil number (P<0.05) with H-F having a greater number of neutrophils (Table 2). There was a sampling time effect in all treatments (P<0.0001) with neutrophil number increased on both d 3 and d 14 post-weaning, from the initial d −14 baseline value. Sampling time effects for all treatments were also evident in white blood cell (WBC) number (P<0.0001) and in basophil number (P<0.0001) (Table 2). The WBC number was elevated relative to baseline number at each sampling time-point during the weaning and post-weaning periods except at d −3. Basophil number increased from baseline level at d −3 relative to weaning and remained elevated throughout both the weaning and post-weaning periods. Plane of nutrition did not affect leukocyte profiles (P>0.05) (Table 2).
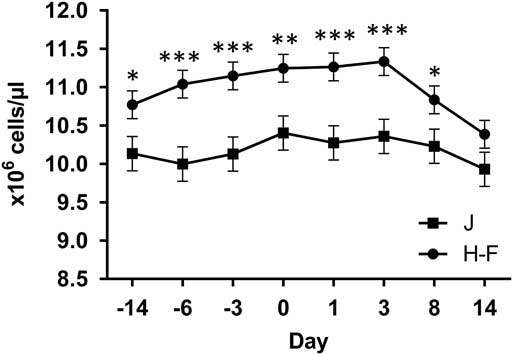
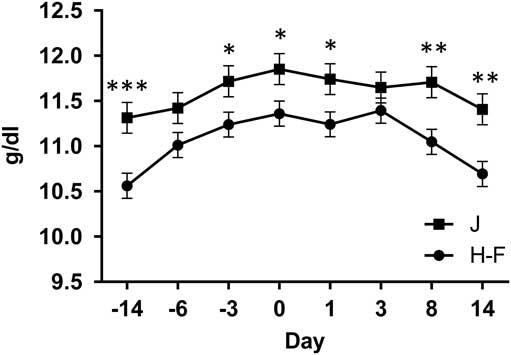
There were no breed×plane of nutrition×sampling time interactions or plane of nutrition×sampling time interactions for red blood cell (RBC) number, haematocrit (HCT) percentage, plasma haemoglobin (HGB) concentration or platelet number (P>0.05). Breed×sampling time interactions were detected for RBC number and HGB percentage (P<0.05) (Table 3). The RBC numbers were greater in H-F compared with J calves up to d 8, but there was no difference between breeds at d 14 (Figure 3). Plasma HGB concentration was greater in J than H-F calves except at d −6 in the weaning period, and at d 3 post-weaning (P>0.05) (Figure 4).
Effect of gradual weaning on RBC number in H-F and J calves. H-F calves had a greater RBC number up until day 8 post-weaning. At 14 days post-weaning, there was no difference between breeds. *P<0.05, **P<0.01, ***P<0.001. RBC=red blood cell; H-F=Holstein-Friesian; J=Jersey.

Effect of gradual weaning on plasma haemoglobin concentration in H-F and J calves. Plasma HGB concentrations were greater in J calves except at days −6 and 3 where there were no differences between breeds. *P<0.05, **P<0.01, ***P<0.001. HGB=haemoglobin; H-F=Holstein-Friesian; J=Jersey.

Effect of breed and plane of nutrition on RBC number, HCT percentage, plasma HGB concentration and platelet number, during gradual weaning in H-F and J calves

H-F=Holstein-Friesian; J=Jersey; RBC=red blood cell (×106 cells/µl); HCT=haematocrit (%); HGB=haemoglobin (g/dl); Platelets=platelets (×103 cells/µl); H=high plane of nutrition; M=medium plane of nutrition; L=low plane of nutrition; B = effect of breed.
Time (T) represents day number relative to weaning (day 0).
T×B is an interaction between ‘Time (T)’ and ‘Breed (B)’.
The values are expressed as least square means (Lsmeans) and SEM.
a Within rows, Lsmeans differ from pre-weaning baseline by P<0.05. Pre-weaning baseline is day −14 (1 day before gradual weaning was initiated).
*P<0.05, **P<0.01, ***P<0.001, NS=not significant (P>0.05).
The HCT percentage was greater in J compared with H-F calves (P<0.05) (Table 3). Sampling time affected both HCT percentage (P<0001) and platelet number (P<0.01) in all treatments (Table 3). HCT percentage in all treatments increased during the pre-weaning period and was different (P<0.01) from baseline levels at d −3. The HCT percentage remained elevated compared with baseline until 3 days post-weaning and it subsequently decreased after this time-point. The platelet number in all treatments was increased from baseline values at d 14 during the post-weaning period. Plane of nutrition did not affect RBC number, HCT percentage, plasma HGB concentration or platelet number (P>0.05) (Table 3).
Acute phase protein concentration
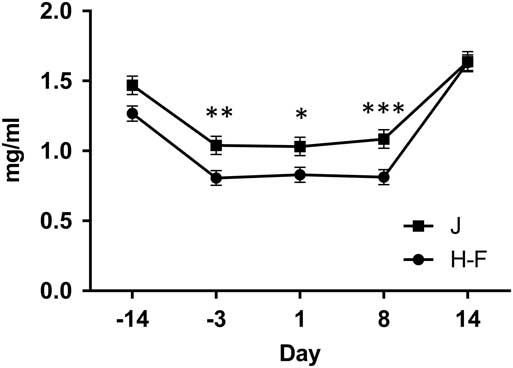
There was a breed×sampling time interaction for the acute phase protein, haptoglobin (P<0.05). Plasma haptoglobin concentrations were not different at baseline and were greater in J than in H-F calves during the weaning period. After weaning the plasma haptoglobin concentration remained greater in J calves up until 8 days post-weaning (Figure 5). There was no effect of plane of nutrition on plasma haptoglobin concentration (P>0.05) (Figure 5).
Differences in plasma haptoglobin concentrations in H-F and J calves during the gradual weaning and post-weaning period. Plasma haptoglobin concentrations were not different at baseline. J calves had greater plasma haptoglobin concentrations throughout the weaning period and up until d 8 post-weaning. At 14 days post-weaning, the breed difference was no longer evident. *P<0.05, **P<0.01, ***P<0.001. H-F = Holstein-Friesian; J = Jersey.

Whole blood gene expression
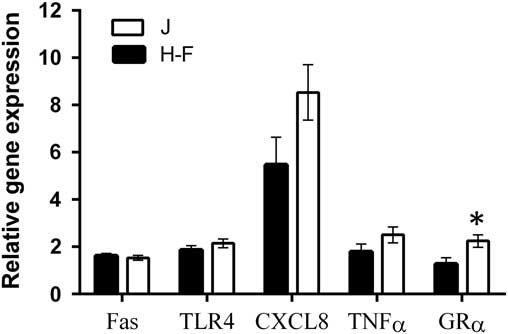
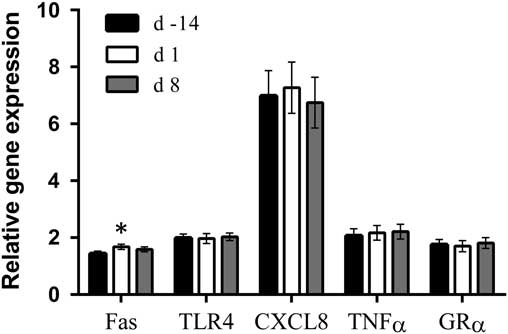
There was no breed×sampling time interaction observed for any of the immunological genes examined (P>0.05). Relative gene expression levels tended to be greater, and were greater, in J calves compared with H-F for the pro-inflammatory cytokine CXCL8 (J; 8.53 v. H-F; 5.47 (1.17)) (P=0.05) and the glucocorticoid receptor GRα (J; 2.24 v. H-F; 1.27 (0.26)) (P=0.01), respectively (Figure 6). Gene expression differences (P>0.05) were not observed between the two breeds for Fas, TLR4 and TNFα. An effect of time was observed for Fas (P<0.05) with increased relative gene expression between d −14 (1.44 (0.09)) and d 1 (1.68 (0.09)) (Figure 7). There were no changes (P>0.05) over time in the expression levels of TNFα, TLR4, CXCL8 and GRα (Figures 6 and 7).
Effect of breed on immunological gene expression levels. Relative gene expression levels of both CXCL8 (P=0.05) and GRα (P<0.05) were greater in J calves. *P<0.05.

Effect of gradual weaning on immunological gene expression levels. The relative gene expression of Fas increased on day 1 from the baseline level at day −14. *P<0.05.

Discussion
The present study characterised the haematological profiles, acute phase protein response and whole blood gene expression of H-F and J bull calves offered three different planes of nutrition, within breed, during the gradual weaning and immediate post-weaning periods. In addition, we investigated the effect of plane of nutrition, within breed, on haematological profiles and plasma haptoglobin concentration. There have been limited studies on haematological profiles in dairy calves in response to gradual weaning. This paper provides an in depth description of haematological profiles in two different dairy breeds in response to gradual weaning. To the authors’ knowledge, this is the first study to examine the whole blood relative gene expression levels in H-F and J calves in response to gradual weaning.
The level of passively derived maternal immunity as measured by the ZST test (proxy for immunoglobulin status; Earley et al., Reference Earley, McGee, Fallon, Drennan, Murray and Farrell2000) differed between the two breeds. This is not surprising and consistent with the results of Villarroel et al. (Reference Villarroel, Miller, Johnson, Noyes and Ward2013), who reported significant breed differences in serum immunoglobulin G (IgG) concentrations between these breeds, with J calves having higher concentrations than H-F. In addition, colostrum from J cows contains greater total immunoglobulins and tends to have higher concentrations of IgG, IgM and IgA, compared with H-F cows (Muller and Ellinger, Reference Muller and Ellinger1981). It is possible, that the differential passive immunity status of the two breeds of calves may have influenced their immune response. Serum IgG concentrations are greatest at 2 to 3 days of age and begin to gradually decline in both breeds up to ~2 weeks of age where the serum IgG concentrations typically remain higher in J calves (Villarroel et al., Reference Villarroel, Miller, Johnson, Noyes and Ward2013). Therefore, both breeds in the present study were at an age where the immunoglobulin concentrations cease declining. Consequently, it was possible to compare immunoglobulin status between breeds despite the J calves being on average 2 weeks older than the H-F calves at the day of their arrival at the research centre when blood samples were obtained.
Weaning is typically a stressful event for suckled beef calves and this has previously been demonstrated by our group through the characterisation of haematological profiles of abruptly weaned suckled calves and manifested as an increase in neutrophil number, known as neutrophilia, and a decrease in lymphocyte number (lymphopaenia) (Hickey et al., Reference Hickey, Drennan and Earley2003; Lynch et al., Reference Lynch, Earley, McGee and Doyle2010; O’Loughlin et al., Reference O’Loughlin, McGee, Doyle and Earley2011). However, suckled calves undergo additional psychological stresses around weaning, which the artificially reared dairy calves in the present study were not subjected to, for example, breaking of the maternal bond and social grouping rearrangement. As dairy calves are generally separated from the dam shortly after birth, weaning solely involves the complete removal of milk from the diet. The amount of MR offered pre-weaning may influence the level of stress experienced by the artificially reared dairy calf during weaning. Calves accustomed to a high plane of nutrition may find it more difficult to adjust to a concentrate-based diet. We have shown in the present study that gradual weaning affects haematological indicators of immune function, the acute phase protein response and relative gene expression levels in artificially reared dairy calves. However, the typical neutrophilia and lymphopaenia responses associated with stress were not observed in calves on the H, M or L plane of nutrition in the present study. Kim et al. (Reference Kim, Yang, Upadhaya, Lee, Yun and Ha2011) observed a decrease in lymphocyte number and a corresponding increase in the neutrophil : lymphocyte (N : L) ratio after gradual weaning in dairy calves. However, the gradual weaning strategy used by Kim et al. (Reference Kim, Yang, Upadhaya, Lee, Yun and Ha2011) differed to the one used in the present study. Kim et al. (Reference Kim, Yang, Upadhaya, Lee, Yun and Ha2011) practiced early weaning by gradually reducing the whole milk offered from 20% to 10% of calf BW when calves were 29 to 30 days of age and completely removing milk when calves were 42 days of age. We, on the other hand, gradually reduced the MR offered to either 2 or 1.5 l, depending on nutrition treatment, over a 14-day period, and ensured the calves were consuming at least 1 kg of concentrate for 3 consecutive days before complete removal of MR from their diets. The weaning strategy in the present study may have been less stressful for the calves as they had ample time to adapt to both low levels of liquid feed and the consumption of sufficient concentrate before the cessation of milk feeding, and furthermore, they were on average, 41 days older at weaning, than the calves in the study of Kim et al. (Reference Kim, Yang, Upadhaya, Lee, Yun and Ha2011).
The observed changes in haematological profiles in the present study suggest a differential biological response to gradual weaning between H-F and J calves. Weaning differentially affected monocyte profiles by causing an increase post-weaning in J calves which brought their monocyte number in line with that of H-F. This suggests a larger stress response in the J breed as their monocyte number rose disproportionately after weaning. Similarly, in support of this assertion, lymphocyte number also increased more rapidly in J calves throughout both the weaning and post-weaning periods. Interestingly, although, the RBC number was greater in H-F calves at all but one time-point, J calves had higher plasma HGB concentrations. However, the plasma HGB concentrations within both breeds were within normal reference ranges (Jones and Allison, Reference Jones and Allison2007).
Calves that are free to suckle their dam ingest greater volumes of milk than is typically fed under artificial rearing conditions (Lorenz et al., Reference Lorenz, Mee, Earley and More2011). This aberrantly restricted quantity of MR frequently fed to dairy calves in an artificial rearing system may have negative health implications. Alternatively, feeding high levels of MR increases average daily gain but can reduce concentrate consumption (Jasper and Weary, Reference Jasper and Weary2002; Terré et al., Reference Terré, Devant and Bach2007) and this can cause lower nutrient digestibility (Terré et al., Reference Terré, Devant and Bach2007) and weight loss (Budzynska and Weary, Reference Budzynska and Weary2008) at weaning, and consequently, may disrupt immune function. However, in our study, while the distribution of haematological variables was affected by breed, no changes were elicited due to plane of nutrition. Therefore, similar to previous observations based on feeding different levels of MR (Borderas et al., Reference Borderas, de Passillé and Rushen2009; Bach et al., Reference Bach, Terré and Pinto2013; Conneely et al., Reference Conneely, Berry, Murphy, Lorenz, Doherty and Kennedy2014), the plane of nutrition offered to these dairy calves did not affect indices of their health or immune function.
The acute phase protein, haptoglobin, was considered to be a useful measure of inflammatory and stress responses in cattle (Murata et al., Reference Murata, Shimada and Yoshioka2004). Haptoglobin concentration did not increase, but did decrease, after the initiation of gradual weaning in this study. However, recently, variations in haptoglobin concentrations following weaning have been considered to be inconsistent and unreliable indicators of a stress response (O’Loughlin et al., Reference Obeidat, Cobb, Sellers, Pepper-Yowell, Earleywine and Ballou2014). Similar to that observed by Obeidat et al. (Reference O’Loughlin, McGee, Waters, Doyle and Earley2013), we observed a differential acute phase protein response between the two breeds employed and plane of nutrition had no effect on the acute phase response. This is in contrast to the findings of Ballou (Reference Ballou, Cobb, Earleywine and Obeidat2012) where calves fed a higher plane of MR nutrition had greater plasma haptoglobin concentrations following a lipopolysaccharide challenge than calves fed a lower plane of MR nutrition containing reduced DM and CP. However, such a physiological challenge may have been more stressful and elicited a greater inflammatory response than the necessary management process of gradual weaning practiced here.
Changes in haematological profiles and in acute phase protein response were observed at the cellular level and protein level, respectively, between breeds during gradual weaning, therefore molecular level variation in gene expression within the blood was investigated. Blood cellular mRNA transcriptional changes have not been characterised previously in dairy calves undergoing gradual weaning. An advantage of using whole blood rather than an individual cell type to examine alterations in mRNA transcription was that the blood was lysed immediately at the time of collection into Tempus RNA tubes and the mRNA expression preserved favouring accurate unbiased gene expression profiling. In the present study, we found that relative gene expression levels for several selected biomarkers of immunological competence were influenced by either weaning or breed. An immune response to gradual weaning was observed in H-F and J calves in the form of a change, over time, in the expression pattern of Fas. This cell surface receptor protein promotes apoptosis and phagocytic activity of macrophages in an effort to restore homoeostasis (Oura et al., Reference Oura, Arakaki, Yamada, Kudo, Tanaka, Hayashi and Ishimaru2013). Therefore, the increase in Fas mRNA transcripts may indicate a disruption of immune activity following weaning. However, expression of the most reliable molecular biomarker of stress in weaned (suckled) beef calves, CXCL8 (O’Loughlin et al., Reference Obeidat, Cobb, Sellers, Pepper-Yowell, Earleywine and Ballou2014), was not altered over the study period employed here. This result is consistent with the lack of difference in haematological profiles and suggests that gradual weaning does not exert a pronounced inflammatory stress response.
Differences observed here between the two breeds in the relative expression of genes which initiate innate inflammatory responses suggest that the innate immune system of J calves is constantly more stimulated, demonstrated by increased levels of the pro-inflammatory cytokine, CXCL8, and of the glucocorticoid receptor, GRα. Cortisol is the classic endocrine hormone secreted in response to stress (Sapolsky et al., Reference Sapolsky, Romero and Munck2000) and is the natural ligand for GRα, which is present on almost all cell types (Koper et al., Reference Koper, Van Rossum and Van Den Akker2014). CXCL8 is a pro-inflammatory chemokine secreted by monocytes, neutrophils, natural killer cells, T lymphocytes and endothelium cells (Hoffmann et al., Reference Hoffmann, Dittrich-Breiholz, Holtmann and Kracht2002). It is involved in neutrophil chemotaxis, angiogenesis and wound repair (Viola and Luster, Reference Viola and Luster2008). Therefore, greater levels of expression of these genes may reflect persistent stress and stimulation of the immune system in J calves.
In the current study, H-F and J calves were, by necessity, sourced from different herds. This resulted in a difference in mean age at recruitment between the two breeds. However, as we included both age at allocation to treatment and serum ZST at arrival on site as covariates in the statistical models, and both were found to be statistically non-significant, we do not feel that the initial variation between the breeds at the start of the experiment had any confounding effect on the interpretation of our results.
Conclusions
The lack of a pro-inflammatory response as a consequence of gradual weaning of artificially reared dairy calves in this study suggests that this management practice is animal welfare friendly. Gradual weaning resulted in differential biological responses between the two breeds, and was evidenced by breed×time interactions for lymphocytes, monocytes, RBC numbers and plasma HGB and haptoglobin concentrations. The more pronounced increase in lymphocyte number throughout weaning and during the post-weaning phase, coupled with the disproportionate elevation in monocyte number post-weaning and the greater abundance of transcripts for CXCL8 and GRα suggests that J calves may have a more sensitive immune system than H-F calves. Plane of nutrition had no effect on the haematological profiles of these artificially reared dairy calves under the gradual weaning regimen employed.
The present study examined haematological and molecular biomarkers of immune competence in clinically healthy H-F and J artificially reared dairy calves undergoing gradual weaning. Therefore, future research is warranted to further elucidate the specific differences within the immune systems of these two breeds, through observing immunological responses to an experimental challenge infection. Knowledge of breed-specific immune responses could enable improved health management practices that could be better tailored towards the specific disease sensitivities of particular breeds of interest enabling the development of cost effective breed targeted prophylactic and therapeutic veterinary interventions.
Acknowledgements
The authors gratefully acknowledge: the farm staff at Teagasc, Grange, for their care and management of the animals and Grange laboratory technical staff, Joe Larkin and Margaret Murray for blood analysis; funding, provided by the Department of Agriculture and Food Stimulus Fund 11/S/16 and EU PLF project 311825. Dayle Johnston was in receipt of a Teagasc Walsh Fellowship funded scholarship (WF2013216).
Supplementary Material
For supplementary material/s referred to in this article, please visit http://dx.doi.org/10.1017/S1751731115002438