1 Introduction
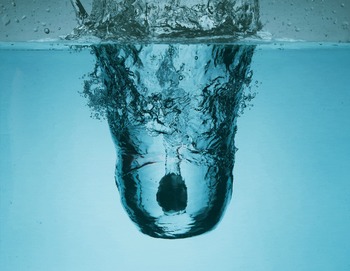
Free surface impact has been investigated for over a century (Worthington & Cole Reference Worthington and Cole1900) with most studies examining solid or liquid impact on a quiescent pool. In this study, we examine the phenomenon of a solid body descending through a transient air cavity that is formed by a liquid jet and entering the water at its base, as shown in figure 1. The impact of the liquid jet greatly alters the flow field into which the sphere enters, which in turn dramatically changes the forces on the sphere during entry. These forces can cause both local damage, where the tip makes initial contact and structural damage to the object. In this paper, we examine these forces and find that the very initial impact force can be greatly reduced when the sphere enters the pool at the bottom of a jet cavity.
A 25 mm radius sphere enters the pool at the bottom of an air cavity formed by the impact of a jet of water on a quiescent pool. The sphere is surrounded by a jet of water. Above the sphere the diameter of the jet has narrowed to be smaller than the sphere diameter. Below the sphere the jet widens as it spreads on the bottom surface of the cavity.

Prior research on solid impact on a free surface informs our study on the impact forces. One of the first to study the forces during free surface impact was Thompson (Reference Thompson1928), who experimentally investigated the maximum pressure on sea plane floats during landing. Von Karman (Reference Von Karman1929) followed up this study by developing a formula to apply Thompson’s experimental results to different shaped floats and impact velocities and was one of the first to model the impact force using added or virtual mass. Shiffman & Spencer (Reference Shiffman and Spencer1945) studied the impact of spheres on water up to a submergence depth of one radius and mathematically predicted the drag coefficient as a function of submergence depth using the potential flow field to calculate the added mass. They found that the maximum drag coefficient occurs when the sphere is submerged between ten and twenty per cent of its radius and Moghisi & Squire (Reference Moghisi and Squire1981) experimentally validated their results. Others have shown similar trends for other geometries, with added mass being a dominant source of large peak forces for small body submergence (May Reference May1975; Grady Reference Grady1979). In addition to the force from added mass, when the sphere initially touches the water surface it experiences a large hydraulic impact pressure know as water hammer (Cook Reference Cook1928; Korobkin & Pukhnachov Reference Korobkin and Pukhnachov1988). During the initial contact a thin film of air becomes entrapped between the tip of the sphere and the pool, which is said to cushion the impact event (Marston, Vakarelski & Thoroddsen Reference Marston, Vakarelski and Thoroddsen2011; Hicks et al. Reference Hicks, Ermanyuk, Gavrilov and Purvis2012; Hicks & Purvis Reference Hicks and Purvis2013). At approximately the same time Thoroddsen et al. (Reference Thoroddsen, Etoh, Takehara and Takano2004) showed that a high-speed radial jet forms which can greatly increase the initial impact force on the sphere. Further theoretical developments on modelling the very initial impact force have been reviewed by Korobkin & Pukhnachov (Reference Korobkin and Pukhnachov1988), with Miloh (Reference Miloh1991) and Faltinsen & Zhao (Reference Faltinsen and Zhao1997) making significant contributions since. Additional work on the initial impact force was performed by Bodily, Carlson & Truscott (Reference Bodily, Carlson and Truscott2014) who studied the water entry of slender axisymmetric bodies, showing that the impact force is a function of nose geometry.
The forces experienced after the very initial stages of impact depend on whether the sphere pulls air under the surface with it or enters without air entrainment (Truscott, Epps & Techet Reference Truscott, Epps and Techet2012). In cases where cavities form (i.e. air entrains), the water is repelled away from the sphere near its equator. If the splash crown travels up the sides of the sphere and meets itself at the apex then cavity formation is prevented. While cavity formation can be suppressed at low velocity if the static contact angle is less than
 $90^{\circ }$
(Duez et al.
Reference Duez, Ybert, Clanet and Bocquet2007) and the sphere is smooth (Zhao, Chen & Wang Reference Zhao, Chen and Wang2014), cavities always form with sufficiently large sphere impact velocity (
 $U_{o}\gtrsim 7.3~\text{m}~\text{s}^{-1}$
in water) which decreases as the contact angle or roughness increase. Once a cavity forms, the balance between the inertial, gravitational and surface tension forces, described by the Bond, Weber and Froude numbers (defined below), dictate its dynamics and cause it to take on one of four shapes or regimes (Aristoff & Bush Reference Aristoff and Bush2009). The two applicable cavity regimes for this study are the deep seal regime, in which hydrostatic pressure forces the cavity to close approximately halfway between the sphere and water surface, and the surface seal regime in which the splash collapses inwards sealing off further air flow into the cavity (Aristoff & Bush Reference Aristoff and Bush2009). In the current study, cavities always form when impacting a quiescent pool due to the high surface roughness of the sphere and both deep and surface seals are seen.
Other studies have focused on the forces experienced after the initial impact. May & Woodhull (Reference May and Woodhull1948) found the average drag coefficient of steel spheres during the entrance cavity phase, while Shepard et al. (Reference Shepard, Abraham, Schwalbach, Kane, Siglin and Harrington2014) studied the effect of sphere density on the drag coefficient for the same time phase. Truscott et al. (Reference Truscott, Epps and Techet2012) showed that the forces during these later stages of impact are very unsteady and depend on whether the sphere forms a cavity. In non-cavity forming cases vortices shed in the wake of the sphere causing large impulses in the sphere acceleration. When cavities form the pinch-off creates a trailing air bubble on the sphere that suppresses large vortex shedding but induces oscillations in the sphere acceleration due to pressure perturbations in the bubble (Bodily et al. Reference Bodily, Carlson and Truscott2014; Mansoor et al. Reference Mansoor, Marston, Vakarelski and Thoroddsen2014). Other studies on water impact include: Glasheen & McMahon (Reference Glasheen and McMahon1996) who studied the impact forces of circular disks to understand how basilisk lizards and shore birds run along the water surface, Baldwin (Reference Baldwin1971) who studied cones and Tveitnes, Fairlie-Clarke & Varyani (Reference Tveitnes, Fairlie-Clarke and Varyani2008) who studied wedges.
In this study we focus on a method for reducing the initial, impulsive impact force experienced by a sphere during water impact. As described above, the body of literature shows that this early time force, occurring before the sphere is fully submerged, is largely caused by the sphere having to accelerate the surrounding water; i.e. added mass. Here we suggest that the impact force can be reduced by accelerating a volume of water just below the free surface prior to sphere impact. To test this experimentally, we allow a jet of water to strike the surface prior to sphere entry. On-board measurements of acceleration using custom inertial measurement units (IMUs) confirm that the large initial impact force is reduced, and that the subsequent forces and cavity dynamics throughout entry are also altered (i.e. water hammer, radial jetting, cavity oscillations, vortex shedding). We investigate this effect over a range of impact velocities and water jet lengths and place our findings in the context of prior work on rigid sphere impact on a quiescent pool.
2 Experimental set-up and description
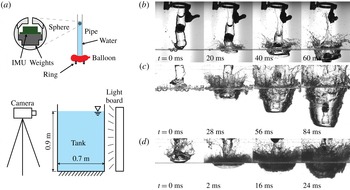
Figure 2(a) shows the set-up used for this study. A polycarbonate pipe of inner diameter 51 mm is held above a tank of water and the bottom opening of the pipe is sealed by squeezing an inflated party balloon between the pipe and metal ring. The pipe is filled with water to the desired height and then a 50 mm diameter sphere is placed at the top of the water in the pipe. The sphere is permitted to sink slowly in the water column for approximately 1 to 2 s to dampen out rotations and to control the length of jet in front of the sphere
 $L_{j}$
, which is maintained between 6 and 55 cm for all cases except for the critical jet length experiments discussed further at the end of § 3. When the balloon is popped it quickly moves out of the way and the water and sphere fall towards the pool surface as seen in figure 2(b). The drop height can be changed to adjust the impact velocity of the sphere and jet. As the drop height increases the jet becomes more distorted from a cylindrical shape, forming a blunt leading edge and thin water films and often becomes a little more narrow just above and below the sphere as shown in figure 2(c,d). The main body of the jet is trailed by a thin tubular film which collapses forming a smaller diameter jet, seen in figure 2(b) and discussed more by Speirs et al. (Reference Speirs, Mansoor, Belden, Hurd, Pan and Truscott2018a
). As the jet impacts the pool it spreads on the surface and forms an air cavity into which the sphere falls. The sphere enters the pool at the bottom of the cavity and the impact event is viewed at 1000 f.p.s. with a high-speed camera imaging below the pool surface with diffuse back lighting. In some cases a second synchronized camera views the jet and sphere above the pool surface. The same sphere is also dropped without a jet and impacts a quiescent pool for comparison. Measurements are taken from these videos to find the sphere impact velocity, cavity velocity and the length of jet in front of the sphere. The length of jet behind the sphere varied due to the experimental method, but no effect on the impact acceleration was seen with changes in its length.
A schematic of the experimental set-up is shown in (a) with a zoomed in view of the IMU nestled in the interior of the sphere. (b) When the balloon pops the jet and sphere fall towards the pool and the jet forms a cavity into which the sphere falls. In this case the jet falls 30 cm with minimal distortion of its shape before impact. In the upper part of the images the ring and popped balloon can be seen. (c) A jet falls 160 cm before impacting the pool surface, which has been disturbed by droplet impacts. As the jet falls air drag distorts the leading edge (
 $t=0$
ms) and the diameter of the jet just in front of the sphere narrows before the sphere reaches the bottom of the jet cavity as shown at
 $t=84$
ms. (d) When the jet falls 390 cm before impacting the pool it becomes very distorted by the time of impact (
 $t=0$
ms). The jet just above and below the sphere has thinned during the fall time as shown at
 $t=16{-}24$
ms (at
 $t=24$
ms the sphere is just descending below the height of the splash crown).

The sphere consists of an outer shell, weights, and an inertial measurement unit (IMU), as shown in figure 2(a). The outer shell of the sphere is 3D printed in two parts using Vero plastic. This provides a hydrophilic surface with wetting angle
 $\unicode[STIX]{x1D703}=80\pm 8^{\circ }$
and surface roughness
 $R_{z}=7.2\pm 1.2~\unicode[STIX]{x03BC}\text{m}$
at 95 % confidence. The steel weights are placed in the lower half of the sphere with the IMU firmly attached to them. This helps the sphere to fall in line with its vertical axis and to minimize the sphere rotation during free fall and impact. The two pieces of the sphere are pressed together and the seam and top hole sealed with Colorimetrics’ grey putty tape to prevent water from entering. The seam between the two pieces of the sphere shell is located about three quarters of the sphere diameter from the bottom of the sphere so as to minimize its influence on the dynamics of the water impact event. The specific gravity of the sphere as a whole is
 $2.253\pm 0.007$
.
The IMU was built in house and has two three-axis accelerometers, that separately record each impact event at 1000 Hz. The low range accelerometer is a MPU-9250 motion tracking device manufactured by InvenSense Inc. and is set to a maximum range of
 $\pm 16$
g. The high range accelerometer is a H3LIS331DL manufactured by ST and is set to a maximum range of
 $\pm 100$
g. Both accelerometers have a rise time that is less than
 $1~\unicode[STIX]{x03BC}\text{s}$
. When possible the data from the low range accelerometer are used as they result in less noise, but the measurements of the two separate accelerometers are comparable. Because the sphere experiences small rotations during free fall and impact the magnitude of the total acceleration vector is computed from measurements in the three axes and is reported herein.
Using the set-up described the impact velocity at the cavity bottom or quiescent pool surface,
 $U_{o}$
, was changed from 1.83 to
 $9.34~\text{m}~\text{s}^{-1}$
by varying the drop height. The length of the jet impacting in front of the sphere,
 $L_{j}$
, varied from 0 to 55 cm. This resulted in non-dimensional parameters with the following ranges:
 $Re=\unicode[STIX]{x1D70C}U_{o}R_{s}/\unicode[STIX]{x1D707}$
between 40 000 and 200 000,
 $We=\unicode[STIX]{x1D70C}U_{o}^{2}R_{s}/\unicode[STIX]{x1D70E}$
between 1100 and 31 000 and
 $Fr=U_{o}/\sqrt{gR_{s}}$
between 3.6 and 18.9, where
 $\unicode[STIX]{x1D70C}$
is the liquid density,
 $R_{s}=25$
mm is the radius of the sphere,
 $\unicode[STIX]{x1D707}$
is the dynamic viscosity of the liquid,
 $\unicode[STIX]{x1D70E}$
is the liquid–air surface tension and
 $g$
is the acceleration due to gravity. Some limitations of the set-up are that the sphere and jet radii must be equal and that the drop height of the cases with jets could not be increased above approximately 4 m as the jet front becomes more distorted with increased falling distance.
2.1 Uncertainty
Uncertainty in all measurements is calculated and the uncertainty bands in the figures represent the 95 % confidence interval of the measurement (Coleman & Steele Reference Coleman and Steele2009). The uncertainty in calculated variables was often found to scale monotonically with the variable. Where applicable, two or more bands are placed on the extremes of the figure axes or with the data set to show how the uncertainty scales (e.g. figure 4 b). When only one band is present the mean uncertainty is shown.
3 Results and discussion
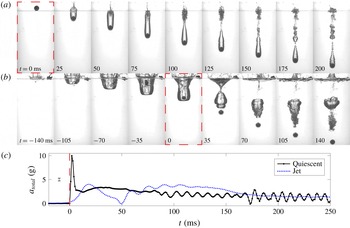
Figure 3(a) shows an image sequence of a sphere impacting a quiescent pool of water at
 $U=4.39~\text{m}~\text{s}^{-1}$
with the corresponding acceleration of the sphere shown in figure 3(c). In the very early stages of impact the sphere accelerates a portion of the surrounding water (added mass) (Shiffman & Spencer Reference Shiffman and Spencer1945), which causes a large, but short lived peak in the acceleration of the sphere (figure 3
c,
 $t=0$
to 0.01 s). A cavity then forms expanding downwards into the pool. At 25 ms after impact the splash crown domes over with no immediately noticeable influence on the sphere acceleration. At approximately 100 ms a deep seal occurs causing ripples and volume oscillations in the lower portion of the cavity which give rise to the oscillations seen in the sphere acceleration with mean amplitude of 0.45 g (Grumstrup, Keller & Belmonte Reference Grumstrup, Keller and Belmonte2007; Bodily et al.
Reference Bodily, Carlson and Truscott2014). At approximately 175 ms a bubble sheds from the lower portion of the cavity increasing the mean amplitude of the oscillations in the sphere acceleration to approximately 0.59 g.
(a) A 50 mm diameter sphere impacts a quiescent pool surface with velocity
 $U=4.39~\text{m}~\text{s}^{-1}$
forming a subsurface air cavity, that experiences surface seal, deep seal and cavity shedding at approximately 25, 100 and 175 ms respectively. (b) A 50 mm diameter water jet impacts a pool surface forming a subsurface air cavity. At
 $t=0$
, the 50 mm diameter sphere reaches the bottom of the jet cavity at velocity
 $U=4.35~\text{m}~\text{s}^{-1}$
and enters the pool without forming a cavity. (c) The total acceleration
 $a_{total}$
versus time
 $t$
is plotted for the sphere impacting a quiescent surface in (a) and for the sphere impacting inside a jet in (b). The red dashed boxes and line indicate the time the sphere impacts the free surface in (a) or starts to enter the pool in (b). See supplemental movies 1 and 2, available at https://doi.org/10.1017/jfm.2018.931.

If a sphere is placed inside a falling jet of water, the jet impacts the pool prior to sphere impact and forms an air cavity into which the sphere falls. This is shown in figure 3(b) for approximately the same impact velocity as for the quiescent impact case shown in (a). When the sphere reaches the bottom of the cavity and begins to enter the pool the acceleration of the sphere increases but not to as large a value as seen in the quiescent impact case (figure 3
c,
 $t=0$
to 50 ms). The sphere enters the pool without forming a cavity because the sphere is already immersed inside the jet. The cavity previously formed by the water jet collapses in a deep seal at 35 ms after sphere impact. The large bubble formed by the pinch-off event oscillates leading to oscillations in the sphere acceleration, which for the case shown begins with an amplitude of approximately 1.10 g and decrease exponentially toward zero as the sphere descends away from the bubble (the oscillation amplitude was found by removing the lowest frequencies with a high-pass filter so that a direct measurement of the amplitude could be taken). These oscillations are superimposed on the increase of acceleration from
 $t=50$
to 175 ms, which is caused by a vortex shed from the sphere as discussed by Truscott et al. (Reference Truscott, Epps and Techet2012).
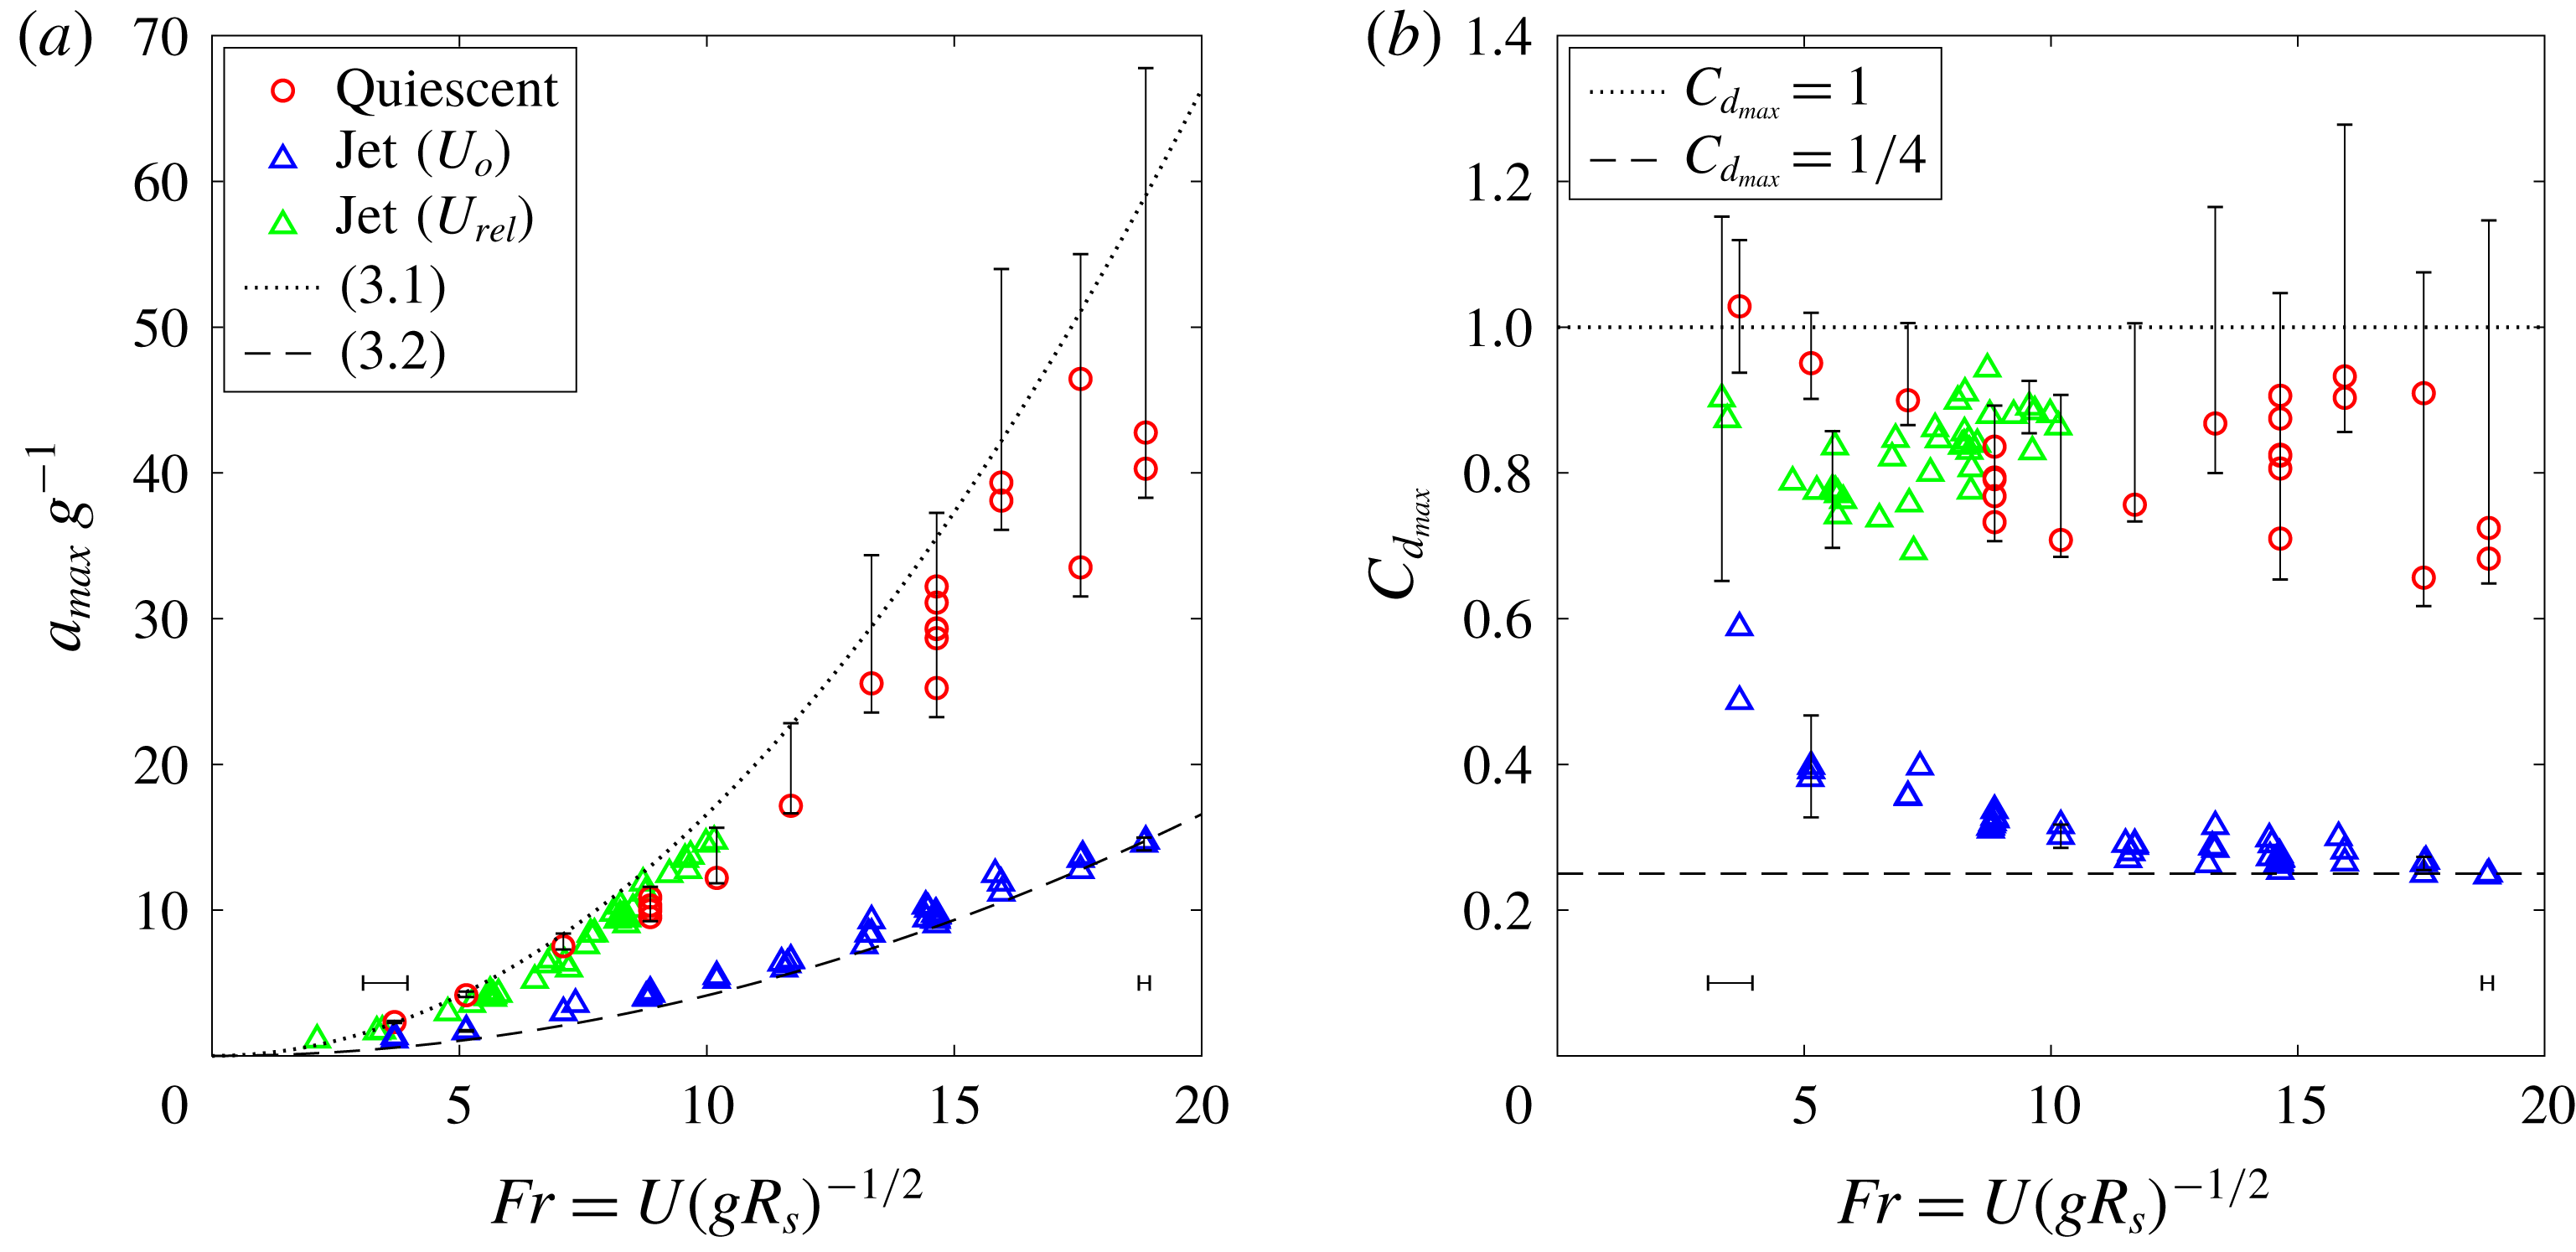
The maximum acceleration (a) and drag coefficient (b) of the initial impact peak are shown to be a function of
 $Fr$
. For all data shown in these plots the length of jet in front of the sphere
 $L_{j}$
was
 $6\lesssim L_{j}\lesssim 55$
cm. The blue and green triangles represent the same data, but
 $Fr$
and
 $C_{d}$
are calculated using the absolute velocity
 $U_{o}$
for the blue triangles and the relative velocity
 $U_{rel}$
for the green triangles.

As the jet significantly reduces the maximum impact force experienced by the sphere during the very initial stage of impact (figure 3
c
 $t=0$
–10 ms and
 $t=0$
–50 ms) we now focus on this time period and, in particular, the maximum acceleration during this early stage. The maximum measured acceleration
 $a_{max}$
is normalized by
 $g$
and plotted as a function of
 $Fr$
in figure 4(a). For the sphere impacting on a quiescent pool, the maximum acceleration increases quadratically with
 $Fr$
. We can predict this behaviour from a force balance including total drag,
 $a_{max}=(1/2)C_{d_{max}}A_{s}\unicode[STIX]{x1D70C}U_{o}^{2}/\unicode[STIX]{x1D70C}_{s}V_{s}$
where
 $C_{d_{max}}$
is the peak drag coefficient, and
 $A_{s}$
and
 $V_{s}$
are the sphere cross-sectional area and volume, respectively. Non-dimensionalizing and rearranging the above equation we obtain
 $$\begin{eqnarray}\frac{a_{max}}{g}=\frac{3}{8}\frac{\unicode[STIX]{x1D70C}}{\unicode[STIX]{x1D70C}_{s}}C_{d_{max}}Fr^{2}.\end{eqnarray}$$
Based on the work of Shiffman & Spencer (Reference Shiffman and Spencer1945) we take
 $C_{d_{max}}\approx 1$
, which is reasonable for our spheres with density ratio
 $\unicode[STIX]{x1D70C}_{s}/\unicode[STIX]{x1D70C}=2.26$
(see figure 4
b). The dotted line in figure 4(a) plots (3.1) evaluated for the experimental conditions herein and is found to be a good approximation of the peak acceleration for spheres impacting on a quiescent surface. A large amount of uncertainty is found in the maximum impact acceleration for spheres impacting on quiescent pools at high velocities. This occurs because the duration of the impact peak becomes very short and the sampling frequency of the accelerometer is limited to 1000 Hz. Hence, the maximum acceleration during this peak occurs between data points leading to the large and asymmetric uncertainty bands for the quiescent impact cases with high velocity as illustrated in figure 4. Uncertainty is estimated using the
 $C_{d}$
verse depth curve from Shiffman & Spencer (Reference Shiffman and Spencer1945) and considering the largest possible values our 1000 Hz sampling could have missed.
The spheres impacting inside a jet have lower peak accelerations for all
 $Fr$
compared to the quiescent impact cases at the same
 $U_{o}$
(figure 4
a). To rationalize these lower maximum accelerations, we note that the bottom of the jet cavity moves downwards as the sphere enters the pool, with velocity
 $U_{c}$
, which is approximately half the jet velocity
 $U_{j}$
(i.e.
 $U_{c}=U_{j}/2$
, and see Oguz, Prosperetti & Kolaini (Reference Oguz, Prosperetti and Kolaini1995), Speirs et al. (Reference Speirs, Pan, Belden and Truscott2018b
) for more details). Although the sphere does not impact the moving air–water interface,
 $U_{c}$
acts as a characteristic velocity of the water at the bottom of the jet cavity into which the sphere enters. Thus, the jet changes the relative velocity between the sphere and pool (
 $U_{rel}=U_{o}-U_{c}$
). For sufficiently large drop heights the distance that the jet falls before impact is approximately equal to the distance that the sphere falls before impact and thus,
 $U_{o}\approx U_{j}$
and
 $U_{rel}\approx U_{o}/2$
. Invoking the derivation of (3.1) using
 $U_{rel}$
, the maximum acceleration of a sphere impacting inside a jet is
 $$\begin{eqnarray}\frac{a_{max}}{g}\approx \frac{1}{4}\left(\frac{3}{8}\frac{\unicode[STIX]{x1D70C}}{\unicode[STIX]{x1D70C}_{s}}C_{d_{max}}Fr^{2}\right).\end{eqnarray}$$
Therefore, if the sphere impacts a pool of water inside a jet the impact force can theoretically be reduced by up to 75 % from the quiescent impact case (see figure 4
a). We can also examine the effect of the jet by looking at the change in the drag coefficient. Equation (3.2) can be rewritten as
 $a_{max}/g\approx (3/8)(\unicode[STIX]{x1D70C}/\unicode[STIX]{x1D70C}_{s})C_{d_{max}}^{eqv}Fr^{2}$
, where
 $C_{d_{max}}^{eqv}=C_{d_{max}}/4$
is the equivalent drag coefficient. This implies that the maximum drag coefficient when impacting inside a jet is as low as a quarter that of a sphere impacting on a quiescent pool. Figure 4(b) shows that the peak drag coefficient is significantly reduced when the sphere impacts in the wake of a jet. At low
 $Fr$
,
 $C_{d_{max}}$
is significantly larger than 0.25 because the assumption that
 $U_{j}=U_{o}$
is not met. At the lower drop heights and hence lower
 $Fr$
the jets impact at significantly lower velocities than the sphere because the sphere has much larger fall distances in both the pipe and the jet cavity before entering into the pool (i.e.
 $U_{o}>U_{j}$
). So
 $U_{c}<1/2U_{o}$
leading to larger
 $U_{rel}$
and hence larger
 $C_{d_{max}}$
. Thus, (3.2) should be thought of as the limit as the drop height becomes large or rather when
 $U_{j}=U_{o}$
. In other words, as the drop height increases (i.e.
 $U_{j}\rightarrow U_{o}$
), equation (3.2) should be thought of as the lower limit of acceleration. Another way to model the impact acceleration for the jet cases is to calculate
 $Fr$
and
 $C_{d_{max}}$
using
 $U_{rel}$
(i.e.
 $Fr=U_{rel}/(gR_{s})^{1/2}$
and
 $C_{d_{max}}=2ma_{max}/(\unicode[STIX]{x1D70C}U_{rel}^{2}A_{s})$
). Plotting the same jet cases using the measured values of
 $U_{rel}$
in figure 4 (green data) we see that the jet cases follow the same trend as the quiescent cases.
Figure 3(c) shows that not only is the maximum impact acceleration lower for the jet cases, but the peak is much wider. This extended duration is quantified here by taking the peak width at half-height
 $t_{hh}$
, which is then made non-dimensional using the sphere radius
 $R_{s}$
and the absolute impact velocity
 $U_{o}$
for the quiescent cases or the relative impact velocity
 $U_{rel}$
for the jet cases. When
 $t_{hh}U_{o}/2R_{s}$
or
 $t_{hh}U_{rel}/2R_{s}=1$
this represents the time it takes for the sphere to be fully submerged in the water. For both cases this non-dimensional time is found to be relatively constant for all impact velocities with
 $t_{hh}U_{o}/2R_{s}=0.29\pm 0.09$
for the quiescent cases and
 $t_{hh}U_{rel}/2R_{s}=1.23\pm 0.11$
for the jet cases. Hence, the peak in the sphere acceleration subsides before the sphere is fully submerged for the quiescent cases, but extends beyond the point of full submergence for the jet cases. We consider the effect of the extended peak duration on the total impulse of the sphere during this time. The magnitude of the total impulse is computed as
 $I=\int _{0}^{t_{I}}\unicode[STIX]{x1D70C}_{s}V_{s}a_{total}\,\text{d}t$
by numerically integrating the acceleration curves in figure 3(c);
 $t_{I}$
corresponds to the half-height time following the maximum acceleration. Non-dimensionalizing the impulse by the initial momentum
 $\unicode[STIX]{x1D70C}_{s}V_{s}U_{o}$
for both cases reveals relatively constant values of
 $I/\unicode[STIX]{x1D70C}_{s}V_{s}U_{o}=0.067\pm 0.003$
for the quiescent impact cases and
 $I/\unicode[STIX]{x1D70C}_{s}V_{s}U_{o}=0.175\pm 0.006$
for the jet cases. Thus, although the spheres impacting inside a jet experience much smaller maximum acceleration magnitudes, the width of the initial impact peak is much larger leading to nearly three times the total impulse magnitude and, in turn, a larger reduction in velocity over the duration of the initial acceleration peak. We note that in the quiescent impacts, the sphere experiences a significant amount of drag after the initial acceleration peak and as the cavity forms. This drag can at times be higher than the drag experienced by the sphere in the jet cases and hence if the total impulse over a set amount of time is calculated the two cases may be more comparable (see figure 3
c).
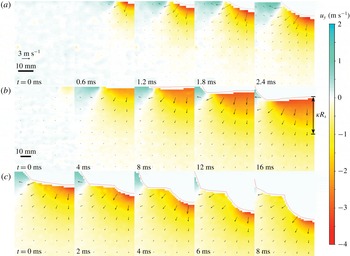
To gain a better understanding of why the presence of a jet changes both the height and width of the initial acceleration peak, we use planar particle image velocimetry (PIV) to investigate the velocity field of the water under the sphere impact, a jet impact, and a sphere preceded by a jet (figure 5). The PIV images were taken with inter-frame spacing between 0.15 and 0.5 ms and processed with four passes at
 $64\times 64$
pixel and two passes at
 $32\times 32$
pixel interrogation regions using DaVis software. In figure 5(a) we see the first moments of impact, in which the sphere accelerates the fluid directly below itself (
 $t=0.6$
ms). The velocity of the fluid directly in front of the sphere decreases from the sphere velocity to zero as the distance from the sphere increases. As the sphere descends further into the pool the mass of accelerated fluid in front of the sphere increases and the radius of the fluid mass stays approximately equal to the radius of the submerged portion of the sphere (
 $t=1.2{-}2.4$
ms). When a jet of the same radius and velocity impacts, a larger local moving pool forms (figure 5
b, note that the scaling of b differs from a). The velocity of the fluid directly in front of the jet cavity decreases from the jet velocity to zero as the distance from the cavity increases. This is the velocity field into which the sphere enters when impacting inside a jet, as shown in figure 5(c). When the sphere first impacts the cavity bottom, the fluid that it passes through first has a velocity just smaller than its own and therefore the maximum impact acceleration is less than in the quiescent case. As the sphere continues to descend, the velocity of the fluid that it passes through gradually decreases. Hence the relative velocity between the sphere and the surrounding fluid gradually increases, extending the duration of impact.
The flow fields created upon impact of a sphere, a jet and a jet followed by a sphere are shown in (a)–(c) respectively. The flow fields were measured using particle image velocimetry (PIV) and the thin red lines show the location of the masking, which covers the spheres and air cavities. The radii of the spheres and jets are 25 mm in each case. (a) A sphere impacts an initially quiescent pool at
 $4.23~\text{m}~\text{s}^{-1}$
accelerating the liquid in front of it. (b) A jet with the same velocity impacts a quiescent pool, deforms and creates a large, local downward flow. (c) A sphere at
 $4.45~\text{m}~\text{s}^{-1}$
enters the pool at the bottom of a cavity formed by a jet with the same impact conditions as in (b). Only the left half of each image is shown. The length scale bar shown in (b) applies to (c) as well. The colouring of the images shows the vertical velocity of the fluid
 $u_{y}$
with positive defined in the upward direction as shown in the colour bar on the right. The bar in (b) at
 $t=16$
ms shows the radius of the local moving pool,
 $\unicode[STIX]{x1D705}R_{s}$
, used to predict
 $L_{cr}$
. See supplemental movies 3–5.

Given that the primary source of the large initial impact force is added mass, and that the jet reduces this force by accelerating a mass of fluid in the pool, one would expect the amount of water contained in the jet to affect the peak accelerations. To attempt to approximate the required mass of fluid we start by asking the question: how much water in a jet is required to accelerate a large enough local moving pool with a velocity equal to
 $U_{j}/2$
(the cavity velocity)? Approximating the jet as a cylinder and maintaining the radius of the jet equal to
 $R_{s}$
, we define the jet volume as
 $\unicode[STIX]{x03C0}R_{s}^{2}L_{cr}$
, where
 $L_{cr}$
is the critical or minimum jet length for maximum force reduction. We approximate the local moving pool as a hemisphere of radius
 $\unicode[STIX]{x1D705}R_{s}$
, where
 $\unicode[STIX]{x1D705}$
is a scaling constant and equate the momentum of the impacting jet with the momentum of the local moving pool as follows:
 $$\begin{eqnarray}\unicode[STIX]{x1D70C}U_{j}\unicode[STIX]{x03C0}R_{s}^{2}L_{cr}\approx \unicode[STIX]{x1D70C}\frac{U_{j}}{2}\frac{1}{2}\frac{4}{3}\unicode[STIX]{x03C0}(\unicode[STIX]{x1D705}R_{s})^{3}.\end{eqnarray}$$
Solving for
 $L_{cr}$
we find that
 $L_{cr}\approx (1/3)\unicode[STIX]{x1D705}^{3}R_{s}$
. To approximate
 $\unicode[STIX]{x1D705}$
, we look at the velocity field in the pool created by the impact of a jet (figure 5
b at
 $t=16$
ms) and find the distance from the bottom of the cavity, along the axis of the jet, over which the average velocity equals
 $U_{j}/2$
. Setting that distance equal to
 $\unicode[STIX]{x1D705}R_{s}$
we find that
 $\unicode[STIX]{x1D705}=1.4$
which yields
 $L_{cr}\approx 0.91R_{s}$
or approximately one sphere radius
 $R_{s}$
.
To validate
 $L_{cr}$
experimentally we vary the length of the jet impacting in front of the sphere
 $L_{j}$
and examine its effect on the maximum sphere acceleration. To do this we plot the non-dimensional jet length
 $L_{j}/R_{s}$
against the maximum acceleration experienced by the sphere impacting inside a jet
 $a_{j}$
normalized by the measured maximum acceleration experienced by a sphere impacting a quiescent pool
 $a_{q}$
at the same absolute velocity
 $U_{o}$
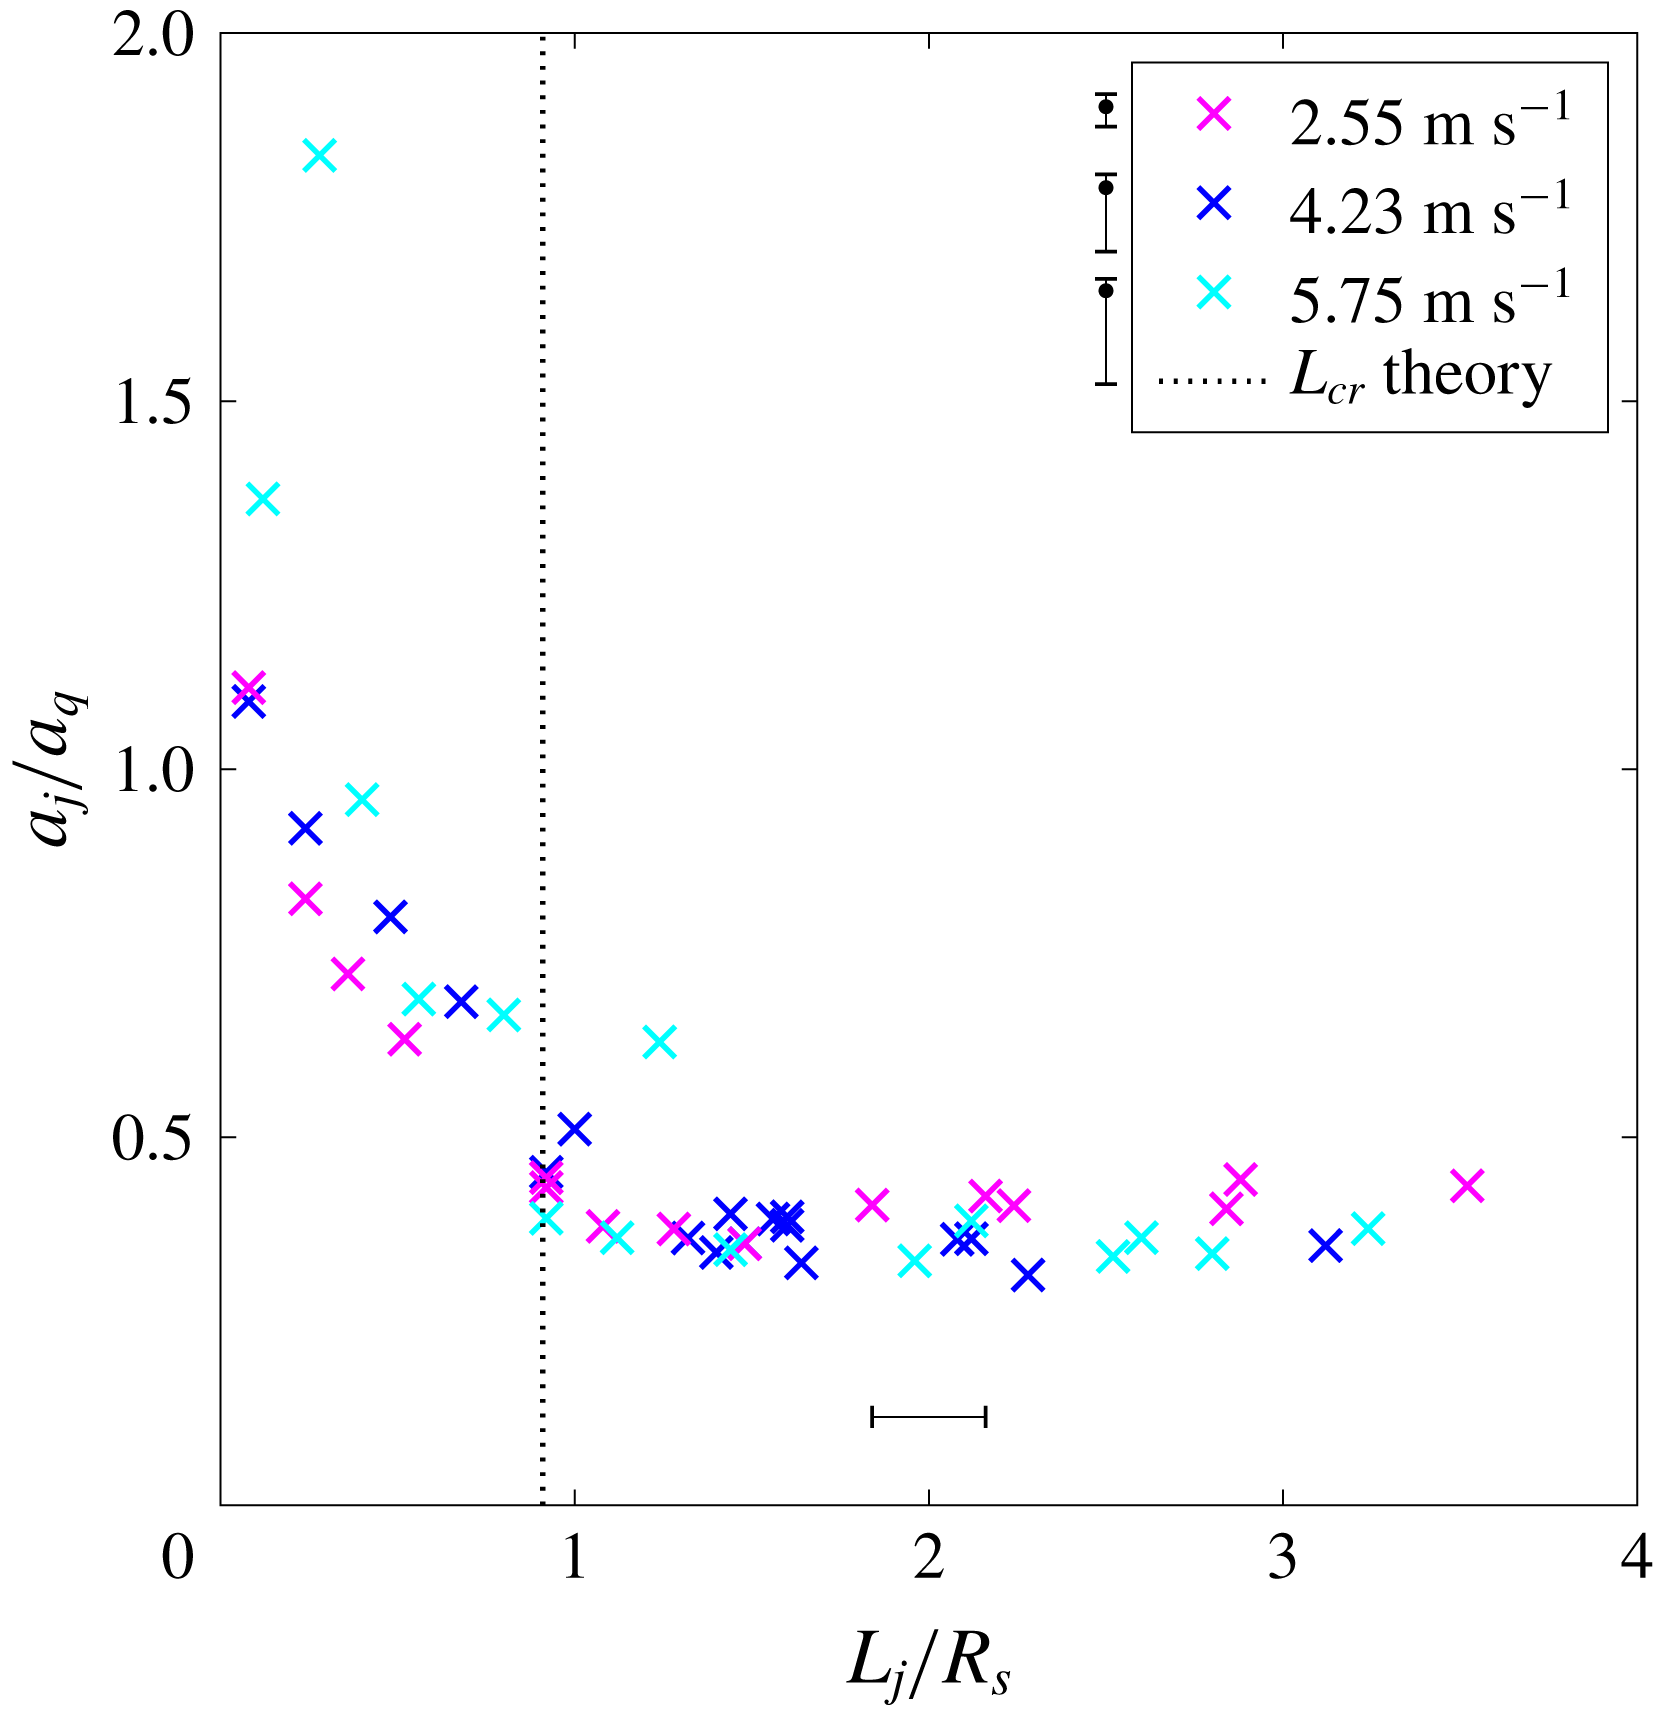
. Figure 6 shows that as
 $L_{j}$
increases from zero to approximately one sphere radius, the maximum impact acceleration decreases for all impact velocities tested (
 $U_{o}=2.55$
, 4.23, and
 $5.75~\text{m}~\text{s}^{-1}$
), but when
 $L_{j}\gtrsim R_{s}$
no further reduction is achieved. If
 $L_{j}=R_{s}$
the mass of liquid falling in front of the sphere is approximately equal to
 $V_{s}\unicode[STIX]{x1D70C}/2$
, which is the same as the added mass of a fully submerged sphere. Thus, the most efficient jet mass that will result in the maximum force reduction is of the order of the sphere added mass, which makes sense when one considers that the added mass is the fluid accelerated by the sphere.
Increasing the jet length in front of an impacting sphere
 $L_{j}$
decreases the maximum acceleration experienced by the sphere during the very initial stages of impact for
 $L_{j}<R_{s}$
. Once
 $L_{j}>R_{s}$
no further force reduction is achieved by increasing
 $L_{j}$
. The maximum acceleration of a sphere impacting inside a jet
 $a_{j}$
is non-dimensionalized by the maximum acceleration experienced by a sphere impacting a quiescent pool
 $a_{q}$
at the same absolute velocity
 $U_{o}$
. The uncertainty of the non-dimensionalized acceleration differs for each of the three impact velocity, with the asymmetric uncertainty bands shown next to the corresponding legend entry.

4 Conclusion
The water impact forces experienced by a falling body can be violent, due primarily to the fact that the body has to accelerate a mass of water from rest. If a liquid jet is made to impact prior to the body, then the forces can be significantly reduced by up to 75 %. The jet accelerates the previously quiescent water thereby reducing the added mass effect on the impacting body. A jet length comparable to the sphere radius is sufficient to achieve this effect. This information could lead to a reduction in the impact force on objects that are dropped or launched into water such as torpedoes, sonobuoys and space craft water landings.
Acknowledgements
N.B.S., T.T.T. and J.B. acknowledge funding from the Naval Research Enterprise Internship Program (NREIP) and the Office of Naval Research, Navy Undersea Research Program (grant N0001414WX00811), monitored by Ms M. Medeiros. J.B. acknowledges funding from the Naval Undersea Warfare Center In-House Laboratory Independent Research program, monitored by Mr N. Dubois. N.B.S and T.T.T acknowledge funding from the Utah State University Research and Graduate Studies Development Grant Program.
Supplementary movies
Supplementary movies are available at https://doi.org/10.1017/jfm.2018.931.