Implications
The importance of Zebu is related to their adaptation to the tropical climate, to pasture-based rearing systems and to high infestation with parasites. Stayability, a trait related to longevity, is one of the most important trait in beef cattle under the economic aspect. However, the phenotype of a cow for this trait is obtained around 7 years of age. Thus, bulls will have an advanced age when their daughters manifest the phenotype, resulting in low accuracy of genetic evaluations for younger bulls. The methodology proposed here could overcome this problem, promoting higher genetic improvement at a shorter period of time.
Introduction
In beef cattle farming, the cow is responsible for the effective size of the herd in subsequent years and special attention should therefore be paid to this component of the production system. The time cows stay in the herd is generally determined by a set of productive and reproductive factors (Bertazzo et al., Reference Bertazzo, Freitas, Gonçalves, Pereira, Eler, Ferraz, Oliveira and Andrade2004) that influence the decision of producers to keep or cull a cow. Longer-lived cows tend to be more profitable because of their greater capacity to return the capital invested in their rearing (Queiroz et al., Reference Queiroz, Figueiredo, Silva, Espasandin, Meirelles and Oliveira2007). For a herd to be considered profitable, the number of cows that stay after the period of payment of their production cost must be greater than that of females that have not yet provided return on the capital invested (Snelling et al., Reference Snelling, Golden and Bourdon1995).
Stayability (STAY) is defined as the ability of a cow to survive until a specific age given the opportunity to reach this age (Hudson and Van Vleck, Reference Hudson and Van Vleck1981). It is a particularly important trait in beef cattle and has received major attention from researchers in recent years because its inclusion in breeding programs could allow the selection of sires whose daughters have a greater probability of remaining productive in the herd for a long period of time (Van Melis et al., Reference Van Melis, Eler, Oliveira, Rosa, Silva, Ferraz and Pereira2007). The main problem that has been pointed out for this trait is that a female should reach a reference age (between 6 and 7 years depending on the definition) to manifest a phenotype. Thus, bulls will have an advanced age when their daughters manifest the phenotype, a fact resulting in low accuracy of genetic evaluations for younger bulls (Hudson and Van Vleck, Reference Hudson and Van Vleck1981; Jamrozik et al., Reference Jamrozik, McGrath, Kemp and Miller2013).
An interesting alternative to defining and analyzing STAY has been reported by Jamrozik et al. (Reference Jamrozik, McGrath, Kemp and Miller2013). The authors proposed the use of a random regression model for the evaluation of STAY to consecutive calvings and demonstrated its application using data from Canadian Simmental cattle. The advantages of this approach include the fact that the phenotypes can be assigned to each period in the lifetime of the cow, the breeding values for STAY can be estimated for each point of this trajectory, and the time/age-dependent environmental effects are easily implemented in the model (Jamrozik et al., Reference Jamrozik, McGrath, Kemp and Miller2013).
The primary importance of Zebu breeds in the tropics is related to their adaptation to the tropical climate, to extensive rearing systems and to high infestation with ecto- and endoparasites (Albuquerque et al., Reference Albuquerque, Mercadante and Eler2007). To our knowledge, no study has so far evaluated STAY to consecutive calvings in Zebu breeds. Therefore, the objective of the present study was to compare linear random regression models to fit STAY to consecutive calvings of Guzerá, Nelore and Tabapuã cows and to estimate genetic parameters for this trait in the respective breeds.
Material and methods
The databases analyzed in the present study were from the National Zootechnical Archive, managed by Embrapa Gado de Corte, Brazil, and contained data of genealogical records of three Bos indicus breeds: Guzerá, Nelore and Tabapuã cattle. The herds are located throughout all regions of Brazil. In Brazil, the animals of all Zebu breeds are raised mainly on pastures, regardless the fact they are selected for milk production, meat production or both. The database has records from farms who perform a mating season (the mating occurs only in a small season of the year) and farms where the mating occurs along the entire year. Therefore, all of the consistency of the records was performed taking into account this particularity.
The trait studied was STAY to consecutive calvings as defined by Jamrozik et al. (Reference Jamrozik, McGrath, Kemp and Miller2013). The following restrictions were applied to the inclusion of cows in the study: age at first calving between 20 and 60 months, age at calving between 20 and 240 months, and an interval between consecutive calvings of 305 to 820 days (take into account cow that failed to conceive in some year and stayed in the herd, a common practice in the herds studied). Cows submitted to embryo transfer or in vitro fertilization at some point in their life were excluded from the analyzes. After applying these restrictions and considering the number of records for all calvings (Supplementary Material Table S1), data up to the eighth calving were used as the relative frequency of animals was very low in subsequent calvings.
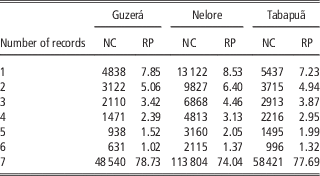
The phenotypes were assigned by observing whether the cow met the conditions cited above and had the opportunity to stay in the herd up to a given calving. Each cow could have up to seven repeated observations (stayability or not to calving 2, 3, … and 8). A phenotypic value 1 (success) was established for cows that had the respective calving and 0 (failure) for those that had the opportunity but did not calve. The last calving record (LCR) on the database was the most recent information available. For a cow without a record of it next calving until the date of the LCR, with an interval between the LCR and that date of the LCR available for this cow equal to 820 days or less, the subsequent phenotypes were considered ‘censored’ and treated as missing data in the model. To illustrate the assignment of these phenotypes, we may consider the example of four cows, called A, B, C and D. Cow A had eight calvings, so its vector of observations would be A=[1,1,1,1,1,1,1]. For cow B, four calvings (first to fourth) were observed and no further information about this cow was found given the possibility of manifesting the phenotype to subsequent calvings. Thus, its vector of observations would be B=[1,1,1,0,0,0,0]. In the case of cow C, the existence of four calvings was also verified, but this cow was found to be still young in relation to the LCR of the database (did not have the opportunity to manifest the remaining calvings). It was therefore not possible to determine whether or not the cow would stay in the herd. Consequently, the data of cow C were censored after the fourth calving (considered missing data) and its vector of observations was C=[1,1,1]. For cow D, only the record of the first calving was found given the possibility of the cow to manifest the phenotype to subsequent calvings. Its vector of observations would therefore be D=[0,0,0,0,0,0,0]. The description of distribution of observations according to calving and breed are shown in Table 1. The final data sets had 61 650 (1130), 153 709 (898) and 75 193 (727) cows (herds) with phenotypic records, daughters of 2811, 7295, 3961 sires, for the Guzerá, Nelore and Tabapuã cattle, respectively. The number of animals in the pedigree file for the Guzerá, Nelore and Tabapuã cattle were 85 757, 332 616, 90 100, respectively. The average equivalent complete generation (Maignel et al., Reference Maignel, Boichard and Verrier1996) were 4.05, 3.21 and 2.69, for Guzerá, Nelore and Tabapuã, respectively, indicating reasonable knowledge of the pedigree of animals participating in the analyses.
Distribution of the cows according to the number of phenotypic records (0 or 1)

NC= number of cows; RP=relative percentage.
Four seasons of birth were defined for analysis: February, March and April; May, June and July; August, September and October; November, December and January. The cows were divided into classes according to their age at first calving as follows: 20 to 24, 25 to 27, 28 to 30, 31 to 33, 34 to 36, 37 to 39, 40 to 42, 43 to 45, 46 to 48, 49 to 51, 52 to 54, 55 to 57 and 58 to 60 months. Random regression models for fitting the trait over the interval from the second to eighth calving were compared. The general model used was:
 $$\eqalignno{ y_{{ijklt}} \,{\equals}\,&{\rm YS}_{{it}} {\plus}{\rm AFC}_{{jt}} \!{\plus}\mathop \sum\limits_{m\,{\equals}\,1}^o \beta _{{km}} \,\varphi _{{mt}} {\plus}\mathop \sum\limits_{m{\equals}1}^o \alpha _{{lm}} \,\varphi _{{mt}} \cr&{\plus}\mathop \sum\limits_{m\,{\equals}\,1}^o \delta _{{lm}} \,\varphi _{{mt}} {\plus}{\epsilon}_{{ijklt}} ,$$
where y ijklt is the phenotype for STAY of cow l in calving t; YS it the systematic effect of year-season of birth subclass i in calving t; AFC jt the systematic effect of age at first calving class j in calving t; β km the regression coefficient for the random effect of each contemporary group k, defined as herd, year and season of birth; α lm and δ lm the regression coefficients for random additive genetic and permanent environmental effects of each cow l; ϕ mt the covariate of the Legendre polynomial for each regression coefficient in calving t; o the number of regression coefficients of the orthogonal Legendre polynomial used and ε ijklt the random error associated with each observation. The random regression models were fitted using orthogonal Legendre polynomials of order 1 to 4 (2 to 5 coefficients, respectively). In each model, the same order was used for contemporary group, additive genetic and permanent environmental effects, so that each effect had the same opportunity to explore the spaces of the curves (Jamrozik et al., Reference Jamrozik, McGrath, Kemp and Miller2013). A heterogenous residual variance structure was adopted, with one residual variance component for each calving.
The matrix representation of the model is:
 $${\bf{y\,{\equals}\,Xb{\plus}Cg{\plus}Za{\plus}Wp{\plus}e }} $$
where y is the vector of observations; b the vector of systematic effects (YS, AFC); g, a, p and e the vectors of random contemporary group, additive genetic, permanent environment and residual effects, respectively; X, C, Z and W the incidence matrices corresponding to the observations for systematic, contemporary group, random additive genetic and permanent environmental effects, respectively. The following assumptions were defined for this model:
 $$\eqalignno{ {\bf y}\,\mid\,&{\bf b},{\bf g},{\bf a},{\bf p},{\bf R} \,\sim\,{\rm NMV}\left( {{\bf Xb}{\plus}{\bf Cg}{\plus}{\bf Za}{\plus}{\bf Wp},{\bf R}} \right), \,\cr&{\rm Var}\left[ {\matrix{ {\bf g} \cr {\bf a} \cr {\bf p} \cr {\bf e} \cr } } \right]{\equals}\left[ {\matrix{ {{\bf \Lambda }_{{\bf G}} {\bf \,\otimes\,} {\bf I}} & 0 & 0 & 0 \cr 0 & {{\bf \Lambda }_{{\bf A}} {\bf \,\otimes\,} {\bf A}} & 0 & 0 \cr 0 & 0 & {{\bf \Lambda }_{{\bf P}} {\bf \,\otimes\,} {\bf I}} & 0 \cr 0 & 0 & 0 & {\bf R} \cr } } \right],$$
where Λ G , Λ A and Λ P are contemporary group, additive genetic and permanent environmental covariance matrices between the regression coefficients, respectively; R the 7×7 diagonal residual variance matrix, with one specific variance for each calving; A the numerator relationship matrix between animals; I the identity matrix and ⊗ the direct product operator between matrices.
Analysis was performed by the Bayesian method using the GIBBS3F90 program (Misztal et al., Reference Misztal, Tsuruta, Strable, Auvray, Druet and Lee2002). The following prior distributions were assumed for the model:
 $$\eqalignno{ & \quad\quad\quad{\bf b}\, \propto\,constant, \cr & {\bf g} \,\mid\,{\bf \Lambda }_{{\bf G}} \,\sim\,{\rm MVN}(0,{\bf \Lambda }_{{\bf G}} \,\otimes\,{\bf I}), \cr & {\bf a} \,\mid\, {\bf \Lambda }_{{\bf A}} \,\sim\,{\rm MVN}(0,{\bf \Lambda }_{{\bf A}} \,\otimes\,{\bf A}), \cr & {\bf p} \,\mid\,{\bf \Lambda }_{{\bf P}} \,\sim\,{\rm MVN}(0,{\bf \Lambda }_{{\bf P}} \,\otimes\,{\bf I}), \cr & {\bf \Lambda }_{{\bf G}} \,\mid\, v_{g} ,{\bf S}_{{\bf g}} \,\sim\,{\rm IW}(v_{g} ,v_{g} {\bf S}_{{\bf g}} ), \cr & {\bf \Lambda }_{{\bf A}} \,\mid\, v_{a} ,{\bf S}_{{\bf a}} \,\sim\,{\rm IW}(v_{a} ,v_{a} {\bf S}_{{\bf a}} ), \cr & {\bf \Lambda }_{{\bf P}} \,\mid\, v_{p} ,{\bf S}_{{\bf p}} \,\sim\,{\rm IW}(v_{{\rm p}} ,v_{{\rm p}} {\bf S}_{{\bf p}} ), \cr & {\bf R} \,\mid\, v_{e} ,{\bf S}_{{\bf e}} \,\sim\,{\rm IW}(v_{{\rm e}} ,v_{{\rm e}} {\bf S}_{{\bf{e}} } ), $$
where MVN and IW indicate multivariate normal and inverse Wishart distributions, respectively, and v g,S g , v a,S a , v p,S p , and v e,S e correspond to the degree of confidence and prior values for contemporary group, additive genetic, permanent environmental and residual covariances, respectively.
An additional analysis was performed for each breed using a threshold model for a classical definition of STAY published in one of Zebu sire summaries in Brazil (Lôbo et al., Reference Lôbo, Bezerra, Figueiredo, Baldi, Faria, Vozzi, Magnabosco, Bergmann and Oliveira2016), which is the ability of a cow to stay in the herd up to 76 months of age and to have at least three calvings. The cow received the phenotypic value 1 (success) if it met the cited criterion, and 0 (failure) when it had the opportunity but failed to meet the criterion established. For this trait, an animal model was used and included the systematic effects of age at first calving and year-season of birth class and random contemporary group, additive genetic and residual effects. These analyses were performed with the THRGIBBS2F90 software (Misztal et al., Reference Misztal, Tsuruta, Strable, Auvray, Druet and Lee2002) and the heritability estimates and respective 95% highest posterior density intervals (HPD95%) were calculated.
For comparison with the heritabilities obtained with the threshold models, the estimates of the linear random regression models were transformed to an underlying normal scale as suggested by Robertson and Lerner (Reference Robertson and Lerner1949):
 $$h_{u}^{2} \,{\equals}\,{{h_{1}^{2} p_{i} (1{\minus}p_{i} )} \over z}$$
where
 $h_{u}^{2} $
is the heritability on the underlying normal scale;
 $h_{1}^{2} $
is the heritability obtained by random regression on the binary data; p
i
is the frequency of success (phenotype 1) for the trait in calving i, and z is the height of the ordinate at the point of truncation with area p
i
below the normal curve.
The following criteria were used for comparison of the random regression models:
1. Correlation (R) between the phenotype predicted with the respective model and the observed binary phenotype.
2. Mean absolute value of residuals (RES).
3. Deviance information criterion (DIC) proposed by Spiegelhalter et al. (Reference Spiegelhalter, Best, Carlin and Van Der Linde2002):
 ${\rm DIC}{\equals} \bar{D}\left( \theta \right){\plus}p_{D} {\equals}2\bar{D}\left( \theta \right){\plus}D(\bar{\theta })$
, where
$\bar{D}\left( \theta \right){\equals}E_{{\theta \,\mid\,y}} \left[ {D\left( \theta \right)} \right] $
(posterior expectation of Bayesian deviance) and D(θ)=−2lnp(y|θ). The effective number of parameters represents a penalty with increasing complexity of the model:
$ p_{D} {\equals}\bar{D}\left( \theta \right){\minus}D(\bar{\theta })$
, where θ is the vector of parameters of the model and
$D(\bar{\theta })$
is the Bayesian deviance evaluated at the posterior means of the parameters.
4. Bayesian deviance: D(θ)=−2lnp(y|θ), where p(y|θ) is the posterior marginal density.


For DIC and D(θ), lower values indicate more adequate models.
As complementary analysis for comparison of the models, the rank correlations between animals were calculated, classifying them according to the predicted breeding values for the intercept coefficient obtained with each model.
A chain with 300 000 samples was generated for each model, with a burn-in period of 30 000 samples and a thinning interval of 10. Convergence was monitored by graphic inspection of the parameter estimates across iterations, as well as by the criteria of Geweke (Reference Geweke1992) and Raftery and Lewis (1992), using the boa package (Smith, Reference Smith2007) of the R software (R Development Core Team, Reference Raftery and Lewis2014). Thus, the variance components for the regression coefficients and genetic parameters (heritability and genetic correlation) were estimated from the remaining 27 000 samples. Heritability was calculated as the proportion of additive genetic variance in relation to the sum of contemporary group, additive genetic, permanent environmental and residual variances.
Results and discussion
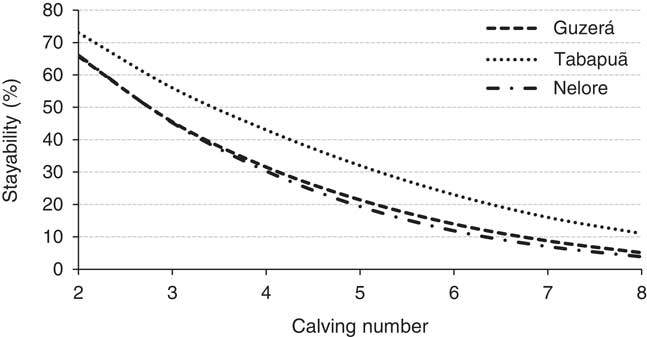
The means of STAY to consecutive calvings showed the same trend in the Guzerá, Nelore and Tabapuã breeds (Figure 1). The cull rate of primiparous cows between the first and second calving was 43%, 27% and 34% for Guzerá, Nelore and Tabapuã, respectively. The cumulative cull rate until the eighth calving was ~91%, 97% and 96% for Guzerá, Nelore and Tabapuã cows, respectively. Mean STAY was high in early calvings and similar among breeds, but the cull rates between two consecutive calvings were higher than those between later calvings of the longitudinal scale. This higher cull rate in early calvings may be explained by the occurrence of problems mainly related to reproduction of primiparous cows, as well as by low maternal ability of the cows and selective culling for the inclusion of genetically superior females in the herd. Differences in STAY between breeds in each calving may indicate differences in productive and reproductive performance and their influence on the maintenance or culling of cows, or even differences in the criteria or intensities of selection practiced by breeders. In a study involving crossbred Angus×Hereford and Bos indicus×Hereford cows, Riley et al. (Reference Riley, Sanders, Knutsun and Lunt2001) observed that reproductive failure was the main cause of culling, regardless of calving number. Martinez et al. (Reference Martinez, Koch, Cundiff, Gregory, Kachman and Van Vleck2005), who analyzed STAY up to calvings 2 to 6 as distinct traits in Hereford cows, found results that were similar in magnitude for STAY to early calvings and higher for later calvings when compared with the present study. Jamrozik et al. (Reference Jamrozik, McGrath, Kemp and Miller2013), evaluating STAY to consecutive calvings in Canadian Simmentals, reported means of STAY that were very similar, both in magnitude and trend across calvings, to those found in the present study for Tabapuã cattle. When analysis was performed using the traditional definition of STAY and the threshold model, the success rate was ~34%, 38% and 45% for Guzerá, Nelore and Tabapuã, respectively. These results demonstrate one of the advantages of the definition of STAY to consecutive calvings, which permits a more detailed analysis of the populations studied regarding this trait.
Average stayability to consecutive calvings according to breed.

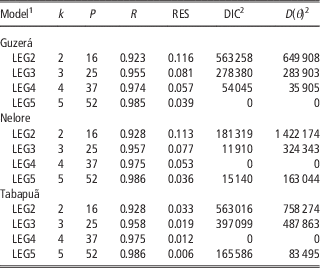
Analysis of R and RES values showed improvement in the goodness-of-fit of the models with increasing order of the polynomial used (Table 2). However, higher-order polynomials result in greater parameterization of the model, a fact that generally increases computational demands to obtain accurate estimates of the parameters of interest such as breeding values of the animals. For this reason, the models were also compared using DIC, a criterion that does not only consider the goodness-of-fit but also penalizes greater parameterization caused by higher-order polynomials. Using DIC as a criterion, the model with 4 regression coefficients (cubic) for each random effect was found to be the most adequate for STAY to consecutive calvings in the Nelore and Tabapuã breeds. However, for Guzerá, the best model according to DIC was that including 5 coefficients (quartic). The Bayesian deviance values (D(θ)) also indicated the models chosen based on DIC as the best models. Jamrozik et al. (Reference Jamrozik, McGrath, Kemp and Miller2013), working with data from Canadian Simmentals, also recommended the use of a linear random regression model in which the random regressions for contemporary group, additive and permanent environmental effects were modeled by cubic orthogonal Legendre polynomials.
Number of regression coefficients (k) for the contemporary group, additive genetic and permanent environmental random effects, number of parameters (p), correlation between observed and predicted binary phenotype (R), mean absolute value of residuals (RES), Deviance Information Criterion (DIC) and Bayesian deviance (D(θ)) for the random regression models

1 LEGk, where k=number of regression coefficients for the contemporary group, additive genetic and permanent environmental random effects.
2 Values scaled as deviation from the respective ‘best’ values for each breed.
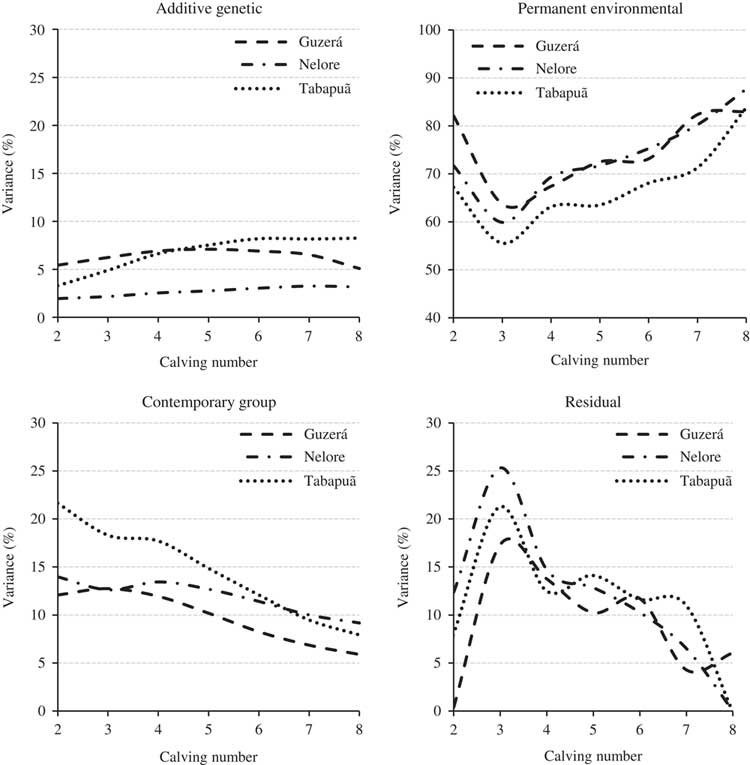
Applying the model with 4 coefficients for each random effect (additive genetic, permanent environmental and contemporary group) for Nelore and Tabapuã breeds and a model with 5 coefficients for each random effect for Guzerá, the parameters (variances, heritabilities and correlations) were estimated. Figure 2 shows the proportion of phenotypic variance explained by each random effect. The effect of the permanent environment most contributed to phenotypic variation, regardless of breed or calving, with values ranging from 63% to 83%, 59% to 87% and 55% to 93% for Guzerá, Nelore and Tabapuã, respectively. The trend observed was a decrease between the second and third calving and an increase over subsequent calvings. Analyzing a population of Canadian Simmentals, Jamrozik et al. (Reference Jamrozik, McGrath, Kemp and Miller2013) found an important contribution of the permanent environmental effect, but the proportions were lower than those observed in the present study. The participation of the contemporary group effect decreased across calvings, with magnitudes of ~6% to 13%, 9% to 14% and 8% to 21% for Guzerá, Nelore and Tabapuã, respectively. These findings show that this effect, which is related to the environment during the early stages of animal growth, has a greater influence on STAY during early calvings, a fact also observed by Jamrozik et al. (Reference Jamrozik, McGrath, Kemp and Miller2013) for Canadian Simmentals. Residual variance contributed ~0.4% to 17%, 0.005% to 15% and 0.03% to 14% to phenotypic variability in the Guzerá, Nelore and Tabapuã breeds, respectively. Peak values were observed in the third calving and the values at the extremes (calvings 2 and 8) were considerably low. Jamrozik et al. (Reference Jamrozik, McGrath, Kemp and Miller2013) observed a relatively greater contribution of residual variance. This lower ratio of residual to phenotypic variance is an indicator that part of the residual effect was estimated as permanent environmental effect. The trends for the variance estimates were similar among breeds, except for the additive genetic variance that showed a slightly different trend in the Tabapuã compared with the other two breeds studied (Supplementary Material Figure S1).
Contribution (%) of additive genetic, permanent environmental, contemporary group and residual variance to the total (phenotypic) variance of stayability to consecutive calvings according to breed.

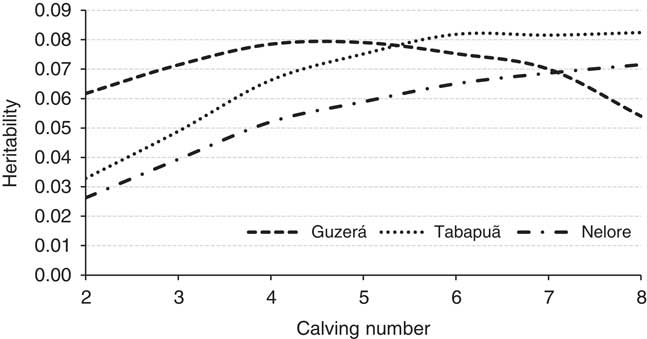
The posterior means of heritability for STAY to each calving ranged from 0.05 to 0.08 in the Guzerá breed, showing a quadratic trend with a peak between the fourth and sixth calving (Figure 3). For Nelore and Tabapuã, the estimates ranged from 0.03 to 0.07 and from 0.03 to 0.08, respectively, and tended to increase with calving number. Martinez et al. (Reference Martinez, Koch, Cundiff, Gregory, Kachman and Van Vleck2005) analyzed STAY data to different calvings of Hereford cattle in the United States using linear models for binary data and obtained slightly higher estimates (0.05 to 0.19) that increased from the second to the sixth calving. For Canadian Simmentals, Jamrozik et al. (Reference Jamrozik, McGrath, Kemp and Miller2013) found estimates of a higher magnitude ranging from 0.12 to 0.36, which decreased with increasing calving number.
Heritability estimates for stayability to consecutive calvings according to breed.

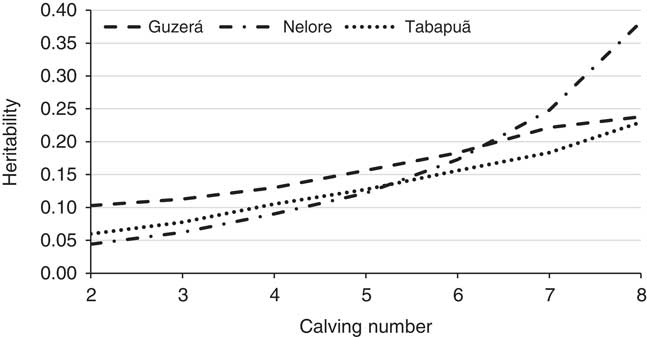
Transformation of the heritabilities of the linear random regression model to the underlying normal scale (Figure 4) resulted in estimates of 0.10 to 0.24, 0.04 to 0.38 and 0.06 to 0.23 for Guzerá, Nelore and Tabapuã, respectively. For all breeds, these estimates increased with calving number. Using the threshold model to fit binary data to the classical definition of STAY, the posterior means of heritability (and their respective HPD95%) were 0.09 (0.07 to 0.12), 0.09 (0.08 to 0.10) and 0.09 (0.07 to 0.11) for Guzerá, Nelore and Tabapuã, respectively. These values are similar to those obtained with the random regression models for STAY to early calvings, but lower than the estimates obtained for STAY to later calvings. Using the classical definition of STAY (success when the cow stays in the herd until 6 years of age given the opportunity to mate and calve regularly until this age), Santana et al. (Reference Santana, Eler, Ferraz and Mattos2012 and 2015) reported a heritability of 0.11 for Nelore cattle, a similar value estimated in the present study for a classical definition of STAY analyzed using the threshold model. Also in Nelore cattle, Silva et al. (Reference Silva, Eler, Ferraz, Golden and Oliveira2003) studied some definitions for STAY in which the cow should calve every year until 5, 6 or 7 years of age and reported heritabilities of 0.11, 0.12 and 0.17, respectively, magnitudes similar to those observed in the present study.
Heritability estimates, on the underlying normal scale, for stayability to consecutive calvings according to breed.

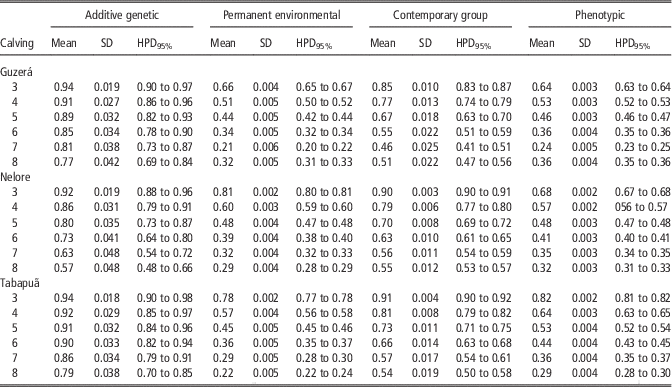
The additive genetic correlations showed a similar trend among breeds and were higher for STAY between closer calvings (Table 3). Even for more distant calvings (second and eighth), the additive genetic correlations for STAY were moderate to high (0.77, 0.57 and 0.79 for Guzerá, Nelore and Tabapuã, respectively), indicating that STAY to the second calving is a good indicator of STAY to subsequent calvings. Thus, selection could be performed in the second calving to reduce the generation interval and to increase annual genetic gain. The same conclusion has been drawn by Jamrozik et al. (Reference Jamrozik, McGrath, Kemp and Miller2013). In general, the additive genetic correlations obtained in this study for Zebu breeds were higher than those reported by Jamrozik et al. (Reference Jamrozik, McGrath, Kemp and Miller2013) for Simmentals and by Martinez et al. (Reference Martinez, Koch, Cundiff, Gregory, Kachman and Van Vleck2005) for a Hereford herd. The permanent environmental correlations for all breeds decreased with increasing distance between calvings. The contemporary group correlations exhibited a similar trend and magnitude in the breeds and also decreased with increasing distance between calvings. In contrast, slightly higher phenotypic correlations were obtained for the Tabapuã when compared with Guzerá and Nelore breeds.
Means, standard deviations (SD) and highest posterior density intervals (HPD95%) for the additive genetic, permanent environmental, contemporary group and phenotypic correlations between the stayability to second calving and stayability to later calvings

The heritabilities of the regression coefficients ranged from 0.01 to 0.09, 0.02 to 0.06 and 0.01 to 0.09 for Guzerá, Nelore and Tabapuã, respectively, with higher values being observed for the first regression coefficients. As the first coefficient has the same weight for STAY in all calvings and showed the highest heritability in all breeds, selection for STAY using this coefficient may result in a favorable change in the average of the population in all calvings studied. To support this conclusion, the correlations between breeding values for STAY to each calving and for the first regression coefficient were estimated and the values observed were high for all breeds and in all calvings (Supplementary Material Figure S2).
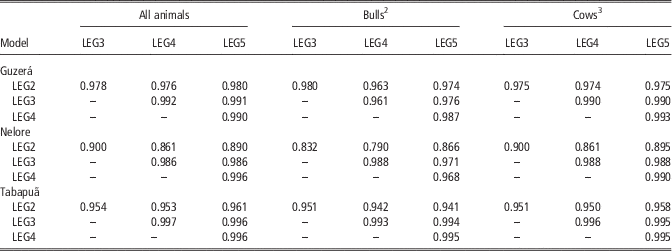
Analysis of rank correlations between predicted breeding values for the intercept coefficient obtained with the models studied (Table 4) generally showed high correlations (>0.99) between models with 3, 4 or 5 coefficients. On the other hand, genetic evaluation using the model with 2 coefficients resulted in considerable alterations in the ranking of animals when compared with the other models, demonstrating that this model would be inadequate for the genetic evaluation of this trait. For the Guzerá breed, the high rank correlations between models with 4 and 5 coefficients indicate that the simpler model with 4 coefficients could be used in genetic evaluations, replacing the model with the best fit.
Rank correlations using the breeding values for the first regression coefficient predicted with the studied modelsFootnote 1

1 LEGk, where k=number of regression coefficients for the contemporary group, additive genetic and permanent environmental random effects.
2 Sires of cows with phenotipic records.
3 Cows with phenotipic records.
Selection for STAY to a specific age, generally 76 months, which usually requires a minimum of three calves born, does not promote a complete differentiation of productivity in genetic evaluations as these cows may have a larger number of calves during the same period, and are therefore more productive for the herd, but eventually receive the same phenotype as less productive cows. The definition of STAY to consecutive calvings using random regression models permits to identify and separate the effects that influence each calving of a female. As emphasized by Jamrozik et al. (Reference Jamrozik, McGrath, Kemp and Miller2013), the use of this definition in breeding programs also has the advantage that phenotypes can be obtained earlier, as well as a larger number of phenotypic records per cow, increasing the accuracy of dam and sire predicted breeding values. Using this approach, selection could be performed using breeding values for STAY to second calving because of its moderate to high additive genetic correlations with STAY to eighth calving, increasing genetic gain by reducing the generation interval.
The random regression methodology applied to the definition of STAY to consecutive calvings can be used for the genetic evaluation of Zebu beef cattle. A model that uses 4 regression coefficients for additive genetic, contemporary group and permanent environmental effects is recommended.
Ackonwledgements
The authors are grateful to Embrapa Gado de Corte for providing access to the database used in this study. They thank the Conselho Nacional de Desenvolvimento Científico e Tecnológico (CNPq) for the fellowship granted to DO Silva. This work was funded by Fundação de Amparo à Pesquisa do Estado de Mato Grosso (FAPEMAT).
Supplementary material
To view supplementary material for this article, please visit https://doi.org/10.1017/S1751731117003457