I. INTRODUCTION
Cu–Cr–Zr alloys have been widely used for many electrical applications, such as integrated circuit lead frame materials, diverter target materials and railway contact wires due to their high strength, outstanding electrical properties, thermal conductivity, excellent fatigue resistance, and formability. Reference Su, Dong, Liu, Li and Kang1–Reference Bi, Liu, Chen, Liu, Li and Ma3 Multiple studies have been carried out on the Cu–Cr–Zr alloys, and most of them focused on improving physical and mechanical properties, such as ductility, thermal stability, fatigue resistance, recrystallization behavior after cold rolling, strength and conductivity. Reference Lin, Wang, Zhang, Zhang and Zhao4–Reference Liu, Kang, Cao, Huang, Yen and Gu6 The dynamic recovery (DRV) and dynamic recrystallization (DRX) occurring during hot deformation processing are important for obtaining suitable microstructure, which can influence mechanical and functional properties of the material and enhance its applicability. Reference Kong, Chang, Li, Xie and Zhu7–Reference Cram, Zuro, Brechet and Hutchinson9 There are some investigations of hot deformation of the Cu–Cr–Zr alloys. Ding et al. Reference Ding, Jia, Zhao, Deng and Song10 studied the Cu–0.6Cr–0.03Zr alloy and found that the DRX developed completely at 750 °C and 850 °C when the grain size increased with decreasing strain rate and increasing deformation temperature. Ji et al. Reference Ji, Li, Ding, Yang and Li11 found that under the test condition the deformation activation energy of the Cu–0.36Cr–0.03Zr alloy was 432.6 kJ/mol, and an experimentally based constitutive model was developed to predict the flow stress of the alloy during high temperature deformation. Zhang et al. Reference Zhang, Volinsky, Tran, Chai, Liu and Tian12 found that the addition of Ce can improve the Cu–Cr–Zr alloy deformation activation energy during hot deformation. However, relations between the important points of the flow stress curves and the critical conditions for DRX initiation during hot working need further attention.
In this paper, the flow behavior, kinetic analysis, and DRX behavior of Cu–Cr–Zr–Ag alloys have been investigated by hot compression tests. The constitutive equations and hot deformation activation energy have been derived for the alloy. The critical conditions for DRX of the alloy were determined to describe the DRX behavior. The effects of deformation temperature and strain rate on the microstructure evolution of the alloy are also discussed.
II. EXPERIMENTAL DETAILS
The Cu–Cr–Zr–Ag alloy was prepared using pure Cu, Cr, Zr, and Ag by melting in a vacuum induction furnace in argon, and then cast into a low-carbon steel mold with Φ 83 mm × 150 mm dimensions. The chemical composition in wt% of this alloy is: 0.8 Cr, 0.3 Zr, 0.2 Ag, and Cu balance. The ingot was homogenized at 930 °C for 2 h to remove the alloying elements segregation. Subsequently, the ingot was forged into 25 mm diameter bars. Finally, the forged bars were solution-treated at 900 °C for 1 h, followed by water quenching.
The compression specimens with the diameter of 8 mm and the length of 12 mm were machined with their cylinder axes parallel to the axial line direction of the bar. Hot compression tests were carried out using the Gleeble-1500D thermomechanical simulator (Data Sciences International, Inc., New Brighton, Minnesota) at a strain rate of 0.001–10 s−1 and deformation temperature of 650–950 °C. The specimens were heated to the deformation temperature at 5 °C/s heating rate. Before deformation, all specimens were kept at the deformation temperature for 180 s to ensure a uniform starting temperature and decrease the material anisotropy. The accuracy of temperature control was ±0.5 °C. The yield stress standard deviation for the performed measurements was ±3 MPa. The standard deviation meets the ASTM-E8 standard and the error bars for the yield stress are less than ±1.5%. After compression testing, the specimens were immediately quenched by water. The deformed specimens were sectioned through the longitudinal axis. All specimens were polished and then etched with a solution of FeCl3 (5 g) + C2H5OH (85 mL) + HCl (10 mL). The microstructure was observed using OLYMPUS PMG3 optical microscope (Olympus Optical Co. Ltd., Tokyo, Japan). Transmission electron microscopy (TEM) samples were prepared using Gatan 691 ion beam thinner (Gatan, Inc., Pleasanton, California). The precipitated phase was characterized using JEM-2100 high resolution TEM (JEOL Ltd., Tokyo, Japan).
III. RESULTS AND DISCUSSION
A. Flow stress behavior
The true stress–true strain curves obtained for the Cu–Cr–Zr–Ag alloy at various strain rates and deformation temperatures are shown in Fig. 1. The flow stress increased with the strain rate and stress decreased with the deformation temperature. The flow stress rapidly increased to a maximum value at a certain strain, and then gradually decreased to a steady state value at higher temperature and lower strain rate. This result is characteristic for hot working accompanied by dynamic softening. Reference Galiyev, Kaibyshev and Gottstein13 It can be seen that a typical DRX behavior was observed at the deformation temperature of 950 °C in Fig. 1.
True stress–strain curves of the Cu–Cr–Zr–Ag alloy under different deformation temperatures with strain rates: (a)
 $\dot \varepsilon = 0.001\;{{\rm{s}}^{ - 1}}$
; (b)
 $\dot \varepsilon = 0.01\;{{\rm{s}}^{ - 1}}$
; (c)
 $\dot \varepsilon = 0.1\;{{\rm{s}}^{ - 1}}$
; (d)
 $\dot \varepsilon = 1\;{{\rm{s}}^{ - 1}}$
; (e)
 $\dot \varepsilon = 10\;{{\rm{s}}^{ - 1}}$
.

True stress–true strain curves show typical DRV behavior at lower temperature and higher strain rate. DRV phenomenon happens because the higher strain rate or lower temperature provides shorter time for energy accumulation and lower grain boundary mobility. Reference Li, Feng, Song, Liu, Bai, Ren and Shangguan14 The effect of work hardening is stronger than the effect of dynamic softening. Continuous strain hardening was observed at the deformation temperature of 650 °C in Fig. 1.
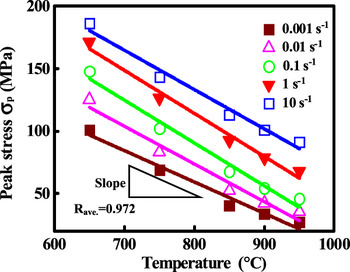
The variations in the peak stress (σp) at various temperatures and strain rates are shown in Fig. 2. The peak stress strongly depends on the strain rate and temperature. It can also be found that the peak stress increases with the increase of strain rate and the decrease of deformation temperature.
Peak stress of the true stress–strain curves for the Cu–Cr–Zr–Ag alloy under different deformation conditions.

B. Activation energy and constitutive equation
In hot working, the activation energy is related to the hot deformation mechanisms, such as DRV, DRX, and grain growth through the Zener–Hollomon parameter. Reference Salvatori, Inoue and Nagai15 The critical conditions for DRX initiation can also be determined by the activation energy. The hyperbolic-sine Arrhenius equation is widely used to describe the effects of the deformation temperature, strain rate, and activation energy. It can be expressed as Reference Xu, Xi and Sun16–Reference Quan, Shi, Wang, Kang, Ku and Song18 :
 $$\dot \varepsilon = A{\left[ {\sinh \left( {\alpha \sigma } \right)} \right]^n}\exp \left( { - {Q \over {RT}}} \right) \quad .$$
here,
 $\dot \varepsilon$
is the strain rate (s−1), Q is the activation energy of DRX (kJ/mol), R is the universal gas constant [8.314 J/(mol K)], T is the absolute temperature (K), σ is the flow stress (MPa) for a given stain, A (s−1), n and α (MPa−1) are the materials constants (α = β/n). Taking natural logarithms of both sides of Eq. (1) yields:
 $$\ln \left[ {\sinh \left( {\alpha \sigma } \right)} \right] = {1 \over n}\ln\, \dot \varepsilon + {Q \over {nR}}\left( {{1 \over T}} \right) - {1 \over n}\ln\, A \quad .$$
The values of β and n at constant deformation temperature can be determined from the slope of the plots in Figs. 3(a) and 3(b) (
 $\ln \,\dot \varepsilon$
versus σ and
 $\ln \,\dot \varepsilon$
versus ln σ). The corresponding average values are: n = 10.24, β = 0.12. Thus, the α value of the alloy is calculated as α = β/n = 0.012 MPa−1.
Relationships between: (a)
 $\ln\, \dot \varepsilon$
and σ; (b)
 $\ln\, \dot \varepsilon$
and ln σ.

If
 $\dot \varepsilon$
is a constant, Eq. (2) can be expressed as:
 $$Q = R{\left[ {{{\partial \left( {\ln \,\dot \varepsilon } \right)} \over {\partial \ln \left[ {\sinh \left( {\alpha \sigma } \right)} \right]}}} \right]_T}{\left[ {{{\partial \ln \left[ {\sinh \left( {\alpha \sigma } \right)} \right]} \over {\partial \left( {{1 \mathord{\left/ {\vphantom {1 T}} \right. \kern-\nulldelimiterspace} T}} \right)}}} \right]_{\dot \varepsilon }} = Rn'S \quad .$$
Linear relationship between
 $\ln \,\dot \varepsilon - \ln \left[ {\sinh \left( {\alpha \sigma } \right)} \right]$
and
 $\ln \left[ {\sinh \left( {\alpha \sigma } \right)} \right] - {1 \mathord{\left/ {\vphantom {1 T}} \right. \kern-\nulldelimiterspace} T}$
at different temperatures is evident in Figs. 4(a) and 4(b). The mean value of all the slopes in Fig. 4(a) is n′, and the mean value of all the slopes in Fig. 4(b) is S. The average slopes (n′ and S) for the
 $\ln \dot \varepsilon - {\rm{ln}}\left[ {{\rm{sinh}}\left( {\alpha \sigma } \right)} \right]$
and
 ${\rm{ln}}\left[ {{\rm{sinh}}\left( {\alpha \sigma } \right)} \right] - {{1000} \mathord{\left/ {\vphantom {{1000} T}} \right. \kern-\nulldelimiterspace} T}$
plots are 7.72 and 5.35, respectively. Consequently, the value of Q for the experimental alloy is Q = Rn′S = 343.23 kJ/mol. The Q value of this alloy is a little lower than that of Cu–0.6Cr–0.03Zr alloy (572.053 kJ/mol), Cu–0.36Cr–0.03Zr alloy (432.6 kJ/mol), and Cu–0.8Cr–0.3Zr alloy (400.8 kJ/mol) compared with Refs. Reference Ding, Jia, Zhao, Deng and Song10, Reference Ji, Li, Ding, Yang and Li11 and Reference Zhang, Chai, Xu, Tian, Liu and Liu19, respectively. Compared with the above references, Ag has similar crystal structure and electro negativity to Cu. The grains of Cu–Cr–Zr alloy are refined by the addition of Ag. Thus, the DRX nucleation is improved by the increase of grain boundary area due to the grain refinement effect with Ag addition. After that, the accumulated energy and the formation of dislocation density are increased by the addition of Ag. This also indicates that Ag addition can refine the grain and effectively fix dislocations at the grain boundaries and maintain high dislocation density. Finally, the driving force for recrystallized nucleation was improved. Therefore, the DRX is easier to occur for this experimental alloy. Ag addition will improve the DRX and optimize the hot workability of the Cu–Cr–Zr alloy.
Relationships between: (a) ln[sinh(ασ)] and
 $\ln\, \dot \varepsilon$
; (b) ln[sinh(ασ)] and 1000/T.

The effects of temperature and strain rate on deformation behavior can be represented by a temperature-compensated strain rate factor, the Zener–Hollomon parameter, Z Reference Etaati and Dehghani20,Reference Quan, Mao, Li, Lv, Wang and Zhou21 :
 $$Z = \dot \varepsilon \,\exp \left( {{Q \over {RT}}} \right) = A{\left[ {\sinh \left( {\alpha \sigma } \right)} \right]^n} \quad .$$
Taking natural logarithms of both sides of Eq. (4) yields:
 $$\ln\, Z = \ln\, A + n\,\ln \left[ {\sinh \left( {\alpha \sigma } \right)} \right] \quad .$$
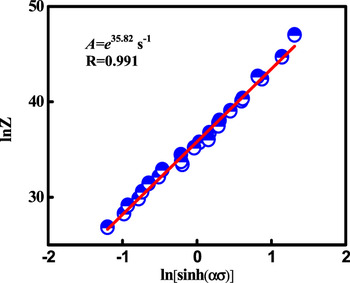
Here, n is the stress index, and A is a material constant. Figure 5 illustrates the relationship between ln[sinh(ασ)] and ln Z for the Cu–Cr–Zr–Ag alloy. The plot exhibits linear correlation between the peak stress and the Z value with the regression coefficient of 0.99. The value of n = 7.62 is the slope and the value of ln A = 35.82 is the intercept of the fitted curves in Fig. 5.
The Zener–Hollomon parameter, Z, as a function of the flow stress.

Thus, the constitutive equation of the Cu–Cr–Zr–Ag alloy in the hyperbolic-sine function can be expressed as:
 $$\dot \varepsilon = {{\rm{e}}^{35.82}}{\left[ {\sinh \left( {0.012\sigma } \right)} \right]^{7.62}}\,\exp \left( { - {{343.23} \over {RT}}} \right) \quad .$$
C. Characteristic points of the flow curves
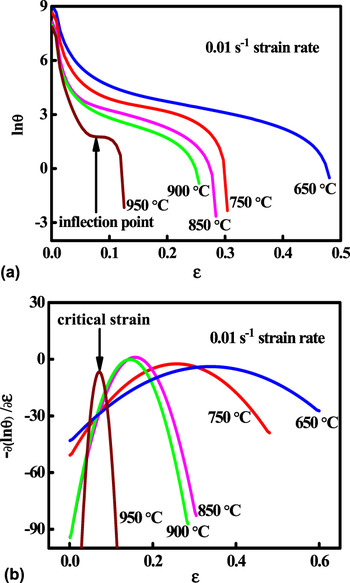
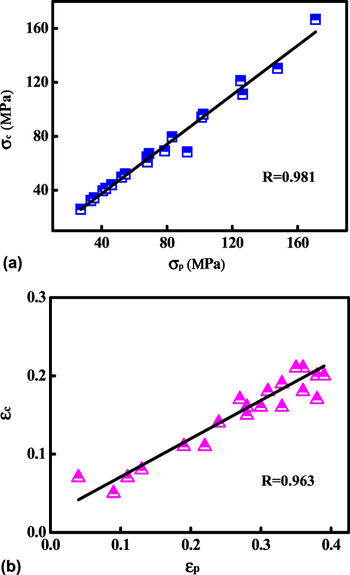
The critical strain (εc) of material is important for DRX research. The accurate and simple method to determine the critical strain for the initiation of DRX is derived from the flow curves. Reference Wang, Li, Wang, Zhou and Chiba22 Poliak and Jonas Reference Poliak and Jonas23 have shown that the inflection in ln θ–ε curves can be used to find the critical strain for the onset of DRX. The ln θ–ε curve and its corresponding third order polynomial for the Cu–Cr–Zr–Ag alloy deformed at the strain rate of 0.01 s−1 and varying temperature are shown in Fig. 6. The inflection point of the ln θ–ε curves is marked by an arrow in Fig. 6(a) and is clear for the critical strain εc of the alloy deformed at 950 °C with strain rate of 0.01 s−1. The inflection point corresponds to the maximum value on the −∂(ln θ)/∂ε − ε versus ε curve shown in Fig. 6(b). All the curves have clear inflection points in Fig. 6(a) and the critical strain in Fig. 6(b), which clearly indicate that DRX occurs at all deformation temperatures under the strain rate of 0.01 s−1. The critical strain related to the onset of DRX decreases with temperature because it is a thermally activated process. The energy accumulated for the nucleation and growth of the DRX grains at lower temperature is insufficient. Reference Wu, Yang, Liao and Zhu24 Similar results were observed by Han et al. Reference Han, Wu, Zhang, Zou, Liu and Qiao25 for the 254SMO super-austenitic stainless steel and by Ji et al. Reference Ji, Li and Li26 for the Cu–Mg alloys. The relationships between critical strain εc and peak strain εp, critical stress σc and peak stress σp are shown in Fig. 7. According to Figs. 7(a) and 7(b), the normalized critical strain and stress could be presented as:
 $${{{\sigma _{\rm{c}}}} \mathord{\left/ {\vphantom {{{\sigma _{\rm{c}}}} {{\sigma _{\rm{p}}}}}} \right. \kern-\nulldelimiterspace} {{\sigma _{\rm{p}}}}} = 0.91 \quad .$$
 $${{{\varepsilon _{\rm{c}}}} \mathord{\left/ {\vphantom {{{\varepsilon _{\rm{c}}}} {{\varepsilon _{\rm{p}}}}}} \right. \kern-\nulldelimiterspace} {{\varepsilon _{\rm{p}}}}} = 0.49 \quad .$$
(a) Relationship between ln θ and ε; (b) −∂(ln θ)/∂ε − ε versus ε plots for the Cu–Cr–Zr–Ag alloy at different temperatures under the strain rate of 0.01 s−1.

Relationships between: (a) σc and σp; (b) εc and εp.

For a constant initial grain size, the relationship between peak strains εp and Z parameter can be expressed as Reference Abbasi and Shokuhfar27 :
 $${\varepsilon _{\rm{p}}} = K{Z^m}\quad ,$$
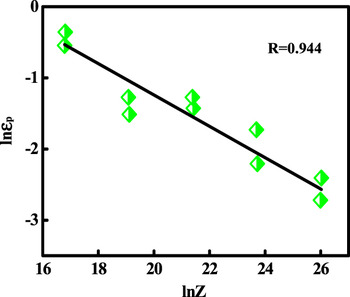
where K and m are material constants, dependent on the alloy composition. The relation between εp and Z is shown in Fig. 8. According to Fig. 8, the peak strain εp can be predicted using the following equation:
 $${\varepsilon _{\rm{p}}} = 23.7{Z^{ - 0.22}}\quad .$$
Relationship between the Z parameter and the peak strain.

According to Eq. (8), the relationship between the critical strain εc and the Z parameter can be expressed as:
 $${\varepsilon _{\rm{c}}} = 11.61{Z^{ - 0.22}}\quad .$$
D. Microstructure evolution
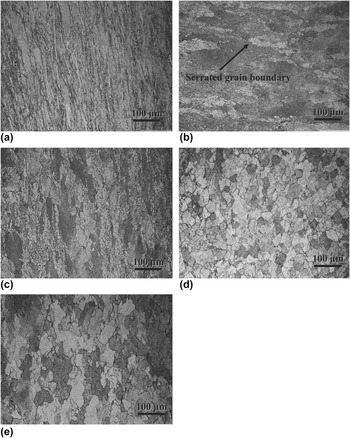
Optical images of the Cu–Cr–Zr–Ag alloy microstructure deformed at the strain rate of 0.01 s−1 and different deformation temperature are shown in Fig. 9. The original grains are elongated along the deformation direction when deformed at 650 °C, the average grain size is 20 μm according to Fig. 9(a). The serrated grain boundaries marked by the arrows were observed in Fig. 9(b). It was generally considered as the features of the early DRX stage. Reference Li, Feng, Yin, Shangguan, Wang, Liu and Hu28 With increasing the deformation temperature, a large number of new DRX grains were nucleated at the original grain boundaries in Fig. 9(c). The average grain size was determined to be about 18 μm. It also can be seen that the typical necklace structure around the initial grain boundaries is present in Fig. 9(c). The occurrence of necklace structure indicates that the grain boundary bulging through strain-induced grain boundary migration is the dominant nucleation mechanism of DRX. Reference Han, Wu, Zhang, Zou, Liu and Qiao25 According to Fig. 9(d), the original grains were replaced entirely by the new DRX grains when the deformation temperature reached 900 °C. This means that the full DRX has been achieved. The serrated grain boundaries were observed again in Fig. 9(e). The average DRX grain size of specimens deformed at 900 °C and 950 °C is 26 μm and 33 μm, respectively. Thus, there is obvious grain coarsening, demonstrating that the grain size increased with the deformation temperature. The reasons for such phenomenon are grain boundary migration and grain growth processes. According to the above analysis, it can be concluded that the evolution of DRX microstructure strongly depends on the deformation conditions (temperature and strain rate).
Optical images of the deformed microstructure of the hot compressed specimens at a strain rate of 0.01 s−1 and various temperatures: (a) 650 °C; (b) 750 °C; (c) 850 °C; (d) 900 °C and (e) 950 °C.

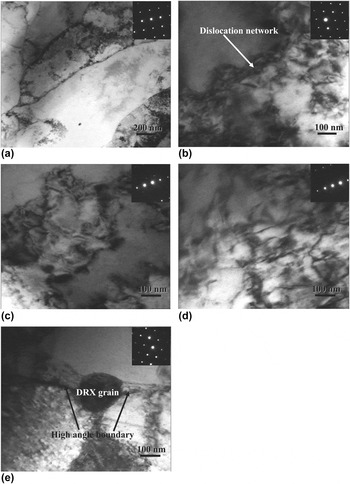
Figure 10 shows TEM micrographs of the Cu–Cr–Zr–Ag alloy deformed at different conditions. The banded structures were observed in Fig. 10(a) deformed at 650 °C and 0.01 s−1. Figure 10(b) shows that the dislocations are tangled and stored in the grains interior of the Cu–Cr–Zr–Ag alloy deformed at 750 °C with the 0.01 s−1 strain rate. The dislocation climb and cross-slip in low stacking fault energy alloy are difficult at low deformation temperature. Thus, the high density dislocations are intersected and tangled, forming the network structure, which makes dislocation slip more difficult. Reference Wen, Lin, Chen, Chen, Zhang, Li and Liang29 The increase of the number of dislocations is observed in Figs. 10(c) and 10(d) for the alloy deformed at 800 °C and 850 °C with the 0.1 s−1 strain rate. Compared with Fig. 10(b), the dislocation density is much higher in Figs. 10(c) and 10(d). According to the calculation from the selected area electron diffraction (SAED) patterns, the interplanar spacing in Fig. 10(d) is much higher than in Fig. 10(c). It also indicates that the dislocation density is much higher in Fig. 10(d). The rapid increase of the number of dislocations easily induces DRX once the dislocation density exceeds a critical value. Reference Guo, Yan, Chen and Zhang30 When the alloy deformed at 850 °C and 0.001 s−1, the nucleation of dynamically recrystallized grains appears at the high-angle grain boundaries marked by arrow in Fig. 10(e), which indicates the DRX occurrence. That is because the activation of dislocation movement accelerates the dislocation annihilation rate when the alloy is deformed at higher temperature.
TEM micrographs of the Cu–Cr–Zr–Ag alloy deformed at different deformation temperatures and strain rates: (a) 650 °C, 0.01 s−1; (b) 750 °C, 0.01 s−1; (c) 800 °C, 0.1 s−1; (d) 850 °C, 0.1 s−1; (e) 850 °C, 0.001 s−1.

IV. DISCUSSION
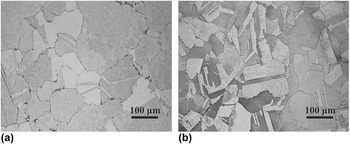
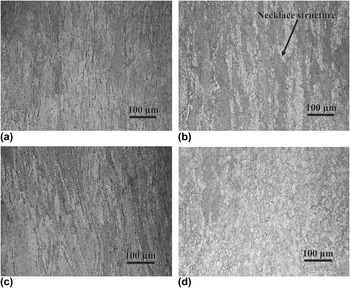
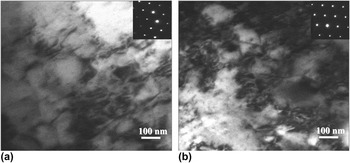
Figure 11(a) and 11(b) show the microstructure of the Cu–Cr–Zr and Cu–Cr–Zr–Ag alloys after solution treatment. Evidently, the addition of Ag can refine the grains of the base Cu–Cr–Zr alloy. The grain size of the Cu–Cr–Zr–Ag alloy is considerably smaller than the Cu–Cr–Zr alloy. The average grain size of the Cu–Cr–Zr and Cu–Cr–Zr–Ag alloys is approximately 69 μm and 58 μm, respectively. Grain refinement may be attributed to the enrichment of Ag atoms in front of the solid–liquid interface during solidification. To compare the microstructures of the Cu–Cr–Zr and Cu–Cr–Zr–Ag alloys during hot deformation, the deformation microstructures of the two alloys deformed at the strain rate of 0.001 s−1 and different temperatures are shown in Fig. 12, respectively. It can be seen that the elongated grains are found in Fig. 12(a), with a mean grain size of 31 μm. This means that the main softening mechanism is DRV for the Cu–Cr–Zr alloy deformed at 650 °C and 0.001 s−1. The elongated grains are also observed for the Cu–Cr–Zr–Ag alloy deformed at 650 °C and 0.001 s−1, as seen in Fig. 12(c). Compared with the Cu–Cr–Zr–Ag alloy deformed at the same conditions, the average grain size is 26 μm. When the deformation temperature increased to 850 °C at the same strain rate of 0.001 s−1, the original grains were elongated along the deformation direction and the average grain size was 16 μm, as seen in Fig. 12(b). Compared with the Figs. 12(a) and 12(b), some new fine DRX were found at the previous grain boundaries, so this structure is often called typical necklace-type structure by some researchers. Reference Semiatin, Weave, Kram, Fagin, Glavicic, Goetz, Frey and Antony31 This demonstrates that the DRX occurs at these deformation conditions. According to Fig. 12(d), large number of smaller and uniform DRX grains was obtained. Completed DRX for the Cu–Cr–Zr–Ag alloy is observed at the 850 °C deformation temperature and 0.001 s−1 strain rate. The minimal average grain size is achieved at these deformation conditions, which is about 11 μm. Compared with Figs. 12(b) and 12(d), the original grains were replaced completely by new fine DRX grains. This means that the addition of Ag can effectively refine the grain and improve dynamic recrystalization. The reasons for this is that the boundary areas can increase by the addition of Ag, and then the boundary movement and grain rotation can be promoted because of the fine recrystallized grains during the hot deformation. Reference Chen, Li and Kong32 Therefore, a mass of dislocations pile up during hot deformation. TEM micrographs of the Cu–Cr–Zr and Cu–Cr–Zr–Ag alloy deformed at different conditions are shown in Figs. 13(a) and 13(b), respectively. It can be seen that the dislocation density is increased by the addition of Ag, for the two alloy deformed at the same condition. Finally, the driving force of recrystallized nucleation was improved by high dislocation density.
Microstructure of (a) Cu–Cr–Zr and (b) Cu–Cr–Zr–Ag alloys after solution treatment at 900 °C for 1 h.

Microstructure of (a and b) Cu–Cr–Zr and (c and d) Cu–Cr–Zr–Ag alloys hot deformed at: (a) 650 °C and 0.001 s−1; (b) 850 °C and 0.001 s−1; (c) 650 °C and 0.001 s−1; (d) 850 °C and 0.001 s−1.

TEM micrographs of the (a) Cu–Cr–Zr and (b) Cu–Cr–Zr–Ag alloy deformed at 850 °C and 0.01 s−1.

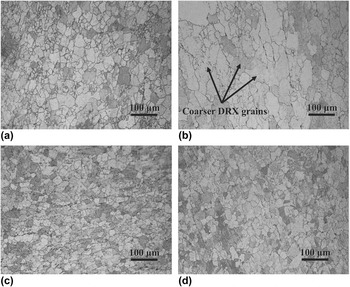
Completely formed DRX grains for the Cu–Cr–Zr alloy are shown in Fig. 14(a). The measured dynamically recrystallized grain size deformed at 950 °C and 1 s−1 is 26 μm. With the decreasing strain rate, a little coarser DRX grains with an average grain size of 32 μm are obtained in Fig. 14(b) compared with Fig. 14(a). Compared with the Cu–Cr–Zr–Ag alloy deformed at 950 °C and 1 s−1, much smaller DRX grains are observed in Fig. 14(c) with the mean grain size of 17 μm. The completely recrystallized uniform and fine grains are shown in Fig. 14(d). Moreover, the grain size changed slightly from 17 μm deformed at 950 °C and 1 s−1 [Fig. 14(c)] to 20 μm deformed at 950 °C and 0.1 s−1 [Fig. 14(d)]. The grain size was quite similar for these two conditions because of no further recrystallization, even at lower strain rate. At the same time, the grain size is also much smaller compared with Fig. 14(b). This indicates that the addition of Ag can inhibit the growth of the DRX grains at the deformation temperature of 950 °C. Ag has much better high temperature stability than Cu at high temperature. Thus, Ag is distributed at the grain subgrain boundary. It can fix dislocations at the grain boundaries and maintain high dislocation density. From the above analysis, the addition of Ag can refine the grain and improve dynamic recrystalization, and inhibit the growth of the DRX grains at very high deformation temperature. This is also very important for the alloy applications in industrial practice.
Microstructure of (a and b) Cu–Cr–Zr and (c and d) Cu–Cr–Zr–Ag alloys hot deformed at: (a) 950 °C and 1 s−1; (b) 950 °C and 0.1 s−1; (c) 950 °C and 1 s−1; (d) 950 °C and 0.1 s−1.

V. CONCLUSIONS
Hot deformation behavior of Cu–Cr–Zr–Ag alloy has been investigated at a temperature range of 650–950 °C and the strain rate range of 0.001–10 s−1. The following conclusions can be drawn:
-
(1) The flow stress increases with the strain rate and stress decreases with the deformation temperature.
-
(2) The activation energy of deformation was calculated to be Q = 343.23 kJ/mol by the regression analysis. The constitutive equation for the flow stress can be expressed as:
 $\dot \varepsilon = {{\rm{e}}^{35.82}}{\left[ {\sinh \left( {0.012\sigma } \right)} \right]^{7.62}}\exp \left( { - {{343.23} \over {RT}}} \right)$
.
-
(3) The critical strain related to the onset of DRX decreases with deformation temperature. The critical ratios of σc/σp and εc/εp are identified as 0.91 and 0.49, respectively. The relation between εp, εc and Z were derived as: εp = 23.7Z −0.22, εc = 11.61Z −0.22, respectively.
-
(4) The evolution of DRX microstructure strongly depends on the deformation conditions (temperature and strain rate). The deformation temperature increase and the strain rate decrease can promote DRX of the Cu–Cr–Zr–Ag alloy.
-
(5) The addition of Ag can refine the grain and effectively accelerate dynamic recrystalization. It can also inhibit the growth of the DRX grains at the deformation temperature of 950 °C.

ACKNOWLEDGMENTS
This work was supported by the National Natural Science Foundation of China (51101052) and the National Science Foundation (IRES 1358088).