INTRODUCTION
Polygonal terrain underlain by ice wedges are a widespread feature in continuous permafrost and make up 20–80%vol of the ground ice in the upper few meters of permafrost (Pollard and French, Reference Pollard and French1980; French, Reference French2013; Ulrich et al., Reference Ulrich, Grosse, Strauss and Schirrmeister2014). The development of ice wedges is initiated when the tensile strength threshold of the frozen soils is exceeded and a near-vertical crack forms (Lachenbruch, Reference Lachenbruch1962). The thermal contraction of the upper icy permafrost usually occurs following a rapid decrease in air temperature in early- to mid-winter (Christiansen, Reference Christiansen2005; Fortier and Allard, Reference Fortier and Allard2005; Plug and Werner, Reference Plug and Werner2008); however, it is the icy permafrost that must experience the rapid cooling rate to induce cracking (French, Reference French2013). As such, local factors such as snow cover, vegetation, and sediment characteristics also influence cracking intensity and frequency (e.g., MacKay, Reference Mackay2000). Following the formation of a frost crack, it can infill by condensation or deposition of various moisture sources: water vapor, snow, or snow meltwater (Shumskii, Reference Shumskii1964; Mackay, Reference Mackay1992; Lauriol et al., Reference Lauriol, Duchesne and Clark1995; French and Guglielmin, Reference French and Guglielmin2000; St-Jean et al., Reference St-Jean, Lauriol, Clark, Lacelle and Zdanowicz2011; Boereboom et al., Reference Boereboom, Samyn, Meyer and Tison2013). Studies show that ice wedges can grow for thousands of years (e.g., Meyer et al., 2010, Reference Meyer, Opel, Laepple, Dereviagin, Hoffmann and Werner2015); however, the frequency of thermal-contraction cracking and subsequent infill can be highly variable (from annual to centuries) due to changing climate and surface conditions that would affect winter ground temperatures (Harry et al., Reference Harry, French and Pollard1985; Mackay, Reference Mackay1989).
Despite the numerous studies examining factors that control ice-wedge cracking, their development, and degradation, relatively few have explored ice-wedge activity in relation to past climate and vegetation conditions (e.g., Burn, Reference Burn1990; Vasil’chuk et al., Reference Vasil’chuk, Papesch, Rank, Sulerzhitsky, Vasil’chuk, Budantseva and Chizhova2005; Vasil’chuk, Reference Vasil’chuk2013; Opel et al., 2017). Here, we investigate the formation and timing of ice-wedge development on the Blackstone Plateau (Ogilvie Mountains, central Yukon, Canada) following the discovery of a series of ice wedges exposed in the headwall of a retrogressive thaw slump along the shore of Two Moose Lake. This objective is reached by: (1) describing the cryostratigraphy of sedimentary units exposed in the headwall of the slump (an approach that emphasizes the quantification of ground ice content and the identification of unconformities in permafrost); (2) determining the deposition history of the icy sediments by measuring their physical properties (grain-size distribution, moisture, organic matter, and carbonate contents) and δD-δ18O composition; (3) determining the moisture source of the ice wedges from measurements of δD-δ18O of the ice; and (4) determining the age of the ice wedges from 14C measurements of the dissolved organic carbon. Together, the results allow reconstructing ice-wedge activity over the past 35,000 yr and illustrate the relevance of permafrost archives such as ice wedges for reconstructing permafrost and glacial history.
STUDY AREA
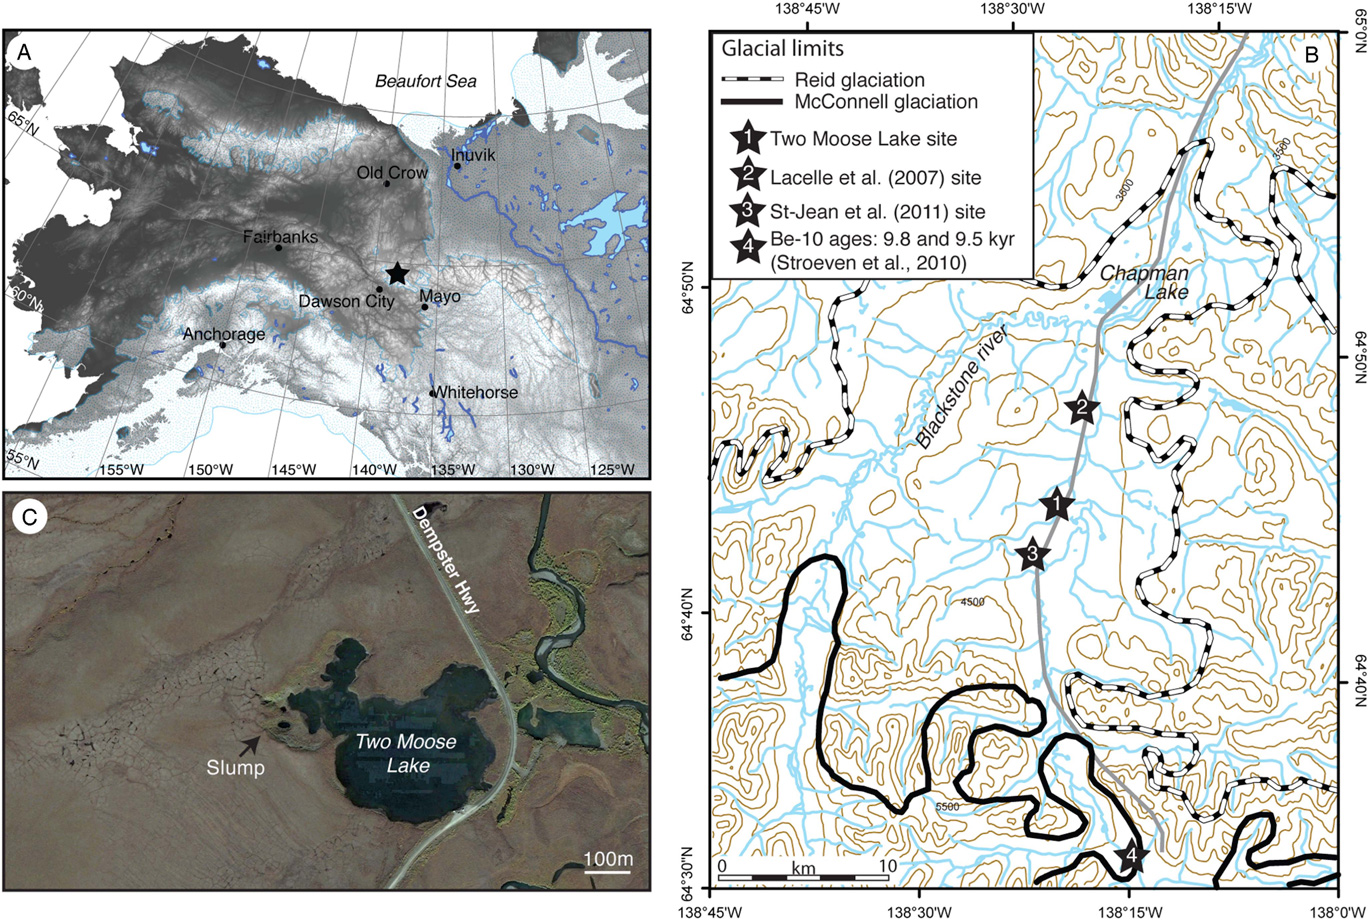
Two Moose Lake (64°44.1′N, 138°21.9′W, 1085 m asl) is a thermokarst lake situated on the Blackstone Plateau of the Ogilvie Mountains, central Yukon (Fig. 1). In summer 2013, a thaw slump was observed along the southwestern shore of the lake. The headwall of the slump exposed nine ice wedges that developed at two distinct depths in icy permafrost. By the end of summer 2015, the slump had stabilized and vegetation began to re-colonize the slump floor. Evidence of slump scars adjacent to the active slump indicated that slumps are a recurring feature along the lake shore.
(color online) (A) Map of Alaska and western Arctic Canada showing location of Two Moose Lake, Yukon (star), and other sites mentioned in text. The underlying topography is from GTOPO30 digital elevation data (https://lta.cr.usgs.gov/). (B) Map showing location of the Two Moose Lake on the Blackstone Plateau (central Yukon, Canada), the glacial limits (from Duk-Rodkin, 1996) and sites mentioned in text. (C) High-resolution satellite imagery of Two Moose Lake and thaw slump (image courtesy of DigitalGlobe Foundation).

The Blackstone Plateau has a hummocky moraine morphology dotted by numerous lakes, Chapman Lake being the largest. The plateau consists of Palaeozoic metasedimentary, ultramafic, and sedimentary rocks and is intruded by Cretaceous porphyritic syenite (Green, Reference Green1972). With heights up to 2500 m asl., the intrusive rocks form the highest peaks in the area. The study area was glaciated several times during the Pleistocene by the Cordilleran Ice Sheet and by local alpine glaciers (Vernon and Hughes, Reference Vernon and Hughes1966; Duk-Rodkin et al., Reference Duk-Rodkin, Barendregt, Froese, Weber, Enkin, Rod Smith, Zazula, Waters and Klassen2004; Lacelle et al., Reference Lacelle, Lauriol, Clark, Cardyn and Zdanowicz2007). Much of the glacial chronology, however, is based on soil development, relative weathering, and stratigraphic position of moraines, with few absolute dating results. According to Tarnocai (Reference Tarnocai1987), Hughes et al. (Reference Hughes, Rutter and Clague1989), and Duk-Rodkin et al. (Reference Duk-Rodkin, Barendregt, Tarnocai and Phillips1996), the ice that covered the Blackstone Plateau is correlated to the Reid glaciation, dated to Marine Oxygen Isotope Stage 4 (Briner et al., Reference Briner, Kaufman, Manley, Finkel and Caffee2005). The late Wisconsinan McConnell glaciation apparently did not reach the Chapman Lake moraine complex (Fig. 1); the ice margin was mapped ca. 15 km south of it and cosmogenic 10Be ages from boulders along the moraine in North Fork Pass yielded minimum surface exposure ages near 10,000 yr BP (Stroeven et al., Reference Stroeven, Fabel, Codilean, Kleman, Clague, Miguens-Rodriguez and Xu2010). The surficial sediments on the Blackstone Plateau reflect the regional glacial and fluvial history, with unconsolidated glacial till occupying much of the lower-lying area and alluvial deposits occupying present and former river valleys (Vernon and Hughes, Reference Vernon and Hughes1966). The unglaciated highlands are covered by colluvium, composed of carbonates, chert, and shale.
The study area is located in the continental subarctic climate zone characterized by short cool summers and long cold winters. Regional climate conditions are inferred from the nearby Dawson (1981–2010; 370 m asl) and Mayo (1981–2010; 503 m asl) meteorological stations, which report mean annual air temperature of −2.4 and −4.1°C, respectively (Canada, Reference Canada2010). Considering that the Blackstone Plateau is situated at much higher elevation, the environmental lapse rate suggests that the mean annual air temperatures in the study area are likely in the −6 to −8°C range. Total annual precipitation received at Dawson and Mayo ranges from 300 to 500 mm/ yr and is mostly of orographic origin. The vegetation consists of dwarf birch, stunted black spruce, and scattered willows in the lowlands, while the uplands are occupied by tundra (Green, Reference Green1972). These climate and vegetation conditions ensure that the Blackstone Plateau is located in the continuous permafrost zone with permafrost thickness reaching depths of 120 m (Green, Reference Green1972; Kojima, Reference Kojima1996). The thickness of the active layer ranges from 0.5 to 1 m on mineral soil, but is much shallower in places covered by an organic layer (Burn et al., Reference Burn, Michel and Smith1986). Geomorphic features associated with the presence of permafrost include solifluction lobes along hillslopes, polygonal terrain underlain by ice wedges along the valley floor, and thaw slumps along the shoreline of lakes and road cuts.
In Arctic regions, 30 sites have historical monthly δD and δ18O composition of precipitation (IAEA/WMO, 2015). Mayo is the closest station to the study region and reports amount weighted mean annual δ18O composition of −21.1±4.5‰ (1985–1989); winter precipitation has mean δ18O value of −24.9±1.8‰. Closer to our study site, Baranova (2017) sampled rain and snow in the Ogilvie Mountains (600 m asl; ca. 70 km north of the Two Moose Lake). The mean annual δ18O composition of precipitation (2014–2015) was similar to that at Mayo (−22.3±5.5‰); however, the snow had a much lower composition (−27.1±1.3‰).
METHODOLOGIES
Field sampling
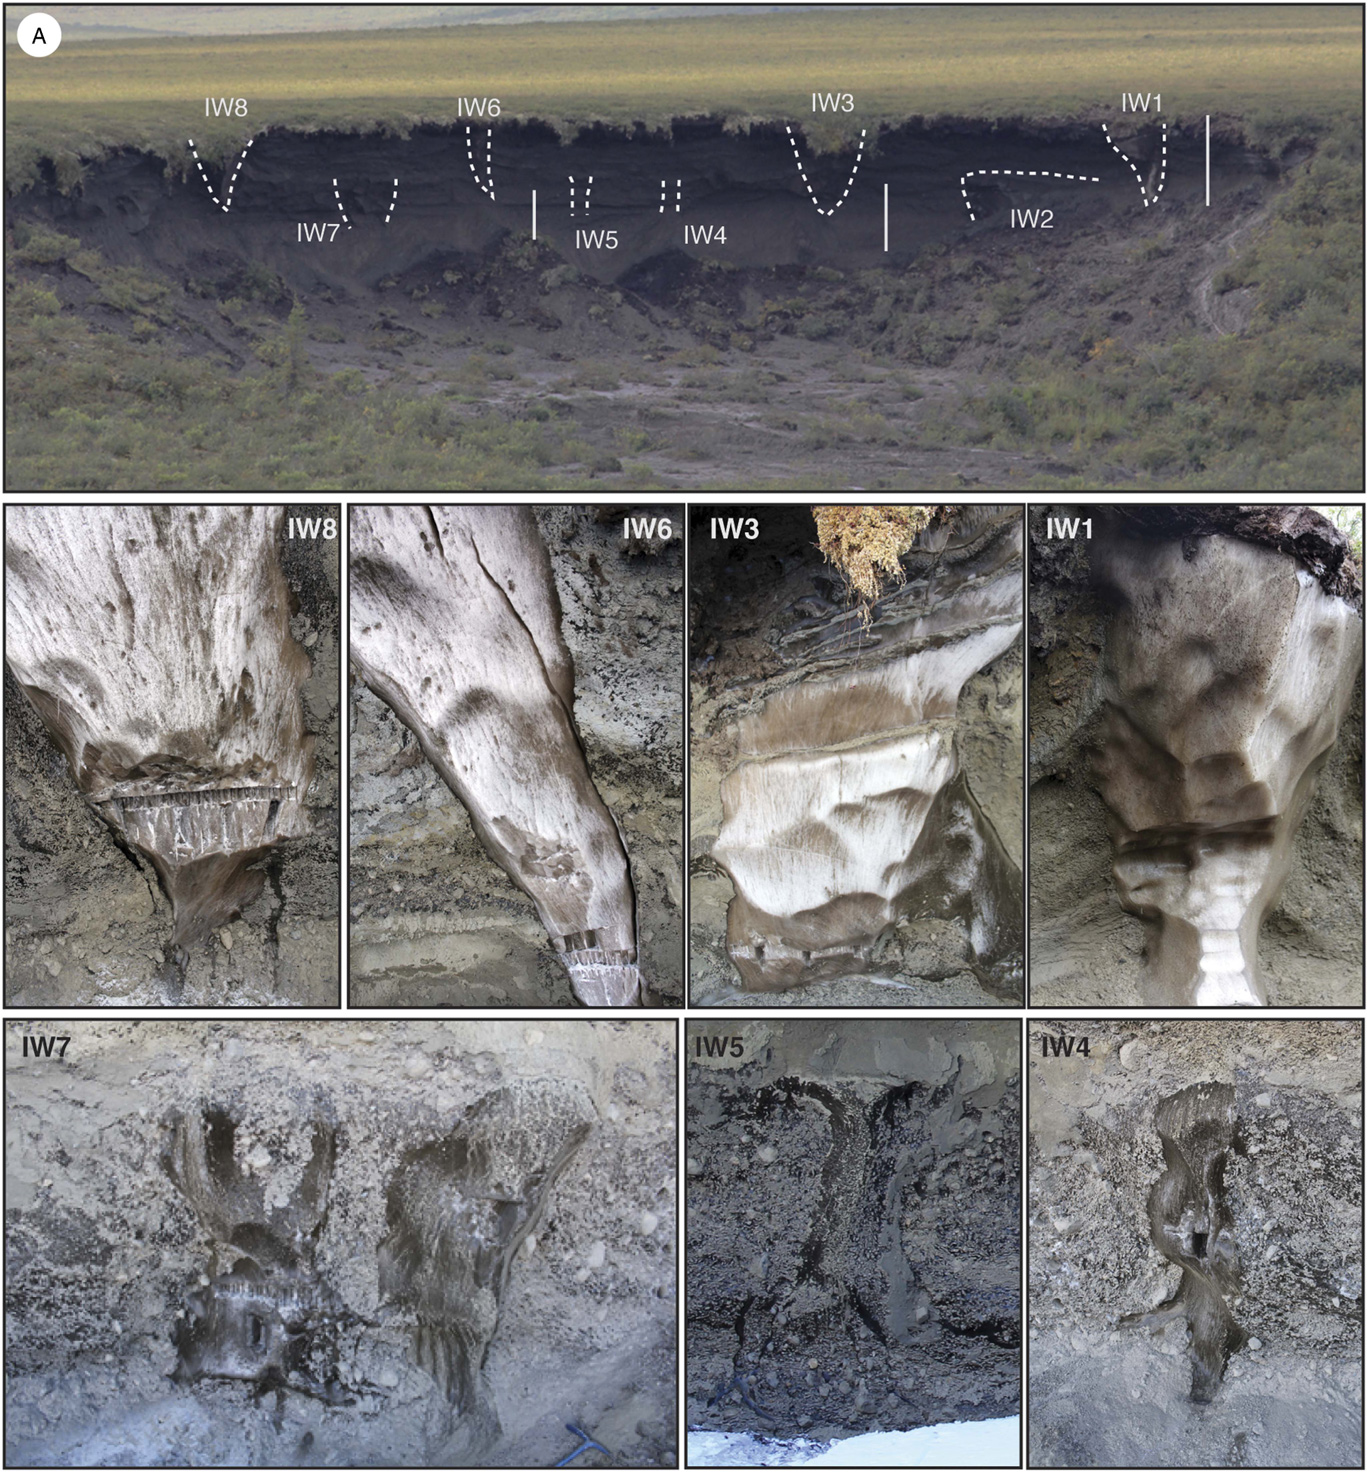
Fieldwork at the Two Moose Lake thaw slump was conducted in July 2013 and April 2014. Active layer and icy permafrost samples were collected where possible along the headwall and samples were grouped to make a composite profile (Fig. 2 and 3). Seven ice wedges were also sampled horizontally, four of which were truncated at the base of the modern active layer (IW1, IW3, IW6, and IW8), and three that were truncated at ~3.15 m depth (IW4, IW5, and IW7; Fig. 2). Additionally, large ice blocks (ca. 0.2 to 0.3 m3) were cut from the ice wedges using an oil-free chainsaw for radiocarbon analyses. Each ice block was handle with sterile nitrile gloves and its surface cleaned by scrapping to remove possible organic contaminants. Some of the ice blocks were melted in the field in polyethylene bags and the meltwater transferred into pre-cleaned and sterilized 500-mL and 1-L containers with no headspace; others were wrapped in aluminum foil and kept frozen in a cooler.
(color online) Photographs showing (A) ice wedges exposed at two distinct depths in headwall of thaw slump and (B–H) a close-up of each ice wedge, Two Moose Lake, central Yukon, Canada. Vertical bars in (A) represent sampling locations of icy permafrost.

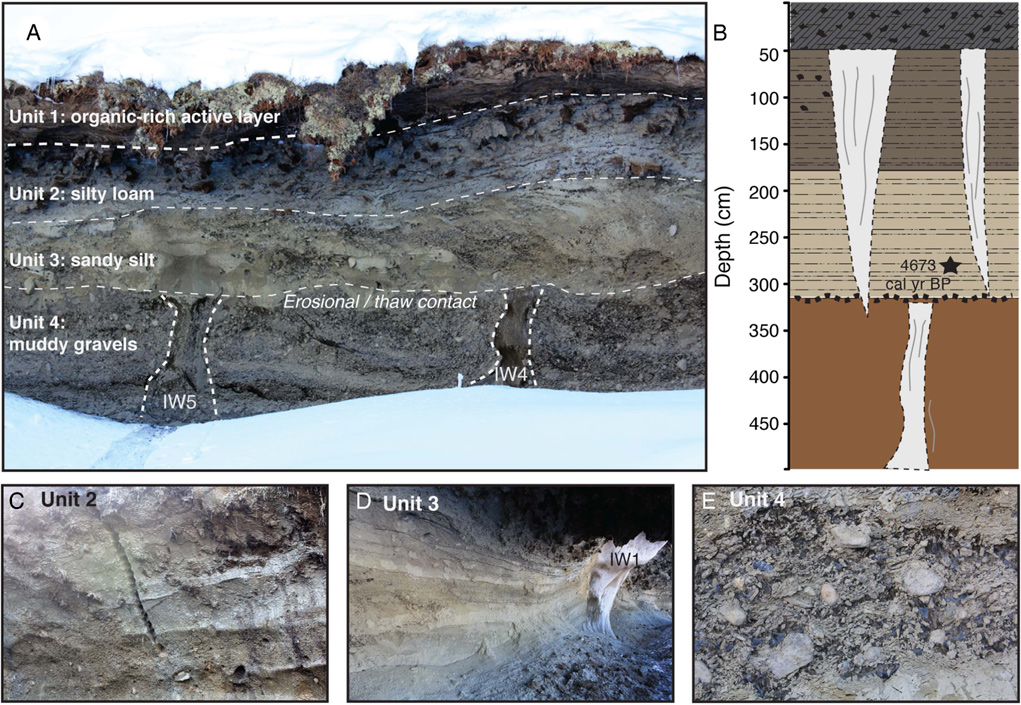
(color online) (A) Photograph and (B) sketch of exposed units in headwall of thaw slump along Two Moose Lake, central Yukon, Canada. Age in unit 3 was obtained from a site 5 km south of Two Moose Lake (St-Jean et al., Reference St-Jean, Lauriol, Clark, Lacelle and Zdanowicz2011). (C–E) Photographs showing close-up of each unit exposed in headwall.

Sediment properties
Laboratory analyses were conducted on the soils in the active layer and icy permafrost to determine: (1) grain-size distribution; (2) gravimetric water content; and (3) contents of organic matter and carbonates. The grain-size distribution was determined using a Microtrac S3500 laser particle-size analyzer (sediments finer than coarse sand, <0.5 mm) and by dry-sieving (sediments >0.5 mm). Grain size distribution graphs were made by classifying the sediments into three dominant particle sizes: gravel (≥2 mm), sand (<2 to≥0.0625 mm), silt (<62.5 to≥4 μm) and clay (<4 μm).
The gravimetric water content (GWC) was determined as (Van Everdingen, Reference Van Everdingen2005):
 $${\rm GWC} \,\left( \,\%\, \right)\, {\equals}\,{{{\rm mass }\,{\rm of}\,{\rm water}} \over {DW105}}\,{\times} 100$$
where DW105 represents the weight of a subsample dried at 105°C for 24hr.
The organic matter and carbonate contents were determined gravimetrically by loss-on-ignition analysis using a muffle furnace (Heiri et al., Reference Heiri, Lotter and Lemcke2001). The organic matter content was calculated using the following equation:
 $${\rm Organic}\,{\rm matter}\,{\rm content}\,\left( \,\%\, \right)\, {\equals}\,{{\left( {{\rm DW}105{\minus}{\rm DW}550} \right)} \over {DW105}}\,{\times} 100$$
where DW550 is the weight of the sample after combustion at 550°C for 4h.
The carbonate content was determined by heating the sample at 950°C for 3 h and calculated using the following equation:
 $${\rm Carbonate}\,\,{\rm content}\,\left( {\rm \,\%\,} \right)\,{\equals}\,{{\left( {{\rm DW}550{\minus}{\rm DW}950} \right)} \over {DW105}}\,{\times}\,1.36\,{\times}\,100$$
where DW950 represents the weight after heating at 950°C for 4h and the constant 1.36 represents the ratio between the molecular weights of carbonate (CO3; 60 g/mol) and evolved CO2 (44 g/mol; Bengtsson and Enell, Reference Bengtsson and Enell1986).
Stable water isotopes of icy permafrost and ice wedges
Melted and filtered (0.45 μm diameter filter) samples of ground ice in the host permafrost and ice wedge were analyzed for stable isotope ratios of oxygen (18O/16O) and hydrogen (D/H) since they provide insights into formation process of the ice (i.e., Lacelle, Reference Lacelle2011). The 18O/16O and D/H ratios were determined using a Los Gatos Research (LGR) high-precision liquid water isotope analyzer coupled to a CTC LC-PAL autosampler for simultaneous 18O/16O and D/H ratios measurements. Following analysis, all measured water samples were verified for spectral contaminants in the samples using the LGR spectral interference contamination identifier software (Lis et al., Reference Lis, Wassenaar and Hendry2008). The results are presented using the δ-notation (δ18O and δD), where δ represents the parts per thousand differences for 18O/16O or D/H in a sample with respect to Vienna Standard Mean Ocean Water. Analytical reproducibility for δ18O and δD was ± 0.3‰ and ± 1‰, respectively.
Radiocarbon measurements of ice wedges
Radiocarbon analysis of ice wedges has been conventionally undertaken using particulate organic carbon (POC) material above the ice wedge (e.g., Lauriol et al., Reference Lauriol, Duchesne and Clark1995; Meyer et al., Reference Meyer, Opel, Laepple, Dereviagin, Hoffmann and Werner2015; Kotler and Burn, Reference Kotler and Burn2000) or enclosed in the ice wedge (e.g., Vasil’chuk et al., 2000, 2004, Reference Vasil’chuk, Zaitsev and Vasil’chuk2006; Vasil’chuk and Vasil’chuk, Reference Vasil’chuk and Vasil’chuk2017). Lachniet et al. (Reference Lachniet, Lawson and Sloat2012) demonstrated that making radiocarbon measurements on the dissolved inorganic carbon (DIC) and dissolved organic carbon (DOC) fraction greatly reduced the potential contamination of older POC in the ice wedge, providing a more representative age of ice-wedge formation. We measured 14CDOC of ice wedge samples since there is the possibility of (1) exchange/absorption of CO2 with the DIC in the ice after the formation of the ice wedge; (2) dissolution or exchange of DIC with carbonate particulates; and (3) exchange with atmospheric CO2 during melting of the ice, all of which may introduce younger or older DIC into the sample (Lachniet et al., Reference Lachniet, Lawson and Sloat2012). In total, six ice wedges were analyzed for 14CDOC measurements: IW4 was only sampled along the center of the ice wedge, whereas the others (IW2, IW3, IW6, IW7, and IW8) were sampled along the center and edges (Fig. 2).
The DOC concentration was first obtained to determine the volume of water required for 14CDOC analysis (~1.0 mg of C). The DOC concentration was determined on a TIC-TOC analyzer model OI-1010 interfaced to a Finnigan Mat Delta+ isotope ratio mass spectrometer at the G.G. Hatch Laboratory (University of Ottawa, Canada) by wet oxidation with sodium persulfate (analytical precision is ±2%) as described by St-Jean (Reference St-Jean2003). For 14CDOC analysis, the required volume of water was transferred into pre-cleaned (10% HCl), pre-heated (500˚C for 3 h) round-bottom borosilicate Wheaton reaction bottles capped with a butyl septum. The DIC fraction was converted to CO2 with 85% phosphoric acid and partitioned into an added helium headspace for extraction and cryogenic purification. The DOC fraction was then extracted as CO2 following wet oxidation and cryogenically purified (Zhou et al., Reference Zhou, Guo, Lu, Mao, Zheng and Wang2015; Lang et al., Reference Lang, McIntyre, Bernasconi, Früh-Green, Voss, Eglinton and Wacker2016). Sample CO2 was graphitized by reduction with H2 on treated zero-valence iron powder (St-Jean et al., Reference St-Jean, Kieser, Crann and Murseli2017), pressed as a Cs sputter source target and analyzed on a 3MV tandem accelerator mass spectrometer at the A.E. Lalonde Accelerator Mass Spectrometry (AMS) Laboratory (University of Ottawa, Canada). The 14C/12C ratios are expressed as fraction of modern carbon (F14C) corrected for spectrometer and preparation fractionation using the AMS-measured 13C/12C ratio (Crann et al., Reference Crann, Murseli, St-Jean, Zhao, Clark and Kieser2017). Radiocarbon ages are calculated as –8033ln (F14C) and reported in 14C yr before present (BP=AD 1950; Stuiver and Polach, Reference Stuiver and Polach1977) and then corrected to calendar years (cal yr BP) using OxCal v4.2.4 and the IntCal13 calibration curve (Bronk Ramsey, Reference Bronk Ramsey2009; Reimer et al., Reference Reimer, Bard, Bayliss, Beck, Blackwell, Ramsey and Buck2013). The median calibrated age is reported in the text with the 2-sigma range provided in Table 1.
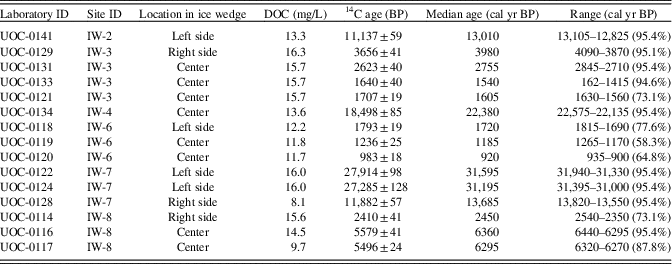
Radiocarbon results from ice wedges exposed in headwall of thaw slump along Two Moose Lake, central Yukon (see Figure 2 for location of ice wedges exposed in headwall).

RESULTS
Stratigraphy of exposed headwall
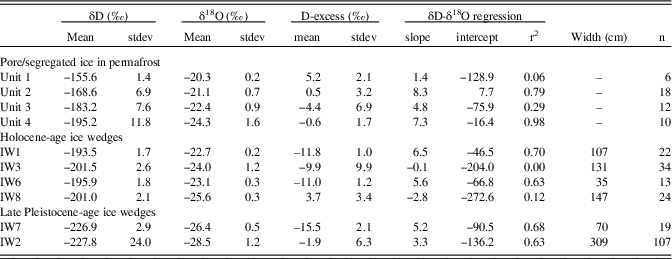
The headwall of the thaw slump exposed a 60-m-wide and ca. 4–7-m-high section of icy permafrost and overlying active layer; the base of the exposure was covered by slumped debris. Based on observations of the headwall, four stratigraphic units were delineated (Fig. 3). All units extended horizontally across the extent of the headwall, with relatively uniform thicknesses. Below we first describe the sediment and ground ice characteristics of each unit, followed by the 14CDOC ages and δD-δ18O composition of the ice wedges. Table 2 provides the descriptive statistics of the δD-δ18O composition of the ground ice in the permafrost and ice wedges.
Summary statistics of water isotope composition of pore/segregated ice in permafrost and ice wedges.

Unit 1 (0–0.5 m): the organic-rich soils in the active layer
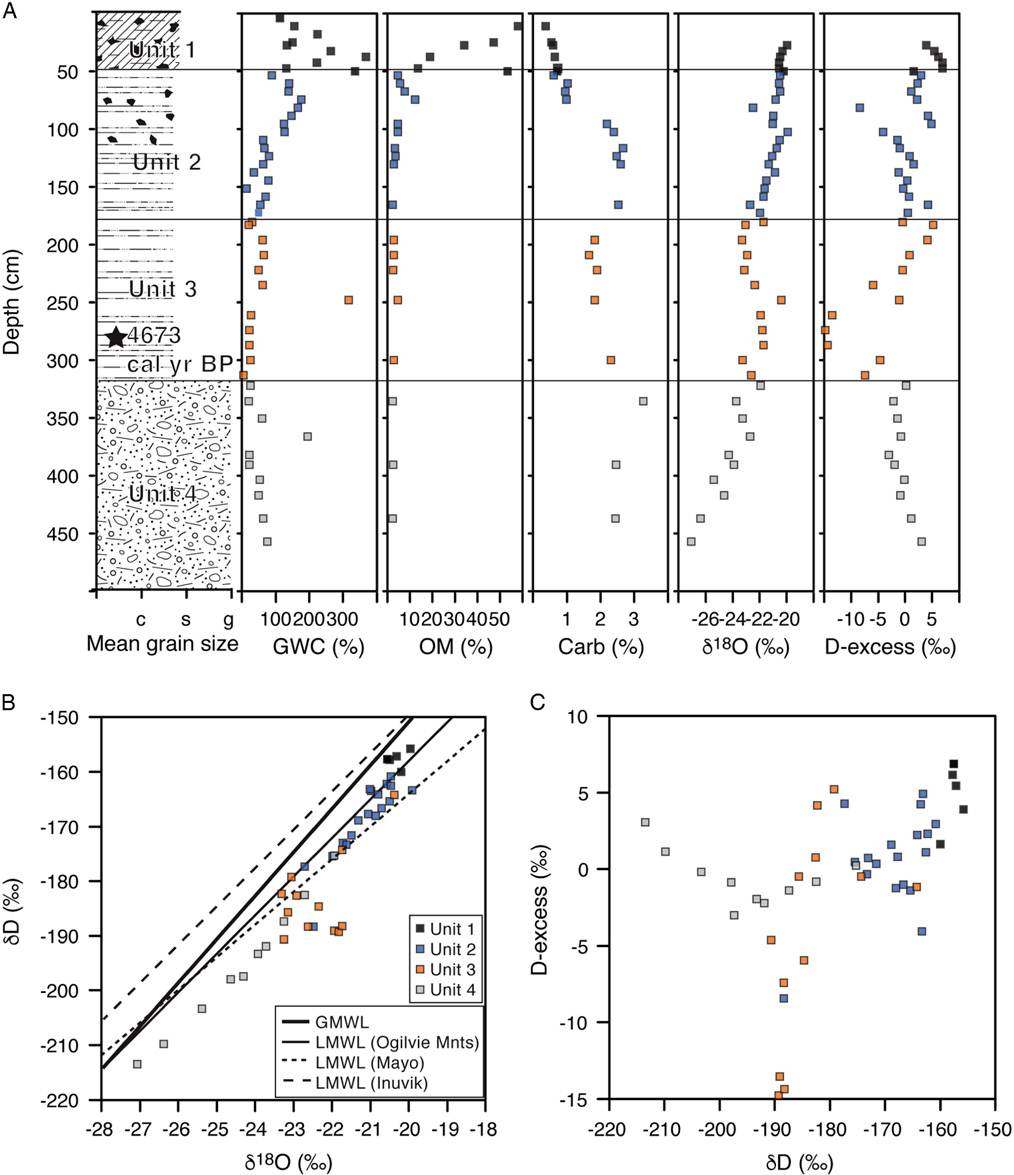
Based on the position of the top of ice wedges, the active layer (Unit 1) reached 0.5 m depth: at the time of sampling in July 2013, it was composed of a thawed layer (0–0.25 m) and a layer of seasonally frozen soils (0.25–0.5 m), both with high predominance of rootlets and macrofossils. The GWC ranged from 10–370%, with the organic matter content ranging from 55% at the surface and progressively decreasing to 13% at 0.5 m depth (Fig. 4A). The carbonate content was low, ranging from 0.5 to 1%. The δ18O composition of the pore/segregated ice in the 0.25 to 0.5 m section was very constant, averaging −20.4±0.2‰ (ranging from −20.6 to −19.9‰), with D-excess averaging 5.1±2.1‰. The δD-δ18O values showed no correlation (δD=1.4 δ18O - 128; R 2=0.06; n=6) due to the high degree of clustering of the data (Fig. 4B).
(color online) Composite profile of active layer and icy permafrost at Two Moose Lake, central Yukon, Canada. (A) Mean grain size, gravimetric water content (GWC), organic matter content (OM), carbonate content (Carb), δ18O, and D-excess of pore/segregated ice in the four stratigraphic units. (B) δD-δ18O composition of the pore/segregated ice in the permafrost. (C) D-excess - δD composition of the pore-segregated ice in the permafrost. GMWL, global meteoric water line (δD=δ18O +10; Dansgaard, Reference Dansgaard1964); LMWL, local meteoric water line: Ogilvie Mountains (δD=6.8 δ18O - 24.49; Baranova, Reference Baranova2017), Mayo (δD=6.3 δ18O - 36.86; IAEA/WMO, 2015), Inuvik (δD=7.3 δ18O - 3.37; IAEA/WMO, 2015).

Unit 2 (0.5–1.75 m): the frozen silt loam with organics
Unit 2 had a greyish color and was composed mainly of coarse silt. The visible cryostructures consisted of pore ice, lenticular ice, and ice vein (Fig. 3B). The GWC progressively decreased from 200 to 80%. The organic matter content decreased from 5–12% in the upper part of the unit (consisting of a mixture of peat, rootlets, and other organic material) to 3–5% in the lower part (Fig. 4A). The carbonate content increased from 1% in the upper portion to 3% in the lower portion of the unit. These characteristics define the unit as frozen silty loam with organics. The δ18O composition of the pore/segregated ice generally decreased with depth from −20.5 to −22.7‰ (average of -21.1±0.7‰), with D-excess averaging 0.5±3.2‰. The δD-δ18O values also plotted along a regression slope value of 8.3 (δD=8.3 δ18O + 7.7; R 2=0.79; n=18; Fig. 4B).
Unit 3 (1.75–3.15 m): the frozen sandy silt
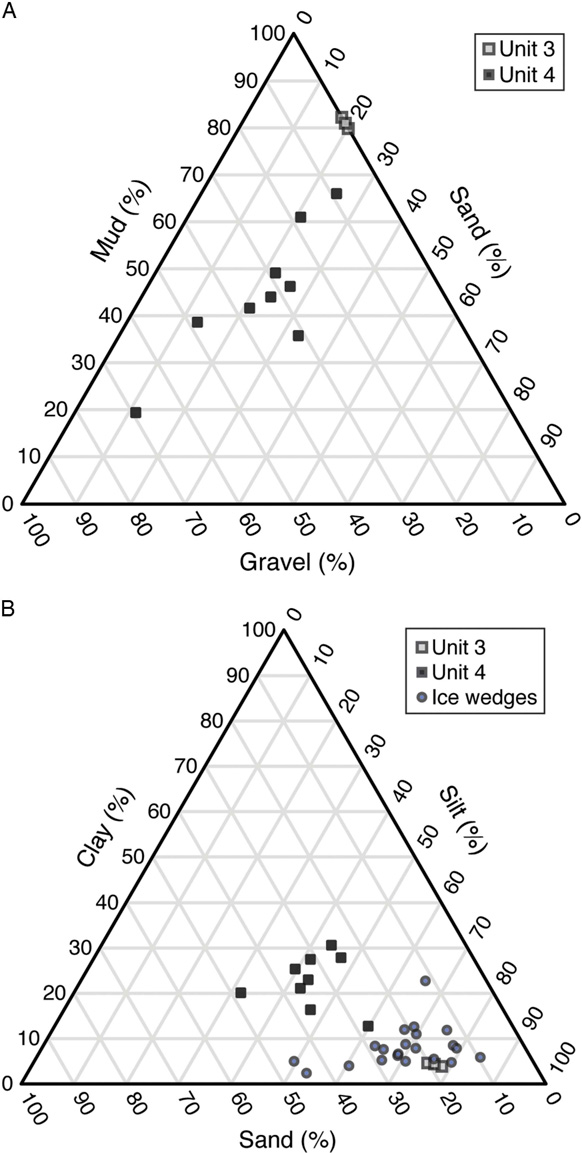
Unit 3 was distinguished from the other units by its light-brown color (Fig. 3C). Grain-size distribution (n=4) showed that the sediments were a coarse silt (>75%; dominant mode at 40 μm), with sand (<20%) and clay (<5%; Fig. 5). Visible cryostructures included pore ice and mm-thick lenticular ice (Fig. 3C). The GWC generally decreased from 65 to 5%; however, one sample produced a GWC of 315% as it likely intersected an ice vein (Fig. 4A). The organic matter content was near 3%, lower than in Unit 1 and upper part of Unit 2; however, the carbonate content near 2% was higher than in the units above. The δ18O composition of the pore/segregated ice ranged from −23.3 to -20.3‰ (average of −22.4±0.8‰), with D-excess averaging −4.4±6.9‰. The δD-δ18O values plotted along a regression slope value of 4.8 (δD=4.8 δ18O - 75.9; R 2=0.29; n=11; Fig. 4B).
Particle-size distribution of sediments in permafrost and in the ice wedges, Two Moose Lake central Yukon, Canada. (A and B) Ternary diagram showing mud-sand-gravel and clay-silt-sand content, respectively.

Unit 4 (>3.15m): the frozen muddy gravels
Unit 4 was > 0.75-m thick and consisted of a mixture of coarse sediments and ice (Fig. 3D and E). Grain-size distribution showed that the sediments were poorly sorted muddy gravels (gravel ranging from 9 to 69% with a large variation in their size, sand ranging from 11 to 33%, and fines ranging from to 19 to 65%; Fig. 5). The sediment pore space was saturated with ice, often in excess as an ice-supported matrix (Fig. 3D and E). The GWC ranged from 20 to 200% with no vertical trend (Fig. 4A). This unit contained the lowest organic matter content (2–3%) and highest carbonate content (2.5–3%). The δ18O composition of the pore/segregated ice averaged −23.4±1.6‰, decreasing from −22.3‰ at the upper contact to −27.1‰ at the lower contact. The D-excess averaged −3.2±4.4‰, and the δD-δ18O values were distributed along a regression slope value of 7.3 (δD=7.3 δ18O - 16.4; R 2=0.98; n=22; Fig. 4B).
The ice wedges
The predominant feature exposed in the headwall were ice wedges that developed at two distinct depths (Fig. 2). The first set (n=5) started at the top of permafrost (0.5 m) and extended into the icy muddy gravels (unit 4). These ice wedges measured 1 to 3 m wide at their top and were almost 4 m deep. The icy soils along the edge of the ice wedges were upturned along their margins, sometimes as much as 45°. The ice had a whitish appearance and contained near-vertical laminations defined by color. Sediment content in these ice wedges was <2%vol, consisting mainly of fines (55–90%), and organic matter content was <3%.
The second set of ice wedges (n=4) was found solely in the icy muddy gravels (unit 4). The top of these ice wedges was narrower than those above (<2 m wide) and coincided with the sharp contact between units 3 and 4, suggesting that this contact is an erosional surface or thaw unconformity. The depth of these lower ice wedges is unknown, as unit 4 was covered by slumped debris. Similar to the set of ice wedges in the units above, the sediments along the edge of the ice wedges were upturned. However, the four lower ice wedges had a much darker color due to the higher sediment content (3–5%vol). The sediments in the ice wedges consisted mainly of fines (~87%) and organic matter content was <3%.
Radiocarbon ages
The fifteen 14CDOC ages from six ice wedges clustered in two different groups, corresponding to the two sets of ice wedges found at separate depths (Table 1). The ice wedges in the upper units all yielded mid to late Holocene ages (6360 to 920 cal yr BP; n=10), with a cluster of ages between 3980 and 920 cal yr BP; whereas those situated in unit 4 all yielded late Pleistocene ages (31,595 to 13,010 cal yr BP; n=5), with clusters of ages between 31,595–31,195 and 13,685–13,010 cal yr BP.
The age distribution in ice wedges that were sampled in their center and edge generally followed the theory of ice-wedge cracking and growth, with younger age ice near the center (Table 1). However, the widest ice wedge, ice wedge IW8, provided an age of 6360 cal yr BP in its center while an age of 2450 cal yr BP was obtained near its right side. Ice wedge 7 also suggests some asymmetry in cracking with ages near 31,500 cal yr BP on its left side and of 13,685 cal yr BP its right side.
Stable water isotope composition
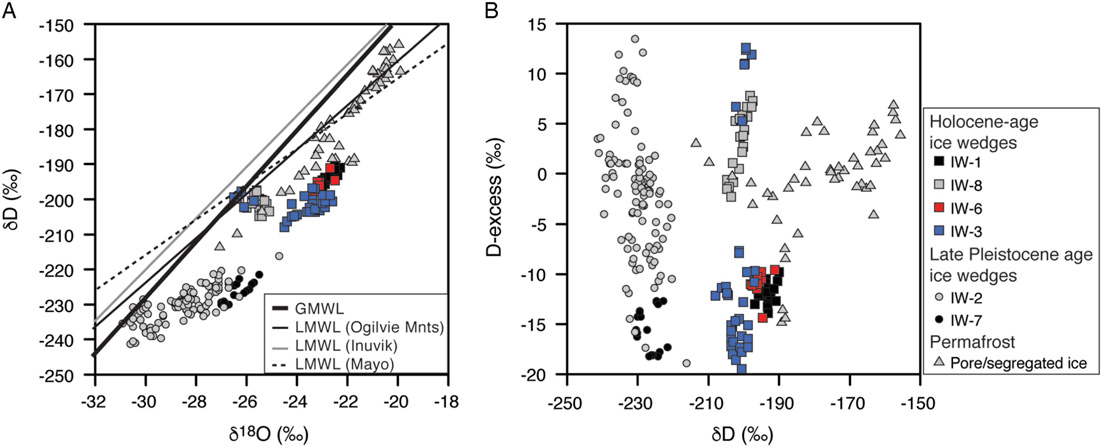
The δ18O composition of the Holocene (n=4) and late Pleistocene (n=2) ice wedges clustered in two distinct groups, with the late Pleistocene ones having lower values (Fig. 6). The four Holocene-age ice wedges (IW1, IW3, IW6, and IW8) have average δ18O values of −22.7±0.2‰, −24.0±1.2‰, −23.1±0.3‰, and −25.6±0.3‰, respectively. These values are l to 4‰ lower than the pore/segregated ice in units 2 and 3 that hosts them (average of −21.1±0.7‰ and −22.4±0.8‰, respectively). The two late Pleistocene-age ice wedges (IW2 and IW7) have average δ18O values of −28.5±1.2‰ and −26.4±0.5‰, respectively. These values are 3 to 5‰ lower than the pore/segregated ice in unit 4 that contains these ice wedges (average of −23.4±1.6‰).
(color online) Water isotope composition of ice wedges and pore/segregated ice in permafrost, Two Moose Lake central Yukon, Canada. (A) δD-δ18O and (B) D-excess δD composition. GMWL, global meteoric water line (δD=δ18O +10; Dansgaard, Reference Dansgaard1964); LMWL, local meteoric water line: Ogilvie Mountains (δD=6.8 δ18O - 24.49; Baranova, Reference Baranova2017), Mayo (δD=6.3 δ18O - 36.86; IAEA/WMO, 2015), Inuvik (δD=7.3 δ18O - 3.37; IAEA/WMO, 2015).

Reliable regression slope values between δD-δ18O could not be calculated for IW3 and IW8 due to the high degree of clustering of the data; however, the other two Holocene ice wedges had slope values of 6.5 (IW1: δD=6.5 δ18O - 46.5; R 2 =0.70) and 5.6 (IW6: δD=5.6 δ18O - 66.8; R 2=0.63; Table 2). The late Pleistocene-age ice wedges had slightly lower regression slope values: IW7: δD=5.2 δ18O - 90.5; R 2 =68; IW2: δD=3.3 δ18O - 136.2; R 2=0.63; Table 2). All ice wedges, except IW8 (average 3.7±3.4‰), had low D-excess values with averages ranging from −15.5±2.1‰ to −1.9±6.3‰ (Table 2).
DISCUSSION
The sedimentation history and ice-wedge activity at this site, and others nearby, provide important insights into the permafrost and glacial history of the Blackstone Plateau in relation with past climate condition. Below we first discuss the depositional history of the four sedimentary units, the moisture source and formation of the ice wedges, followed by the timing of ice-wedge activity in relation to regional climate.
Deposition history of host sediments
A schematic diagram of the depositional history and growth of ice wedges on the Blackstone Plateau is shown in Figure 3. The muddy gravels (unit 4) were likely deposited prior to the late Wisconsinan glaciation since they contain ice wedges dated to 31,595–13,010 cal yr BP; syngenetic ice wedges typically do not develop in coarse sediments (French, Reference French2013). The pore/segregated ice in the muddy gravels has δ18O values (−27.1 to −22.3‰) more similar to those in interstadial-age sediments in the Last Chance Creek member near Dawson City dated to >40,000 14C BP (−28.3 to −26.3‰; Kotler and Burn, Reference Kotler and Burn2000), then those of full-glacial conditions in the western Arctic (−32 to −28‰; Mackay, Reference Mackay1983; Jasechko et al., Reference Jasechko, Lechler, Pausata, Fawcett, Gleeson, Cendon and Galewsky2015; Jasechko, Reference Jasechko2016).
The frozen muddy gravels are unconformably overlain by frozen sandy silts (unit 3) in which St-Jean et al. (Reference St-Jean, Lauriol, Clark, Lacelle and Zdanowicz2011) obtained a 14C age of 4673 cal yr BP from organics near the lower contact at a nearby site (ca. 5 km to the south; Fig. 1). This suggests that an erosional event occurred (possibly proglacial meltwater from the alpine glaciers situated ca. 15 km to the south during the late Wisconsinan glaciation) and produced the unconformity between units 3 and 4. The sediments of the mid- to late Holocene age unit 3 (frozen sandy silts) and unit 2 (frozen silty loam) likely represent alluvium deposited by surface runoff along the nearby hillslope or by the East Blackstone River during periods of over-flow. The uppermost 0.5-m section of unit 2 contains high amount of organic matter (some as large organic clumps; Fig. 3) that could have been incorporated during transport of the sediments. Mixing by cryoturbation during periods of active layer deepening can be ruled out because the ice wedges terminate at the base of the modern active layer and there was no visible rejuvenation feature. The δ18O values of the pore/segregated ice in units 3 and 2 (−22.4±0.8‰ to −21.1±0.7‰) are within the range of modern precipitation in the Ogilvie Mountains (−22.3±5.5‰; Baranova, 2017) and of other nearby mid to late Holocene-age ground ice in permafrost (e.g., Burn et al., Reference Burn, Michel and Smith1986; Kotler and Burn, Reference Kotler and Burn2000; St-Jean et al., Reference St-Jean, Lauriol, Clark, Lacelle and Zdanowicz2011). The ice wedges that developed in units 2 and 3 are likely syngenetic due to their morphology (ragged lateral boundaries) and their 14CDOC ages of 6360 to 875 cal yr BP that fall within the age of the host sediments (4673 cal yr BP at ~2.75 m depth from a nearby site; St-Jean et al., Reference St-Jean, Lauriol, Clark, Lacelle and Zdanowicz2011).
Source of moisture and formation of ice wedges
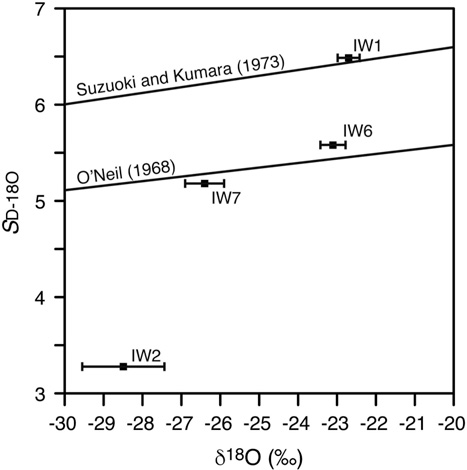
The δD-δ18O regression slope values (S D-18O) of the ice wedges (ranging from 6.5 to 3.3; Table 1) are lower than the global (S D-18O=8; Dansgaard, Reference Dansgaard1964) and local meteoric water line in the Ogilvie Mountains (S D-18O=6.8; Baranova, 2017), suggesting that they formed from the freezing of snow meltwater (e.g., Lauriol et al., Reference Lauriol, Duchesne and Clark1995); condensation of water vapour or infilling by snow would tend to result in S D-18O values near the meteoric water lines. Jouzel and Souchez (Reference Jouzel and Souchez1982) suggested that S D-18O during freezing is affected by the initial composition of the water, with lower isotopic composition resulting in lower regression slopes. The regression slope value of ice formed during freezing can be estimated from:
 $$S_{{D{\minus}18O}} \,{\equals}\,{{{\rm ln}\left( {\alpha D_{{i{\minus}w}} } \right)} \over {{\rm ln}\left( {\alpha 18O_{{i{\minus}w}} } \right)}}$$
where: αDi-w=(αDi-w (αDi - w - 1) (1000 + δDo) / 1000 + 1; α18Oi-w=(α18Oi - w (α18Oi - w - 1) (1000 + δ18Oo) / 1000 + 1; the sets of αDi-w and α18Oi-w have been defined. Using O’Neil (Reference O’Neil1968), αDi-w and α18O-i-w are 1.0195 and 1.0031, respectively; using Suzuoki and Kumura (Reference Suzuoki and Kumura1973), αDiw and α18O-i-w are 1.0208 and 1.0028, respectively
Our results are largely consistent with the expected positive relation between the S D-18O and the average δ18O composition; only IW2 had a much lower S D-18O than that predicted (Fig. 7). Many studies assumed that δ18O of ice wedges that formed from freezing of snow meltwater should reflect that of bulk snow, hence its use as winter air temperature proxy (Popp et al., Reference Popp, Diekmann, Meyer, Siegert, Syromyatnikov and Hubberten2006; Meyer et al., Reference Meyer, Opel, Laepple, Dereviagin, Hoffmann and Werner2015; Opel et al., Reference Opel, Laepple, Meyer, Dereviagin and Wetterich2017). However, the δ18O values of the mid- to late-Holocene ice wedges (−25.6±0.3‰ to −22.7±0.2‰) are 2–5‰ higher than modern snow in the Ogilvie Mountains (−27.1±1.3‰; Baranova, 2017). Similarly, the late Pleistocene-age ice wedges, with δ18O values in the −28.5±1.2 to −26.4±0.5‰ range, are higher than expected late Pleistocene values of precipitation in western Arctic (−32 to −28‰; Jasechko, Reference Jasechko2016). The D-excess values in the ice wedges, with values in the −15.5±2.1 to 3.7±3.4‰, are also too low to be explained by freezing of melting of bulk snow (average D-excess of snow in the Ogilvie Mountains=8.1±3.9‰; Baranova, 2017), since bulk freezing is associated with a depletion in D-excess of 5.4‰ (Lacelle, Reference Lacelle2011). This suggests that the isotopic composition of snow meltwater must have changed relative to bulk snow prior to infiltrating the crack and freezing (hence, it cannot be used here as a temperature proxy).
Relation between δD-δ18O regression slope value (S D-18O) and average δ18O composition of ice wedges (bars represent standard deviation), Two Moose Lake central Yukon, Canada. The lines are calculated regression slope value of ice formed during freezing from equation 4 and are shown for the two sets of αDi-w and α18Oi-w that have been defined: O’Neil (Reference O’Neil1968), αDi-w and α18O-i-w are 1.0195 and 1.0031, respectively; Suzuoki and Kumura (Reference Suzuoki and Kumura1973), αDi-w and α18O-i-w are 1.0208 and 1.0028, respectively.

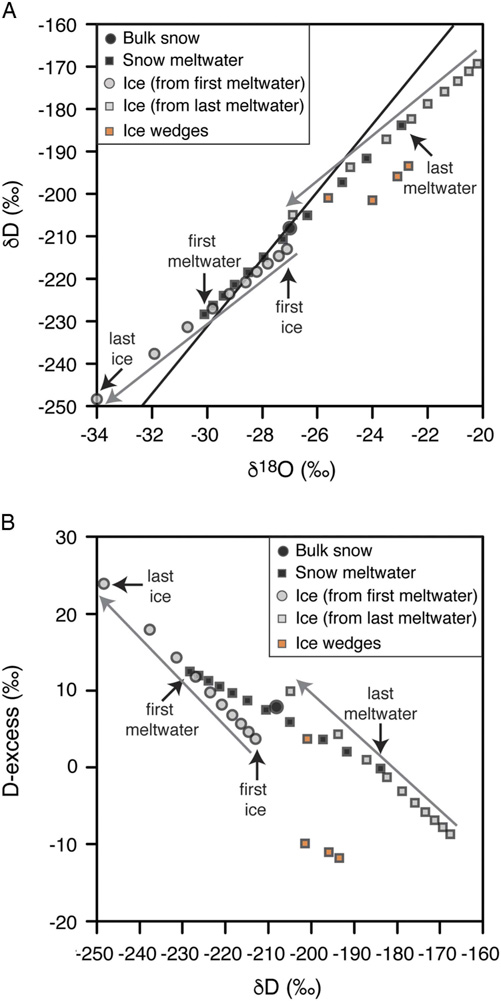
Laboratory and field measurements showed that the δD, δ18O and D-excess compositions of snowmelt vary during the melting process, such that it does not equal that of the bulk snow (Lauriol et al., Reference Lauriol, Duchesne and Clark1995; Taylor et al., 2001, Reference Taylor, Feng, Renshaw and Kirchner2002; Feng et al., Reference Feng, Taylor, Renshaw and Kirchner2002; Lee et al., 2009, Reference Lee, Feng, Faiia, Posmentier, Kirchner, Osterhuber and Taylor2010; Ala-aho et al., Reference Ala-aho, Tetzlaff, McNamara, Laudon, Kormos and Soulsby2017). This isotopic evolution is caused by isotopic exchange between liquid water and ice as the meltwater percolates down the snowpack and melting-recrystallization processes. The δD and δ18O composition of snow meltwater is typically depleted in the early meltwater and becomes progressively enriched as melt proceeds (up to ~5–7‰ for δ18O), which also causes D-excess to become progressively lower (up to ~10‰ at the late stage of melting). Additionally, freezing is accompanied by isotopic fractionation such that the ice becomes progressively depleted as freezing occurs (up to ~7–8‰ for δ18O; Lacelle, Reference Lacelle2011). Figure 8 shows the isotopic evolution of snow meltwater and forming ice at different melt-out fractions. It assumes a homogenous snowpack: varying snow δ18O-stratigraphy does not greatly affect the magnitude of δ18O enrichment in the snow meltwater, it mainly determines the timing of its change in the melt fraction (Lee et al., Reference Lee, Feng, Faiia, Posmentier, Kirchner, Osterhuber and Taylor2010). The δ18O and D-excess values of our ice wedges suggest freezing of 18O-enriched meltwater and which also evolved lower D-excess values. The lower D-excess values in ice wedges IW1, IW3, IW6, and IW7 suggest that: (1) the snow partially sublimated prior to melting, which would cause the surface snow layer to modify its D-excess composition towards lower values (Sokratov and Golubev, Reference Sokratov and Golubev2009); and/or (2) the meltwater experienced evaporation while infiltrating the crack prior to freezing.
(color online) Variations in δD, δ18O, and D-excess of snow meltwater and forming ice at different melt-out fraction. The example assumes a homogenous snowpack with initial isotope composition as measured in Ogilvie Mountains (δD=−209‰, δ18O=−27‰, D-excess=7.9‰). Bulk melting and freezing of the snow pack would produce ice with the same initial isotope composition. The isotope composition of snow meltwater evolves, however, as melting progresses such that the forming ice can have very different isotope composition than the initial snow (Feng et al., Reference Feng, Taylor, Renshaw and Kirchner2002; Lauriol et al., Reference Lauriol, Duchesne and Clark1995; Lee et al., 2010, Reference Lee, Feng, Posmentier, Faiia and Taylor2009). Our δD, δ18O, and D-excess of mid- to late Holocene ice wedges suggest freezing of 18O-enriched meltwater, which also evolved lower D-excess values. The model used is a simple Rayleigh-type fractionation during melting and freezing and ignores melt rate, ice-water isotope exchange, and its rate constant (which must be derived by fitting model to data; Feng et al., Reference Feng, Taylor, Renshaw and Kirchner2002; Lee et al., 2009, Reference Lee, Feng, Faiia, Posmentier, Kirchner, Osterhuber and Taylor2010); however, for illustration purposes, these will not cause a significant deviation from shown output.

Regional climate and periods of ice-wedge activity
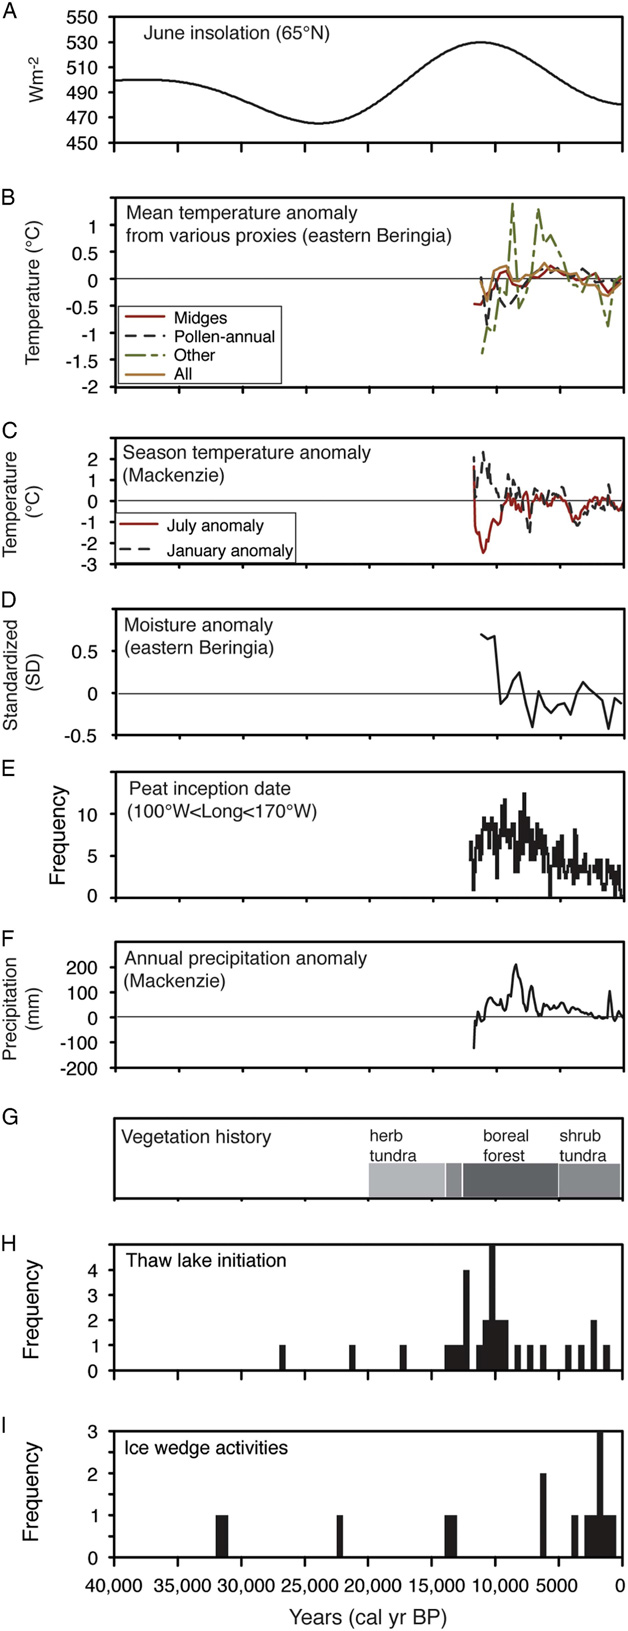
Ice wedges are proxies for paleo-environmental conditions because their development requires: (1) the presence of icy permafrost; (2) mean annual air temperatures less than -2°C; (3) surface conditions that allow cracking of the icy permafrost when air temperatures rapidly decrease in winter; and (4) moisture source to fill the cracks (Washburn, Reference Washburn1980; Harry and Gozdzik, Reference Harry and Gozdzik1988; Christiansen et al., Reference Christiansen, Matsuoka and Watanabe2016). The 14CDOC dating approach of ice wedges assumes that the age of the snow meltwater is “modern” at the time of infiltrating the crack. This assumption is validated from measurements during the 2014 and 2015 spring freshets of the Ogilvie River where DOC and F14CDOC were 7.5−13.8 ppm and 1.04 ± 0.03 pMC, respectively (Baranova, 2017). The DOC concentration during spring freshets is in the range of those measured in the ice wedges (Table 1). Given that our 14CDOC ages are representative age of ice wedge formation, we compared the 14CDOC age distribution from the ice wedges exposed at Two Moose Lake with regional paleo-climatic reconstructions (temperature and moisture), vegetation history, and timing of thermokarst lake initiation, a proxy of permafrost degradation, in Alaska and the western Canadian Arctic to infer favorable growth conditions of ice wedges over the past 35,000 yr on the Blackstone Plateau (Fig. 9). The 14CDOC ages, beyond having a degree of analytical uncertainty, represent a range in ages since samples were collected across multiple ice veins such that DOC was incorporated over an unknown period of time; hence we grouped the results in 500-yr bins.
(color online) Frequency distribution of ice-wedge activity on Blackstone Plateau (500-yr bins) compared to (A) summer insolation at 65°N (from Laskar et al., Reference Laskar, Robutel, Joutel, Gastineau, Correia and Levrard2004) and various Holocene proxy climate records from eastern Beringia and Mackenzie Valley (NWT, Canada). (B) Mean temperature anomaly from various temperature proxies (from Kaufman et al., Reference Kaufman, Axford, Henderson, Mckay, Oswald, Saenger and Anderson2016). (C) Summer temperature anomaly (from Viau and Gajewski, Reference Viau and Gajewski2009). (D) Moisture anomaly (from Kaufman et al., Reference Kaufman, Axford, Henderson, Mckay, Oswald, Saenger and Anderson2016). (E) Peat inception dates in eastern Beringia (from Gorham et al., Reference Gorham, Lehman, Dyke, Janssens and Dyke2007). (F) Annual precipitation anomaly (from Viau and Gajewski, Reference Viau and Gajewski2009). (G) Paleo-biomes in central Yukon (from Dyke, Reference Dyke2005). (H) Frequency distribution of ice-wedge activity on the Blackstone Plateau, central Yukon (from this study). (I) Frequency distribution of the initiation of thaw lakes in Alaska and western Arctic Canada (from Walter et al., Reference Walter, Edwards, Grosse, Zimov and Chapin2007).

Based on 14CDOC, the ice wedges at Two Moose Lake were active during the late Pleistocene (31,595–13,010 cal yr BP, with ages clustered between 31,595–31,195 and 13,685–13,010 cal yr BP) and the mid- to late Holocene (6360 to 920 cal yr BP). There was likely a hiatus in ice-wedge growth during the last glacial maximum of the McConnell glaciation (27,000 to 22,000 cal yr BP; Clark et al., Reference Clark, Dyke, Shakun, Carlson, Clark, Wohlfarth, Mitrovica, Hostetler and McCabe2009), with the glaciers extending ca. 15 km south of our study site. Similar conditions were also observed in the nearby Klondike muck deposits, where ice wedges were absent from the Quartz Creek member dated to 27,675–26,570 cal yr BP (Kotler and Burn, Reference Kotler and Burn2000). The inactivity of ice wedges during the last glacial maximum was attributed by Kotler and Burn (Reference Kotler and Burn2000) to the presence of a thin snow cover that limited snow meltwater supply for ice-wedge growth. This hypothesis is supported by the presence of herbivorous Beringian fauna that preferred areas with thin snow cover for foraging and survival (Harington and Cinq-Mars, Reference Harington and Cinq-Mars1995; Laxton et al., Reference Laxton, Burn and Smith1996; Guthrie, Reference Guthrie2006). Therefore, the climate conditions, although cold during the last glacial maximum, were likely too dry for the growth of ice wedges in central Yukon. However, our findings of ice-wedge activity between 32,000–29,500 and 14,000–12,500 cal yr BP suggest that climate was favorable during these time intervals to promote ice-wedge growth.
During the early Holocene through part of the mid-Holocene (11,700–6500 cal yr BP), ice wedges were inactive on the Blackstone Plateau; a finding also observed in the ice-rich silts along the Porcupine River in northern Yukon (Lauriol et al., Reference Lauriol, Duchesne and Clark1995). This time period was characterized by warmer and wetter climate conditions associated with a transition from tundra to boreal forest vegetation (Fig. 9). Summer air temperature were 2–7°C warmer with precipitation being ~1.5–2 times higher than present-day (Clark et al., Reference Clark, Lauriol, Marschner, Sabourin, Chauret and Desrochers2004; Viau and Gajewski, Reference Viau and Gajewski2009; Kaufman et al., Reference Kaufman, Axford, Henderson, Mckay, Oswald, Saenger and Anderson2016). These conditions during the Holocene thermal maximum resulted in increased thermokarst activity, as evidenced by the formation of thaw lakes, with peak initiation at 10,500–10,000 cal yr BP (MacDonald et al., Reference MacDonald, Beilman, Kremenetski, Sheng, Smith and Velichko2006) and in increased active layer thickness in Alaska and western Arctic Canada that resulted in partial ice-wedge degradation (ice wedges truncated at the maximum active layer depth (i.e., Mackay, Reference Mackay1974; Burn, Reference Burn1997; French and Shur, Reference French and Shur2010; Fritz et al., 2012, Reference Fritz, Wolter, Rudaya, Palagushkina, Nazarova, Obu, Rethemeyer, Lantuit and Wetterich2015).
Ice-wedge activity on the Blackstone Plateau re-initiated around 6500 cal yr BP, with a peak in activity between 3980 and 920 cal yr BP. Mid- to Late Holocene ice-wedge growth was also observed in the western Arctic based on dating of organic material overlying the ice (Burn, Reference Burn1990; Lauriol et al., Reference Lauriol, Duchesne and Clark1995). This time period was characterized by cool and moist climate conditions and a return to tundra vegetation. The cooling climate also resulted in a decrease in frequency of thaw-lake initiation in the region. Over the last decade, degradation of some ice-wedge polygons was observed likely as a result of warming (i.e., St-Jean et al., Reference St-Jean, Lauriol, Clark, Lacelle and Zdanowicz2011). Overall, patterns of ice-wedge activity on the Blackstone Plateau was broadly consistent with the climate and vegetation evolution in eastern Beringia (Alaska and western Arctic Canada). Future advances in micro-AMS technique will allow for single ice veins to be dated by the 14CDOC method. This will allow us to obtain detailed time-series of ice-wedge activity and to assess the timing of periods of favorable growth conditions and changes in temperature, moisture, and vegetation in areas where ice-wedge polygons are developing.
CONCLUSIONS
The purpose of the study was to reconstruct ice-wedge activity over the past 35,000 yr on the Blackstone Plateau (Ogilvie Mountains, central Yukon Territory, Canada). Based on the results, the following conclusions can be made.
(1) Late Pleistocene epigenetic ice wedges developed in muddy gravels and mid- to late Holocene syngenetic ice wedges developed in icy alluvial silts.
(2) The δD-δ18O relation in the ice wedges indicate that they formed from the freezing of snow meltwater. The δ18O and D-excess values of the ice wedges suggest freezing of 18O-enriched snow meltwater (with low D-excess).
(3) The ice wedges on the Blackstone Plateau and surrounding region were active during periods characterized by cool and moist climates (31,595–31,195, 13,685–13,010, and 6360–920 cal yr BP).
(4) The ice wedges were inactive during the very cold and dry climate of the late Wisconsinan full glacial interval (27,000–22,000 cal yr BP) and the warm and wet climate of the Early to Mid-Holocene (11,700–6500 cal yr BP).
(5) The presence of late-Wisconsinan age ice wedges on the Blackstone Plateau indicate that it remained ice-free during the last glaciation (McConnell glaciation).
ACKNOWLEDGMENTS
This work was supported by Natural Sciences and Engineering Research Council of Canada (NSERC) Discovery Grant with logistical support provided by NSERC Northern Supplement, and Northern Scientific Training Program. We would like to thank A. Lapp for valuable field assistance. M. Kanevskiy, M. Fritz, and the editors (L. Owen and T. Lowell) provided constructive comments on the manuscript.