How do legislators, and the parties they belong to, position themselves in legislative speeches? And how can political scientists systematically analyse the content of legislative speeches to gain insight into party positions? Until recently, legislative speeches have remained a largely untapped resource when examining position taking in parliamentary arenas. Instead, researchers have focused on voting behaviour to study ideology in legislatures. New advances in computer-based content analysis, however, have opened up the possibility of treating written or spoken text as data to study ideology.Footnote 1 In many ways, the ability to examine legislative speeches represents an improvement upon existing methodologies. In parliamentary systems, it is well known that voting behaviour does not reflect ideology due to high party discipline and government agenda setting. Therefore, roll-call votes provide very little information about the placement of parties in an ideological space and show instead the division between government and opposition parties. Even in other political systems, roll-call votes may only account for a small and potentially biased sample of all votes. Members of parliaments, on the other hand, deliver speeches on a wide variety of topics on an almost daily basis. We argue that the content of these speeches provides a great deal of information about partisan ideology and position taking.
To examine parliamentary speech in the European Union, we have constructed a new dataset of all speeches given during the 5th session (1999–2004) of the European Parliament (EP). The EP provides an excellent but particularly hard case for the study of position taking in parliamentary speech. First, the EP has many more parties than other parliaments. Voters elect members of the European Parliament (MEPs) from national party lists. Although these national party MEPs do form political groups within the parliament, there were almost 130 national parties represented in the EP during the time period we investigated, and this was prior to the enlargement of the EU in 2004. With so many parties and political views, it will be difficult to find ideological structure in the speeches. Secondly, because there is no government–opposition divide as in parliamentary systems, there is less structure to EP debates than there might be in a national parliament. Lastly, the EP being a multilingual political body, all legislative speech occurs in translation. This may add an additional layer of error in the data and raises the question of whether some languages are more suitable for computer-based content analysis than others. If we are able to extract meaningful party positions from these speech data, and if we can do this regardless of the language we choose, then the approach we employ here should be able to estimate party positions from speeches in other political systems as well.
The remainder of the article examines the structure of parliamentary debate in the EP. We apply a novel method called Wordfish to extract policy positions from the speeches.Footnote 2 We then test whether these estimated positions correspond to (1) left–right ideology, (2) positions on European integration, or (3) a national dimension in the European Union. We find that the primary dimension of speech in the EP is best explained by national divisions and parties’ positions towards deeper EU integration. In contrast, national parties do not appear to position themselves primarily according to their left–right ideology. These results are in contrast to findings of voting behaviour studies in the EP. Moreover, we show that our findings are robust to the choice of language and translation, to various independent measures of left–right and EU positions, and to the type of statistical model used.
Revealing Party Positions In The European Parliament
National parties reveal their positions in the EP through the actions taken by their members. There are two primary ways for MEPs to reveal both their positions and those of their parties: they give speeches and they subsequently vote on legislative proposals. Votes on legislative proposals and resolutions have been the primary source of data to study MEPs’ revealed preferences. If such votes are recorded as a roll call, then this information can be used to estimate positions of MEPs as well as of national parties by aggregating individual MEP positions. Roll calls have therefore been used by numerous scholars to study national party positions in the European Parliament by applying various scaling techniques. The studies either use roll-call samples from specific periodsFootnote 3 or most recently cover all available roll calls from the beginning of the EP.Footnote 4
Estimating ideal points from EP roll-call data is not unproblematic and scholars must regard such estimates with caution. Carruba et al. have pointed out a well-known selection problem associated with roll-call votes in the EP.Footnote 5 Not only are less than a third of all votes in the EP by roll call, but party groups use roll-call votes ‘in a fashion that would introduce selection bias into the roll-call vote sample’.Footnote 6 Contrary to the common belief that roll calls represent votes on significant issues, the authors actually find that such rolls are taken disproportionally on (inconsequential) resolutions rather than on (consequential) legislative proposals under the co-decision procedure.Footnote 7 They conclude that roll-call votes are biased towards overestimating inter-party group cohesion, because MEP attendance on over-sampled resolutions is significantly different from attendance on co-decision votes, representing those who tend to vote the party line. Together, these results would suggest that ideological estimates from roll calls in the EP ‘are most likely incorrectly characterizing the policy space’.Footnote 8 Even though scholars applying scaling techniques to roll-call data state explicitly that they are ‘less interested in the estimation of the ideal points of individual MEPs than in the number of dimensions of politics’,Footnote 9 researchers might nevertheless be tempted to use their scores to test models requiring ideal-point estimates.Footnote 10
Speeches may offer a useful alternative to recorded votes. On the one hand, speaking in parliament and voting share a common feature in the sense that they are public. As a consequence, depending on the context, MEPs may make statements that are either symbolic, and include cheap talk, or strategic. On the other hand, there are fewer constraints in the EP on speeches than on votes. Speeches about European policies contain more nuanced arguments than simple ‘Yes’ or ‘No’ votes. Moreover, selective roll-call data are likely to be endogenous to the true, unobserved preferences of delegates, and are affected by partisan and institutional constraints in the Parliament (such as the strategic decision to demand a roll call). In contrast, speeches are more likely to yield preference data that are relatively free from such constraints for two reasons. First, MEPs give speeches on issues which never make it to a roll-call vote, and, secondly, all speeches are recorded and, therefore, do not have the same potentially problematic sample bias as roll-call votes. Legislative speeches are therefore an obvious, yet unexplored, source of data for research into partisan position taking inside the EP.Footnote 11
The Structure of Debates in the EP
Before examining position taking in EP speeches, it is helpful to understand when and how MEPs participate in legislative debate. The plenary sessions of the European Parliament take place every month for a week in Strasbourg, France, with additional meetings held in Brussels, Belgium. Debates in the plenary are primarily held on legislative and non-legislative reports. In addition, the EP exercises supervision of the other institutions through written and oral questions by MEPs to the Council and the Commission with subsequent debate. Furthermore, the EP may debate statements made by the President of the European Council, the Commission or the Council.Footnote 12 Finally, the EP has time set aside for debates on ‘breaches of human rights, democracy and the rule of law’ as well as for short-notice reactions to major events.
Independent of the agenda item being under discussion, structuring the debates always involves the allocation of speaking time.Footnote 13 Specific speaking time is reserved for the Commission and the Council (which we do not analyse here), but several MEPs also have reserved speaking time. These include rapporteurs and draftsmen of opinions and authors of motions for resolutions. The largest proportion of speaking time is allocated to the political groups of the EP. These political groups are made up of individual national party delegations and loosely correspond to traditional party families. Each political group receives speaking time roughly in proportion to its seat share.Footnote 14
A typical debate on legislation starts with an opening statement from the European Commission. This is followed by the rapporteur presenting the response of the relevant EP committee. If applicable, draftsmen of opinions from other committees may speak after the rapporteur. Then, the general debate follows with each political group speaking on the issue under debate, starting with the largest group. Party groups decide internally how to divide time among their MEPs, with the time for individual speeches being strictly limited, usually not more than three minutes.Footnote 15 At the end of the debate, the Commission replies to the speeches and indicates its position on proposed amendments to the legislative proposal.Footnote 16
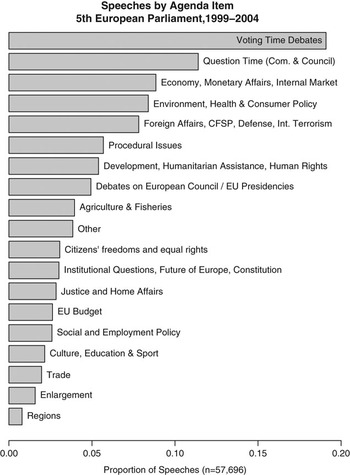
Legislative speeches in the EP cover a wide range of topics. To understand the structure of debates better, we identified all agenda items under debate during the 5th European Parliament (1999–2004), as well as the number of speeches given for each item.Footnote 17 In total, we found 2,000 different agenda items in the debates. We then put these items into pre-defined categories which follow standard categories of EU policies. Figure 1 presents the results. The largest number of speeches were delivered in the form of explanations of votes during voting time (around 20 per cent). The EP agenda does not break down the type of legislation being debated or the length of debate, so we must assume that this category includes all sorts of policies in which the EP has co-decision power. Three categories are not about specific policies (question time, procedural issues, and other speeches), making up another 20 per cent of the total speeches. Debates on specific policies constitute the largest category (60 per cent). They include speeches on internal (EU) policies (around 45 per cent of all debates) and on foreign policies (about 15 per cent). In short, speeches cover all policy areas of the EU. But how do parties position themselves in these speeches?
Speeches by Agenda Item, 1999–2004

Hypotheses
Existing empirical research has highlighted the presence of two major dimensions in European Union politics: a traditional left–right dimension and a European integration dimension.Footnote 18 Studies of voting behaviour inside the European Parliament find that left–right politics is the best predictor of MEP voting patterns,Footnote 19 even though replication of these analyses with more sophisticated statistical techniques finds that both left–right and pro/anti-Europe positions are contained in the first dimension extracted from roll-call data.Footnote 20
Analogous to revealed behaviour in roll-call data, we might expect positions extracted from MEP speeches to line up along either an ideological left–right dimension or a European integration dimension. Speeches could reveal similar ideological positions to those uncovered through votes since parties might try to limit access to the floor and only allow those MEPs to deliver speeches who represent the official party line. We might, therefore, find left–right ideology in a speech dimension. But as debates cover a much larger range of topics, including issues not subject to roll-call votes, it is also possible that legislative speeches reflect positions on European integration rather than left–right politics. Conceptually, the EU integration dimension (or pro-/anti-Europe) is a rather narrow, well-defined dimension, while the left–right dimension is very broad.Footnote 21 Left–right commonly refers to a socio-economic dimension, but it may also include aspects of social conservatism or liberalism, and potentially even nationalism and militarism. Studies of roll-call votes have compared positions extracted from votes to both the left–right scale created by the Comparative Manifestos Project and expert surveys.Footnote 22 The CMP left–right scale includes issues related to economic ideology as well as features of culture, society and militarism.Footnote 23 Asked to assess the left–right positions of parties, experts must construct their own notion of what left–right ideology means. For instance, in their expert survey of EP group positions, Benoit and McElroy asked experts to locate the groups on a left–right dimension ‘taking all aspects of group policy into account’.Footnote 24 Despite its scope, the left–right dimension is often viewed as orthogonal to the dimension of EU integration. There are both leftist and rightist parties opposed to integration. In some countries, the left may be more willing to support integration, while in other countries it is the right that prefers deeper integration. For this reason, it is possible to examine position taking in the EP both in terms of left–right ideology and integration, even if one category encompasses a great deal more than the other.
Besides such ideological factors, national party delegations may express national differences in speeches. The issue categories for the speeches (Figure 1) suggest that national factors might in fact play a role. This is especially true given the amount of time spent debating the annual budget, agricultural subsidies, institutional issues and foreign policy. These areas are likely to separate MEPs from different countries. Financial issues might cause MEPs from net paying and receiving countries to use different arguments in speeches, institutional issues can reveal a divide between small and large countries, and foreign policy might add a similar national dimension to the debates. Using the whole set of speeches from each party, we test the following hypotheses of national party position taking:
HYPOTHESIS 1 – Left–right position taking: national parties, through speeches given by their MEPs, position themselves in the EP according to their national left–right ideology.
HYPOTHESIS 2 – European position taking: national parties, through speeches given by their MEPs, position themselves in the EP according to their position on European integration.
HYPOTHESIS 3 – National position taking: national parties, through speeches given by their MEPs, position themselves in EP speeches according to national factors such as country size, wealth and net payer/receiver status.
Extracting The Principal Dimension Of Speech: The Wordfish Technique
To examine these hypotheses, we extract the principal dimension of speech using a new computer-based technique called Wordfish.Footnote 25 Computer-based content analysis aiming to extract political positions from texts has been applied to multiple sources of political text, including party manifestos,Footnote 26 legislative speeches,Footnote 27 campaign speeches,Footnote 28 constitutional negotiations,Footnote 29 and judicial decisions.Footnote 30 The Wordfish method uses unique words as the unit of analysis and compares political texts (e.g. manifestos, speeches, etc.) on the basis of relative word usage in each. As a scaling technique, Wordfish does not require an a priori definition of the dimension being estimated (for instance, by anchoring specific reference speeches). The technique uses an explicit parametric model of word counts and simply scales the word counts to reduce the data to a single dimension. Wordfish assumes that word frequencies are generated by a Poisson distribution.Footnote 31 This distribution is simple and has only one parameter that needs to be estimated, λ, which is both the mean and the variance. The functional form of the Wordfish model is as follows:

where α is a set of national-party fixed effects, ψ is a set of word-fixed effects, β is an estimate of a word-specific weight capturing the importance of the word j in discriminating between positions, and ω is the estimate of party i’s position. Word-fixed effects capture the fact that some words are used much more often than other words by all parties. National party effects control for the possibility that some parties speak more than other parties.
To estimate the parameters of this item-response model, Wordfish uses an expectation maximization (EM) algorithm, alternating between estimating word-specific parameters holding the party-specific parameters fixed and estimating party-specific parameters holding the word-specific parameters fixed. The process is repeated until a convergence criterion is met (i.e. log-likelihoods do not change any more from one iteration to the next). The resulting positions are located on a dimension which is (arbitrarily) scaled to a mean of 0 and a standard deviation of 1 to identify the likelihood function.Footnote 32
The Wordfish algorithm is not the only computer based content analysis technique that can be applied to study ideology in political text. The Wordscores technique also uses relative word frequencies in text documents to place actors on a single dimension.Footnote 33 The choice of content analysis technique depends on the research question. For the purpose of our study, we are interested in examining the speech dimension in the EP and thus prefer to use Wordfish as it scales the word data to extract a single dimension. If our aim were to place parties on a pre-defined dimension, we could use Wordscores as it allows definition of the dimension ex ante via reference texts.Footnote 34
The Data: Speeches In The European Parliament
We test the hypotheses using a newly collected dataset of legislative speeches in the 5th European Parliament (1999–2004). The number of speeches delivered during this time is impressive. Between 1999 and 2004, MEPs gave over 50,000 speeches in the plenary (Table 1).Footnote 35 This set of political statements constitutes a rich dataset for multilingual content analysis. We want to estimate and examine the principal dimension of speech in the EP and compare it to other measures of ideology. But even though legislative speeches do provide a rich source of information, they might be harder to compare to each other than to written texts such as party manifestos. Laver et al. describe the potential problems:
While the analysis of speeches holds considerable promise, it also raises new challenges for content analysis – whether computerized or traditional – because such speeches differ substantially from party manifestos in several key respects. First, manifestos are typically comprehensive documents addressing a wide range of policy issues, while speeches tend to be much more restricted in focus. Secondly, manifestos are published in a political context that is fairly well defined. Greater care must be taken in establishing the political context of speeches if we are to justify the comparison of different speeches in the same analysis.Footnote 36
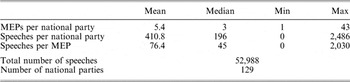
Summary Statistics: Speeches in the 5th European Parliament (1999–2004)

To address these two potential problems, we first use all legislative speeches given during the 5th European Parliament, not limiting ourselves to only a few important ones. This way we ensure our data are not issue specific.Footnote 37 Speeches cover all categories listed in Figure 1. Secondly, in order to control for speaker-specific context, we chose national parties as the unit of analysis, and not individual MEPs. We decide to focus on national party positions rather than individual positions for both substantive and methodological reasons. Substantively, findings in the existing literature on the importance of national parties in the European Parliament justify this choice.Footnote 38 For example, national parties choose the candidates who run in European Parliament elections, organize the campaigns, choose which European political group to align with once in Parliament, and control to a large extent the allocation of political offices in the EP. Moreover, scholars are often more concerned with analysing the positions of party groups and the national parties that compose them, rather than the positions of individual MEPs.Footnote 39 Even scholars examining the dimensionality of positions extracted from roll-call votes usually aggregate up to the level of the national party rather than examine individual (MEP) ideology.Footnote 40
Methodologically, by aggregating speeches from the individual to the national party level, we ensure that the positions are estimated from more comprehensive data. The aim is to eliminate situations in which short or trivial speeches heavily influence the estimation and the results. In addition, an individual level analysis requires throwing away a great deal of data that may be preserved in the analysis at the level of the national party. A substantial number of MEPs gave very few speeches. We would not be able to estimate positions for these individuals. If, for example, there were two individuals from the same national party and both made relatively few speeches, thus preventing the estimation of individual positions, we may still be able to estimate a position for their national party if their combined speeches are sufficiently long.
Nevertheless, aggregation potentially leads to a few problems. First, we necessarily overlook intra-party variation. We certainly do not claim that there is no intra-party variation. In fact, we expect MEPs to agree to various degrees with their party and this ought to be reflected not only in votes but also in legislative speeches. A possible objection to the choice of the national party as the unit of analysis, then, is that the findings will be valid for that particular level of analysis only and possibly cloud true differences between legislators.Footnote 41 A second objection to the use of national parties as the unit of analysis is that, if we truly wish to make comparisons between roll-call positions and speech positions, they should both be measured at the same level of aggregation. To address both of these concerns, we therefore conduct an analysis of speeches at the individual level as well, in order to validate the results from our national party level analysis.
Our data collection involved the following steps. First, we identified all MEPs in the 5th European Parliament, restricting our sample to MEPs from the fifteen member states prior to enlargement in 2004.Footnote 42 Secondly, we downloaded all speeches given by these MEPs in the English, French and German translations from the EP website.Footnote 43 Thirdly, we combined the speeches of MEPs from the same national party using party labels contained in the EP roll-call dataset.Footnote 44
Table 1 presents the summary statistics of the speeches in the 5th European Parliament. Each MEP gave on average seventy-six speeches. Some MEPs did not give speeches at all (usually those who held national offices, such as Italian Prime Minister Silvio Berlusconi), and the most active MEPs were from the EP leadership (president and vice-presidents). On average, members from each national party gave more than 400 speeches. The more robust measure of central tendency, the median, yields close to 200 speeches per national party.
We construct a word-count dataset with unique words in rows and national parties in columns and use a word-count program to stem words in all languages.Footnote 45 To make the estimation more efficient, we reduce the data according to the following criteria. First, we drop national parties whose MEPs do not say anything or give only very few speeches. As the cut-off criterion, a national party’s members must give speeches that total 10,000 words or longer. We also eliminate speeches given by members of the EP’s Bureau. These members preside over the plenary sessions and their speeches are mostly procedural. This way, we eliminate twenty-three parties from the dataset, leaving us with 106 parties. In a second step, we drop words that are used very infrequently. As the criterion, we specify that a word should be kept in the dataset if members from at least thirty national parties (around one-third) use it in their speeches. This reduces the number of unique words significantly, makes estimation faster and more feasible, and ensures that the speeches have a minimum level of comparability. In order to determine whether the cut-off potentially biases our results, we also estimate positions using a less strict criterion (words mentioned by at least ten national parties). The results correlate very highly and we are not worried that the choice of cut-off criterion affects our results.Footnote 46
Speeches in the EP pose an additional challenge to content analysis because all of the EP’s business occurs in multiple languages and therefore in translation. Even though so much of international politics occurs in translation, scholars have not paid significant attention to the effects of translation when using computer-based content analysis. The European Union is perhaps the most prominent example of a multilingual political system. With twenty-seven member states, the EU now has twenty-three official languages.Footnote 47 Unlike other multilingual political bodies, such as the United Nations, where career diplomats are competent in multiple languages, the elected members of the European Parliament have the right to communicate in their national language(s) as an expression of national identities and cultures in Europe.Footnote 48 Every speech made in the EP must, therefore, be interpreted and translated into each of these twenty-three languages so that all MEPs are able to understand it. Moreover, all official laws and regulations must be translated as well.Footnote 49 Rather than treating the presence of multilingualism as an obstacle to the analysis, we consider the EP as the perfect political arena for testing how translation affects computer-based content analysis. Translated EP speeches provide a unique source of data to estimate the positions of members of the EP because we know a priori that the content of all speeches is the same across languages.Footnote 50
Estimated Positions From Ep Speeches
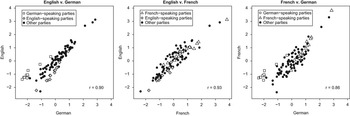
We run the Wordfish algorithm for 106 parties using English, German and French translations. The estimated positions, including their 95 per cent confidence intervals, are presented in Appendix A.Footnote 51 First, we compare the correlation between the extracted positions from different translations to test the robustness of the technique across languages. Figure 2 shows position estimates for all three language combinations.
Wordfish position estimates: comparison between languages (N=106) Note: German-speaking parties include parties from Germany, Austria and the Italian SVP. English-speaking parties include parties from the UK and Ireland. French-speaking parties include parties from France and French-speaking parties from Belgium.

The comparison of the results across languages suggests that the position estimation technique is in fact highly robust to the choice of language (the correlation coefficient is 0.86 or higher). The highest correlation is between positions estimated from the English and French translations. These two languages are so similar to each other with regard to the information contained in words that they produce virtually identical position estimates. The relationship is slightly weaker between German and the other two languages. As we pointed out earlier, German words can be compounded and therefore contain more politically meaningful information than words in English and French.
The lower fit of German is visible in Figure 2, showing a modest heteroscedastic pattern for the German–English and German–French plots. To identify which parties form the clusters, we highlighted native German-speaking, English-speaking and French-speaking national parties in all plots. Speeches given by members of these parties are obviously only translated into the other two languages, whereas the original language version simply corresponds to the EP verbatim reports.Footnote 52 The labels show that German-speaking parties form a cluster and are at the extreme end of the speech dimension for the German translation. In contrast, the very same parties are more dispersed and not located at the extreme ends using the English and French translations. This suggests that the clustering may be due to a bias in the translation. EP speeches from native German speakers contain a set of words that does not appear in the German translation of speeches from non-German speaking parties. In other words, translators do not use the same words as native speakers when translating into German. This is likely to be due to the possibility of creating new words in German which are not used by translators. Because we do not find the cluster of German parties for English and French translations, the bias is most likely the result of translation rather than actual position taking. We do not find this clustering effect for English-speaking or French-speaking parties, whose positions correlate highly across all language combinations. It is important to emphasize that our analysis does not determine a ‘best language’ to be used for automated content analysis. Even though the positions using English and French translations of the speeches correlate higher with each other than with German translations, all estimates are still quite robust to language choice. Our results should be encouraging to those who wish to use automated content analysis to extract political positions from texts. The results suggest that the techniques yield similar results in English, German and French.
Next, we estimate positions for individual MEPs rather than national party delegations to examine whether the results are comparable across levels of analysis. This means that the estimation is now based on fewer speeches per unit of analysis than before. After again excluding MEPs who did not deliver any speeches, we also remove MEPs who gave speeches that were shorter than 10,000 words (or approximately fifteen speeches). This leaves 427 MEPs in the sample. Furthermore, we exclude from the analysis infrequently used words (by less than 10 per cent of MEPs). We then extract positions for these 427 MEPs, who belong to 103 national parties, using the English translations of the speeches.Footnote 53 The results validate the findings from the national party level. The mean national party position from the individual level analysis correlates with the national-party level positions (English) at 0.79.Footnote 54 We later explore more systematically whether the dimension on the individual level actually resembles the one on the national party level.
Taking National Party Positions In Ep Speeches
To test the Left–Right, EU Integration, and National Politics hypotheses, we run a multivariate regression using the estimated party positions from all three languages as the dependent variable. We relied on three data sources to measure left–right and European integration positions for national parties. First, we use an expert survey conducted in 2002–03, during the middle of the 5th European Parliament, by a research team from the University of North Carolina, Chapel Hill (UNC).Footnote 55 This survey polled national experts about European party positions regarding various aspects of EU integration. To capture a party’s overall position with regard to EU integration, the survey asked experts to ‘describe the general position on European integration that the party’s leadership has taken over the course of 2002’. The survey also asked experts to place parties on a left–right spectrum in terms of their broad ideological stance. Of the 106 parties in our dataset, eighty-two are represented in the UNC data.Footnote 56
To validate our findings from the Chapel Hill data, we use a second expert survey conducted at the same time by Benoit and Laver.Footnote 57 They asked numerous experts in forty-seven European countries to place national parties on various policy dimensions. A party’s position towards EU integration was captured by a question that asked whether the party ‘favours increasing the range of areas in which the EU can set policy’.Footnote 58 For the left–right position we use the survey question asking experts to identify the parties’ general left–right stance ‘taking all aspects of party policy into account’.Footnote 59 Of the 106 parties in our dataset, the expert survey includes left–right and EU authority positions for sixty-four parties.Footnote 60
To test the hypotheses using the full sample, we used roll-call votes as a third source of party position data. Specifically, we calculated the average first and second dimension Nominate scores for all 106 national parties during the 5th European Parliament.Footnote 61 It may seem objectionable to use positions based on voting behaviour to explain positions based on speech for two reasons. First, because MEPs speak about an issue before they vote on it, we would probably expect speech to explain votes and not vice versa. Secondly, we are not certain of the exact nature of the dimension that Nominate extracts. However, as previous research has demonstrated, first dimension Nominate scores correlate more highly with a traditional left–right dimension, while the second dimension correlates with positions on delegation of authority to the EU.Footnote 62
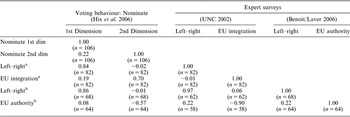
Regardless of the direction of the causal arrow, the Nominate scores provide a good proxy for the survey data. Moreover, they allow us to examine our entire sample and uncover the relationship between positions estimated from voting and those estimated from speeches. Table 2 presents correlations between the average Nominate scores and the two expert survey variables. The first dimension scores correlate highly with left–right but not with the EU authority positions. The second dimension scores, by contrast, correlate with the EU authority variables but not with the left–right variables. In the following analysis, we use both the Nominate positions on the full sample and the survey data on the reduced sample and demonstrate that our results are robust regardless of which measure we use. Finally, to control for any national level effects, we include country dummies in our regression models.
Correlation of Independent Variables: National Party Positions Estimated from Expert Surveys and Roll-Call Votes

aUNC (2002); bBenoit and Laver (2006).
We explicitly take into account that the position variables may contain measurement error. It is well known that the presence of measurement error in independent variables can lead to ordinary least squares (OLS) coefficients that are biased towards zero, thus underestimating the true effect of the independent variables. In order to correct for this bias, we use a technique called simulation-extrapolation or SIMEX.Footnote 63 This method adds measurement error to the model via simulations in order to establish a trend in the bias, and then reduces the effect of this measurement error.Footnote 64 Benoit et al. propose that researchers should use such a correction for models that involve ideological estimates as independent variables whenever possible.Footnote 65 Since we know the measurement error for two of our three position estimates, we follow their advice. Both surveys allow us to assess measurement error through the standard deviations of expert responses.Footnote 66 Although it is, in theory, possible to estimate the uncertainty surrounding the Nominate scores as well, the EP Nominate dataset does not contain such uncertainty measures, and we therefore run simple OLS models for these variables.Footnote 67
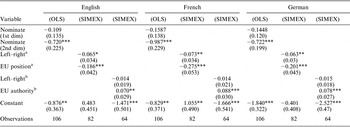
Table 3 examines in detail which variables best explain the positions estimated by Wordfish for all three languages. All models include country dummies to capture any member state specific effects. Such dummies allow the speech positions to shift for parties from a particular country. Because we use three different ideology estimates, our sample size varies. The full sample (models 1, 4 and 7) uses Nominate scores to capture left–right ideology (first dimension scores) and positions towards EU integration (second dimension scores). The use of survey estimates restricts our sample size to eighty-two parties when using the UNC expert survey (models 2, 5 and 8), and to sixty-four parties when using the Benoit/Laver expert survey data (models 3, 6 and 9).
Explaining Speech Positions: Regression Results with Country-Fixed Effects

Note: Standard errors in parentheses. Dependent variables are estimated Wordfish positions for each national party. Nominate ideology scores for national parties are for the 5th EP from Hix et al., ‘Dimensions of Politics in the European Parliament’. The other two ideology estimates are from expert surveys (aHooghe and Marks, ‘Chapel Hill 2002 Expert Survey’; and bBenoit and Laver, Party Policy in Modern Democracies). Country-fixed effects are omitted from the table. *p ⩽ 0.1, **p ⩽ 0.05, ***p ⩽ 0.01.
Regardless of the specific ideology measure and of the language, we find that the variables capturing party position towards EU integration are highly statistically significant. In contrast, left–right ideology variables were either not statistically significant or only marginally statistically significant (UNC survey data). Thus, positions extracted from MEP speeches appear to reflect party positions better towards deeper EU integration than left–right ideology. In addition to the importance of the EU integration variables, F-tests reveal that the country dummies explain the party positions as well. The country dummies are jointly significant at the 0.01 level in each of the models presented in Table 3, suggesting that there are national-specific effects reflected in the speech dimension.
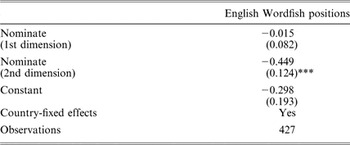
As we pointed out previously, aggregating speeches into party units can pose a problem because the results may only hold for the aggregate level, not the individual level. Therefore, we run Model 1 from Table 3 on individual speech positions using the individual Nominate scores for each MEP. If the results from the national party aggregate data are accurate, we would expect the same strong effects of the second Nominate dimension and the country dummies, but not of the first Nominate dimension. This is exactly what we find (Table 4). The effect of the second Nominate dimension is statisically significant, whereas the first dimension does not explain the positions well. The F-test also reveals that the country-fixed effects are jointly significant (p < 0.001). These individual level results reveal that positions extracted from speech are similar to the second dimension extracted by Nominate from votes, but they contain national-specific positions as well. This discrepancy may be due to constraints placed on MEPs by the party groups when voting that are not present when speaking.
Explaining Individual-Level Speech Positions (OLS)

Note: Standard errors in parentheses. Dependent variables are estimated Wordfish positions for each MEP. Nominate ideology scores for each MEP are for the 5th EP from Hix et al., ‘Dimensions of Politics in the European Parliament’). Country fixed-effects are omitted from table, but are jointly significant. *p ⩽ 0.1, **p ⩽ 0.05, ***p ⩽ 0.01.
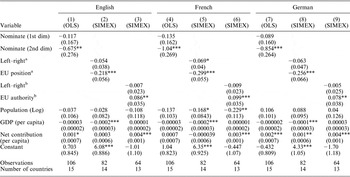
The results from these regressions with country-fixed effects indicate that national level factors are important, but they do not tell us which national level factors matter. Therefore, we introduce variables that reflect national politics in speeches. Specifically, we add variables that measure the wealth, size and net contribution status of each country. We measure a member state’s wealth by its gross domestic product per capita (GDPpercap), its size by the log of its population (Logpop), and the net contribution status by the average net contribution per capita to the EU budget between 1999 and 2003 (Netconpercap).Footnote 68 Both net contributions per capita and GDP per capita are included to capture a redistributive dimension. Parties from poor states, or states that are net receivers of EU money, may take positions different from parties coming from rich, or net payer, countries. Redistributive issues have, for example, been a major source of conflict when negotiating EU budgets and the Common Agricultural Policy (CAP). In addition, many EU institutional issues, such as distribution of votes in the Council of Ministers and the size of the Commission, create a large state vs. small state divide. We capture these potential divisions with the logged population variable.
Again, we use a SIMEX error-corrected OLS model when using the survey data to capture EU integration and left–right positions, and standard OLS for models using the Nominate data. By combining country-specific predictors with measures of party ideology, our data acquire a two-level hierarchical structure (parties nested within countries). If we do not account for this hierarchical structure, we would ignore clustering in the data and violate the assumption that the observations are independent.Footnote 69 Errors associated with parties from the same country are likely to be positively correlated. This would lead to the attenuation of the standard errors of country-level coefficients, and may lead to a false rejection of the null hypothesis for country-level variables. To account for the multilevel data structure, we also estimate a mixed-effects multilevel model.Footnote 70 The results are very similar to error correction and OLS models, and we present the simpler model here and the hierarchical model in Appendix B.
Table 5 presents the results of the three national-level effects in addition to the party-level survey data variables. These models demonstrate that the best national-level explanations for the extracted positions are member states’ net contributions to the EU per capita and GDP per capita. The net contributions per capita variable is significant in all but three models. The GDP per capita variable is significant in two of three models where the net contributions per capita variable is not significant.Footnote 71 Both these variables capture a redistributive dimension in EU politics, suggesting that EP speech, in part, reflects a national divide over the allocation of resources. The size of a member state measured by its population, however, seems to have little impact on the MEP speech positions. The population variable is only statistically significant in two models. This statistical significance disappears when controlling for the hierarchical nature of the data, while the statistical significance of the other two country-level variables does not (see Appendix B).
Explaining Speech Positions: Ideology and Country Effects

Note: Simex standard errors based on jacknife estimation in parentheses. *p ⩽ 0.1, **p ⩽ 0.05, ***p ⩽ 0.01. Dependent variables are estimated Wordfish positions for each national party. Nominate ideology scores for national parties are for the 5th EP from Hix et al., ‘Dimensions of Politics in the European Parliament’). The other two ideology estimates are from expert surveys (aHooghe and Marks, ‘Chapel Hill 2002 Expert Survey’; and bBenoit and Laver, Party Policies in Modern Democracies) and are estimated with measurement error (using the mean standard deviation of responses across all parties). We use the SIMEX package in R.
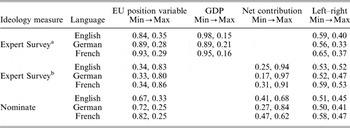
To capture the substantive importance of the variables in determining party positions, we examine how changing one independent variable would affect the movement of a hypothetical party on the speech dimension with regard to all the other parties in the dataset. We create our hypothetical party by setting all variables to their mean except for the party’s position regarding EU integration. We set this variable to its minimum value – the position of the party least favourable towards integration. We then examine the percentage of parties that are estimated to be to the left of this hypothetical party. Next, we reset the hypothetical party’s position regarding integration to the maximum value and again examine how many parties lie to the left of our hypothetical party on our dimension. We do this for all variables of interest and report the results in Table 6.
Change in Party Position (Percentiles) by Varying Independent Variables of Interest

Note: GDP and net contribution are per capita. The changes reported here reflect hypothetical party movements in terms of percentile when varying the independent variable of interest from its minimum value to its maximum value. All other independent variables are set to their means. aUNC (2002); bBenoit and Laver (2006).
Table 6 demonstrates that across all measures and languages, the largest movements in party positions on the speech dimension occur when changing the country-level variables capturing redistribution and the variables capturing a party’s position with regard to EU integration. It appears that the country-level effects are slightly larger than the effects of a party’s position regarding integration. Nevertheless, both variables are very important when assessing the parties’ positions extracted from speech. However, moving the left–right party positions from their minimum to their maximum does not affect the party positions estimated from speech very much at all.Footnote 72
Conclusion
Previously, speeches have been an untapped source of information in the study of the European Parliament. We have estimated positions of national parties and MEPs using word counts from speeches delivered during the 5th European Parliament (1999–2004). The estimated positions reflect parties’ stances with regard to EU integration as well as a strong national dimension. We could not find strong evidence that the estimates reflect parties’ overall left–right positions. We have demonstrated the robustness of these findings using several datasets and statistical models. The basic findings hold regardless of (1) the language of translation used to estimate the positions, (2) the different methods used to estimate left–right and pro-/anti-European positions, (3) the type of statistical model used (OLS, error-corrected OLS, or multilevel regression analysis), and finally (4) the level of analysis (national party or MEP). The individual level analysis confirms that the positions derived from speech most closely reflect the second dimension of Nominate, but include national level factors not found in voting. These robust results are surprising because MEP behaviour has so far been best explained by partisan left–right ideology using roll-call votes as the primary source of data. They suggest that the party ideology reflected in speeches may not be identical to the ideology expressed through voting. Because voting and speaking are subject to different institutional constraints, these different data provide a different picture of ideology in the EP.
Our findings also have implications for users of computer-based text analysis more generally. Such methods enjoy more and more popularity in political science. Combined with electronically available political texts such as party manifestos, legislative speeches, newspaper reports and political blogs, scholars today have immense sources of data to study party systems, political campaigns, legislatures, media and international conflicts. In particular, in comparative politics and international relations, such analysis involves multiple languages. Our study analysed to what extent computer-based content analysis is sensitive to language choice. We examined the robustness of the Wordfish technique using translations of the exact same speeches in the three most common working languages of the EU (English, French and German). Our results suggest that the Wordfish technique is highly robust to the choice of language, as estimated positions correlate highly across these languages.
Our findings open up an exciting avenue of new research on quantitative analysis of political speeches and on democratic politics in the European Union. Legislative speeches offer a valuable data source to study ideology, but the choice of words in speeches is likely to be different from the choice of words in written political texts such as election manifestos. Future studies could, therefore, address which speeches are particularly suited for an analysis of ideology. Studying the incentives and the institutional constraints MEPs face when delivering speeches in the European Parliament will provide deeper insights into when the corpus of speeches accurately represents opinions in the EP and when it reflects biased opinions. Our results, at a minimum, suggest that constraints on speeches are different from the constraints on voting. Even though we did not find strong evidence for left–right ideology in speeches, it may be the case that this matters more in some specific policy areas, and researchers could disaggregate speeches into areas of interest (for example: foreign policy, social policy, economic policy) prior to analysing ideology. In the future, scholars may wish to address these questions in more detail. This may also help us to understand the differences in ideology expressed by legislators through voting and through speaking.
Appendix A: Estimated Speech Positions in the EP, 1999–2004

Appendix B: Explaining Speech Positions: Multilevel Regression

Note: Standard errors in parentheses. Dependent variables are estimated Wordfish positions for each national party. Nominate ideology scores for national parties are for the 5th EP from Hix et al., ‘Dimensions of Politics in the European Parliament’. The other two ideology estimates are from expert surveys (aHooghe and Marks, ‘Chapel Hill 2002 Expert Survey’; and bBenoit and Laver, Party Policies in Modern Democracies). *p ⩽ 0.1, **p ⩽ 0.05, ***p ⩽ 0.01.