I. Introduction
Climate change is likely to affect agricultural systems differently in various parts of the world because it is characterized by strong latitudinal variations (IPCC, Reference Parry, Canziani, Palutikof, van der Linden and Hanson2007, Reference Field, Barros, Stocker, Qin, Dokken, Ebi, Mastrandrea, Mach, Plattner, Allen, Tignor and Midgley2012). Regional studies are, therefore, an essential tool for providing effective simulations of possible impacts in order to plan possible adaptation options aimed at coping with a warmer climate, especially in areas that have been identified as possible hotspots.
The Mediterranean basin has been included as one of those areas, where large climate shifts have already occurred in the past (Luterbacher et al., Reference Luterbacher, Lionello, Malanotte-Rizzoli and Boscolo2006). This area has been identified by future projection studies as one of the most prominent hotspots due to a predicted dramatic increase in temperature, coupled with a decrease in the rainfall rate, especially during the summer (Navarra and Tubiana, Reference Navarra and Tubiana2013). Many studies highlighted the possible consequences of this trend on agricultural productivity on different scales, ranging from the typical general circulation models (GCMs) resolution ( e.g., 350*250 Km) to the regional scale (e.g., 25*25 Km) to the local scale (e.g., Giannakopoulos et al., Reference Giannakopoulos, Le Sager, Bindi, Moriondo, Kostopoulou and Goodess2009; Moriondo et al., Reference Moriondo, Bindi, Kundzewicz, Szwed, Chorynski, Matczak, Radziejewski, McEvoy and Wreford2010, Reference Nakicenovic and Swart2011a). In general, the results indicated that most of the cropping systems will be affected by increasing temperature and drought. Under such conditions, the cropping systems most affected will have a growing cycle covering the spring–summer period, in which the increase in temperature is simulated to be of a higher magnitude compared to the rest of the year (Giannakopoulos et al., Reference Giannakopoulos, Le Sager, Bindi, Moriondo, Kostopoulou and Goodess2009). Under these climatic conditions, particular attention needs to be paid to crops that are typically grown in the region and that play an important role economically and environmentally (Moriondo et al., Reference Moriondo, Giannakopoulos and Bindi2011b).
Grapevine may be included in this group because high-quality wine production is highly dependent on a delicate climate-soil-variety equilibrium (Gaál et al., Reference Gaál, Moriondo and Bindi2012; Jones et al., Reference Jones, White, Cooper and Storchmann2005; Moriondo et al., Reference Moriondo, Jones, Bois, Dibari, Ferrise, Trombi and Bindi2013). Climate change is expected to threaten some components of this interaction, in turn affecting both yield and grape quality (Hannah et al., Reference Hannah, Roehrdanz, Ikegami, Shepard, Shaw, Tabor, Zhi, Marquet and Hijmans2013; Moriondo et al., Reference Moriondo, Jones, Bois, Dibari, Ferrise, Trombi and Bindi2013). A reduction in both yield quality and quantity may then result in gross income reductions for farms and the possible abandonment of areas no longer considered viable for sustainable production (Moriondo et al., Reference Moriondo, Bindi, Fagarazzi, Ferrise and Trombi2011a).
So far, impact studies on grapevine, especially in the Mediterranean basin, have been focused primarily on the possible effect of climate change on phenology (e.g., Webb et al., Reference Webb, Whetton and Barlow2008), change in variety suitability, and shifts in cultivation areas (Hannah et al., Reference Hannah, Roehrdanz, Ikegami, Shepard, Shaw, Tabor, Zhi, Marquet and Hijmans2013; Moriondo et al., Reference Moriondo, Jones, Bois, Dibari, Ferrise, Trombi and Bindi2013; White et al., Reference White, Diffenbaugh, Jones, Pal and Giorgi2006). Several studies, extensively reviewed by Ashenfelter and Storchmann (Reference Ashenfelter and Storchmann2014), focused on the economic impacts of climate change on wine production, particularly regarding fine wines. The latter studies focused on the resulting quality of production (Jones at al., Reference Jones, White, Cooper and Storchmann2005; Moriondo et al., Reference Moriondo, Bindi, Fagarazzi, Ferrise and Trombi2011a; Storchmann, Reference Storchmann2005), the prices of the wines (Ashenfelter et al., Reference Ashenfelter, Ashmore and Lalonde1995; Storchmann, Reference Storchmann2012), and the costs/profits related to wine activity (Ashenfelter and Storchmann, Reference Ashenfelter and Storchmann2010; Webb, Reference Webb2006). The possible changes in crop productivity, resulting from crop growth model simulations, were considered in only a few local studies (Bindi et al., Reference Bindi, Fibbi, Gozzini, Orlandini and Miglietta1996; Moriondo et al., Reference Moriondo, Bindi, Fagarazzi, Ferrise and Trombi2011a). However, this issue is of a major importance, especially for areas that produce premium-quality wines, as fine wines are the result of a fragile balance between soil, grape variety, and climate, which has been achieved over centuries of adaptation, selection, and technological advancement (Jones et al., Reference Jones, White, Cooper and Storchmann2005; Moriondo et al., Reference Moriondo, Jones, Bois, Dibari, Ferrise, Trombi and Bindi2013). Thus, studies that use more comprehensive crop growth simulation models, specifically designed or adapted for grapevine, will greatly promote a better understanding of all the implications of climate change on grapevine.
Based on these premises, in this study, we used a mechanistic model to simulate the development and growth of grapevine in both present and future climatic conditions for areas of the Mediterranean basin that are devoted to the production of high-quality wines. Future grapevine growth duration and yield in these regions were simulated using the outputs of three RCMs, and the results were compared with grapevine performances under present climatic conditions to assess the impact of a changing climate on grapevine cultivation.
II. Materials and Methods
A. Study Area
In this study, the effect of climatic change on grapevine phenology and yield in the Mediterranean basin was evaluated. The region is a transition zone between the temperate and rainy climate of Central Europe and the arid climate of North Africa (Giorgi and Lionello, Reference Giorgi and Lionello2008). The climate is characterized by wet and mild winters and hot and dry summers. Average annual rainfall ranges from 400 to 1,200 mm and is concentrated mainly from November to April. Average temperatures for the warmest month are between 25 °C and 28 °C, whereas those of the coldest month range between 6 °C and 13 °C.
To delineate the study area, the Winkler Index (Amerine and Winkler, Reference Amerine and Winkler1944) was adopted. The Winkler Index is a bioclimatic index used to classify potential wine-growing regions in terms of thermal requirements for grape development and ripening. It is calculated from the sum, over the period from April to October, of the daily average temperature exceeding a base temperature of 10 °C. The analysis was performed for regions in which the Winkler Index, calculated over the 30-year period 1981–2010, ranged from 1,700 to 1,900 °C.
Although, the identification of thermally regulated potential growing regions does not consider many additional factors, such as climate, soil, varietal, and cultural aspects that affect grapevine cultivation in a specific region, White et al. (Reference White, Diffenbaugh, Jones, Pal and Giorgi2006) subdivided the potential distribution of grapevine cultivation into five regions based on their thermal characteristics as expressed by the Winkler Index. According to this classification, the regions selected in this study are better suited to the production of full-bodied dry and sweet wines.
The chosen area included several European and non-European countries, all bordering the Mediterranean basin (Figure 1). The majority of the study area comprised eastern Spain, Italy, the Mediterranean shores of the Balkans, Greece, Turkey, and Bulgaria. Smaller areas were found along the shores of Algeria, in the interior of Morocco, northern Portugal, and southwestern France.
Study Area

B. Grapevine Simulation Model
Grapevine development and growth were simulated using the process-based model developed by Bindi et al. (Reference Bindi, Miglietta, Gozzini, Orlandini and Seghi1997a), already calibrated and validated for the vintages Sangiovese and Cabernet (Bindi et al., Reference Bindi, Miglietta, Gozzini, Orlandini and Seghi1997a, Reference Bindi, Miglietta, Gozzini, Orlandini and Seghi1997b).
The model adopts a simplified mechanistic approach based on the accumulation of growing degree days (i.e., a summation of daily average temperatures above a certain threshold) to estimate the duration of the phenological phases, the radiation use efficiency (RUE) to calculate the daily accumulation of biomass, and a fruit biomass index to simulate the growth of the berries. Crop development is divided into both vegetative and reproductive periods. The former is from bud-break to bloom and is calculated on the assumption that bloom occurs when 13 leaves have appeared on the main shoot. The duration of the reproductive phase (i.e., from bloom to maturity) is assumed to be temperature dependent, and it is calculated using the sum of the daily temperatures above a base temperature of 10 °C.
During the active growth of the crop, the daily biomass accumulation is estimated from photosynthetically active radiation (PAR) intercepted by the canopy and the RUE. Intercepted PAR is calculated from the leaf area index, which, in turn, depends on the total number of shoots per unit area, the rate of leaf appearance, and leaf expansion. The daily fruit growth rate is calculated assuming that the ratio of fruit to total biomass increases linearly during fruit growth. Water stress is included in the model, as it reduces both Leaf Area Index (LAI) growth and RUE (Bindi et al., Reference Bindi, Bellesi, Orlandini, Fibbi, Moriondo and Sinclair2005). Additionally, the effect of enhanced carbon dioxide (CO2) atmospheric concentration on biomass accumulation is considered by linearly increasing the RUE up to +30% for a doubling CO2 (i.e., from 350 parts per million [ppm] to 700 ppm).
C. Climatic Data and Bias Correction
To drive the process-based simulation model in the present and the future periods, daily weather data of minimum and maximum temperatures (Tmin and Tmax, respectively), rainfall (Prec), and global radiation (Rad) were used.
With the aim of taking into account the uncertainty related to climate models, daily data were produced by three regional climate models (RCMs), namely, Italian National Agency for New Technologies, Energy and Sustainable Economic Development (ENEA) (Artale et al., Reference Artale, Calmanti, Carillo, Dell'Aquila, Herrmann, Pisacane, Ruti, Sannino, Struglia, Giorgi, Bi, Pal and Rauscher2010), Max-Planck Institute fuer Meteorologie in Hamburg, Deutschland (MPI) (Elizalde, Reference Elizalde2011), and L'Institut Pierre-Simon Laplace, France (IPSL) (Zou et al., Reference Zou, Zhou, Li and Zhang2010). The RCMs were developed in the European Union (EU) project CIRCE (Climate Change and Impact Research: The Mediterranean Environment) with the aim of producing climate change projections for the Mediterranean region by including a realistic representation of the Mediterranean Sea in the climatic system (Gualdi et al., Reference Gualdi, Somot, Li, Artale, Adani, Bellucci, Braun, Calmanti, Carillo, Dell'Aquila, Déqué, Dubois, Elizalde, Harzallah, Jacob, L'Hélvéder, May, Oddo, Ruti, Sanna, Sannino, Scoccimarro, Sevault and Navarra2013). In all the models, the Mediterranean Sea component is coupled with a high-resolution atmospheric model, for which lateral boundary conditions are provided by global circulation models. The configuration adopted was able to produce daily climatic data from 1951 to 2050 on a uniform horizontal grid spatial resolution of 30 km in ENEA, 25 km in MPI, and 35 km in IPSL. The models were forced over the period 1951–2000, using the observed distribution and concentration of the atmospheric greenhouse gases, while the boundary conditions derived from the SRES scenario A1B were used to force the RCMs over the future period 2011–2050.
To remove any systematic error that might affect each climate model (Haerter et al., Reference Haerter, Hagemann, Moseley and Piani2011), a bias correction of the RCM outputs was done using observed climatic data for the period 1981–2010, extracted from the MARS-JRC archive (http://mars.jrc.ec.europa.eu). The latter is an observational interpolated daily data set with a grid resolution of 25 km, specifically created for agricultural modeling purposes (van der Goot, Reference van der Goot1997). To correct for any bias, each grid cell of the RCMs was first associated with the closer grid cell of the observational dataset, then the deviation (Δ) of the respective data of the two data sets (RCMs and MARS) was calculated based on their monthly values as follows:
 $$\Delta T_M = Avg(T_{M,SIM} ) - Avg(T_{M,OBS} )$$
 $$\Delta P_M \% = \displaystyle{{1/N\sum {P_{M,OBS} - 1/N\sum {P_{M,OBS}}}} \over {1/N\sum {P_{M,OBS}}}} $$
where T is either the minimum or maximum temperature, the subscript M indicates the month of individual data, P is precipitation, and N is the number of years (30). The deviation in daily global radiation (ΔR%) was calculated using a method similar to that of ΔP% in Equation (2).
The final Δ-values were also used for bias correction of the future data sets, assuming that the future differences between observed (MARS-JRC) and modeled (CIRCE RCMs) data would remain consistent.
D. Impact Assessment
To evaluate the impact of expected climate change on the phenology and yield of grapevine, the crop simulation model was applied over two 30-year time slices. The first, from 1981 to 2010, was chosen as the reference period (PP), and the second was the future period (FP) from 2021 to 2050.
To assess the effect of climate change only and allowing point-to-point comparability, the model was applied using the same soil profile and crop management at all sites. More specifically, a loamy soil (50% sand, 20% clay) with an available water content of 125 mm and a plant density of 3,000 plants ha−1 and 8 shoots per plant, grown in rain-fed conditions with no limiting nitrogen, were considered for all the simulations. In agreement with latest observations, the CO2 air concentration level was set at 360 ppm for the present period simulations but was increased up to 530 ppm for the simulations in the future period, as projected from the A1B emission scenario (Nakicenovic and Swart, Reference Nakicenovic and Swart2000).
For each grid point and RCM, the outputs of the models, in terms of phenology and yield, were recorded and averaged over the relevant periods (i.e., PP and FP) and then compared to evaluate the impact.
III. Results
A. Climate Projections
Under the A1B scenario, the projections of the three climate models for the immediate future suggested that important climatic changes in the Mediterranean region will occur. Future projections foresee both warmer and drier conditions than those that are evident in the present period.
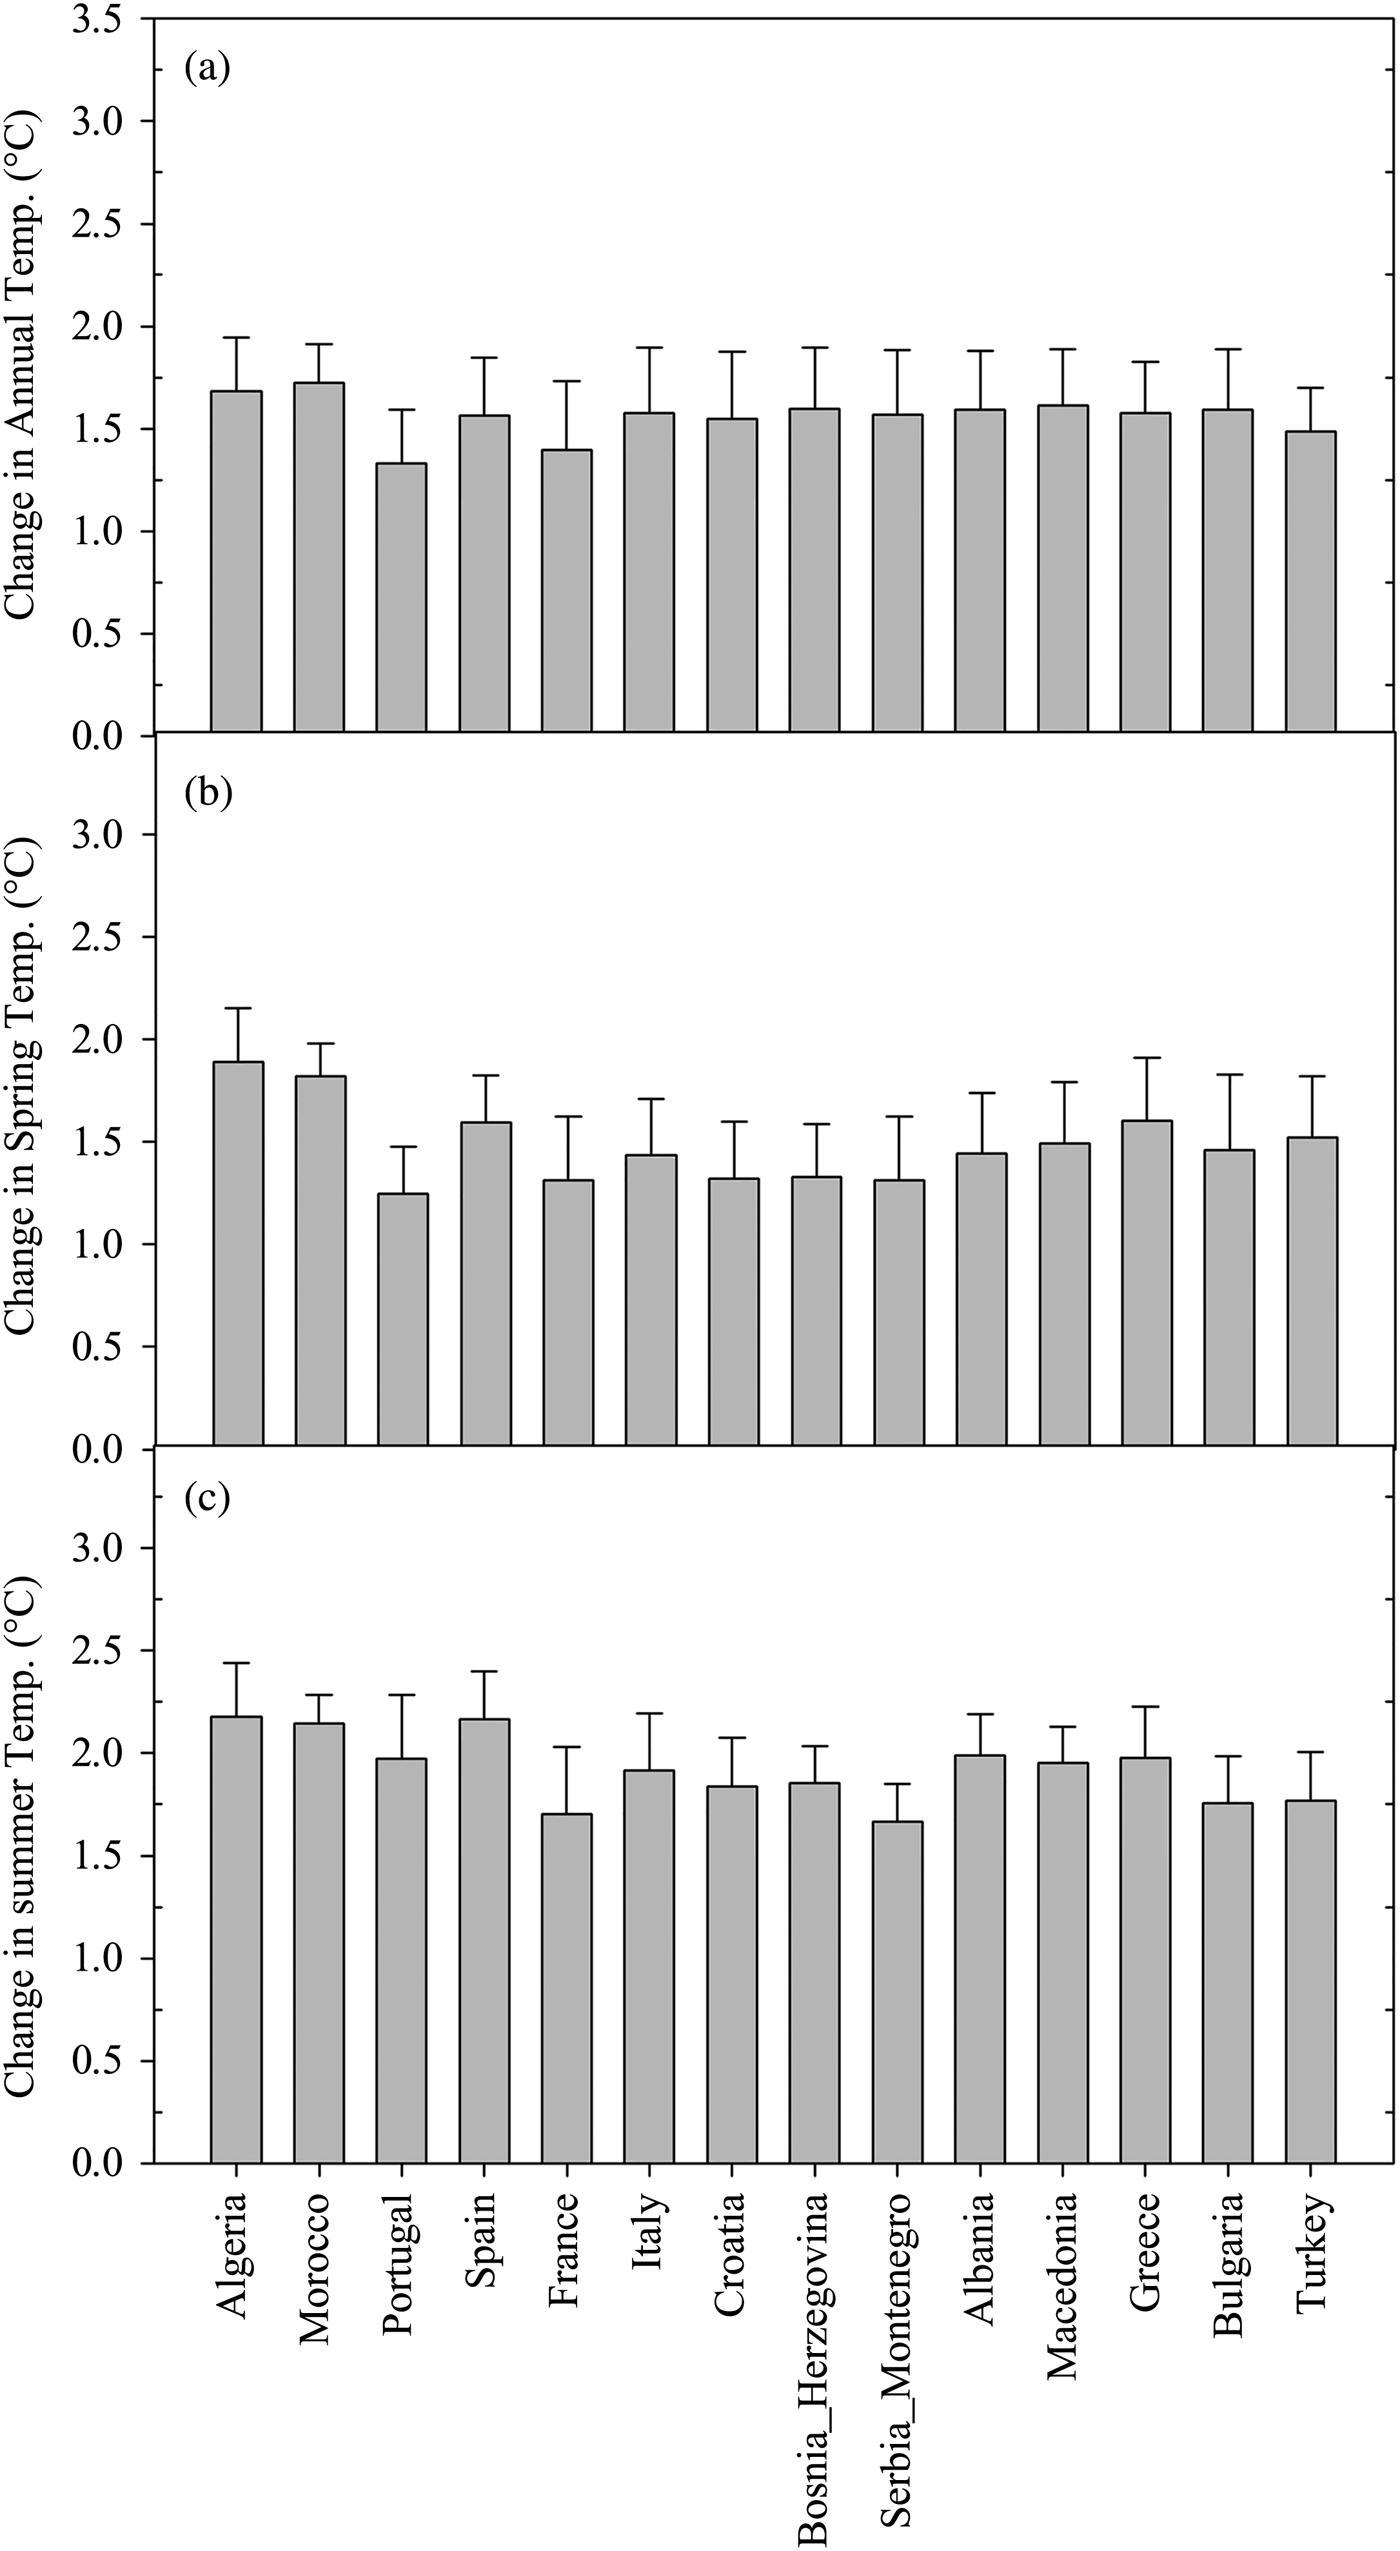
Regarding temperature changes, the models are in agreement, although the magnitude of the projected changes varied slightly depending on the model. On average, the increase in mean annual temperature appears to be relatively uniform across the basin. Mean annual temperatures are projected to increase up to +1.6 °C over most of the study area (Figure 2a). Only in the western fringes of the region are lower increases expected, specifically in Portugal (+1.3 °C) and southern France (+1.4 °C). The increment was not shown to be homogeneous among seasons, being more pronounced during spring (Figure 2b) and summer (Figure 2c). In particular, during spring, higher increases are projected in the southern areas of the basin, while small increments are projected in the northwestern regions and along the shores of the Adriatic Sea. More marked increases are projected in summer over the entire area, but with a higher intensity in the southwestern regions (+2.2 °C in Spain and Algeria) and in the southwestern Balkans (+2.0 °C in Albania, Greece, and Macedonia).
Changes in Annual (a), Spring (b) and Summer (c) Temperature
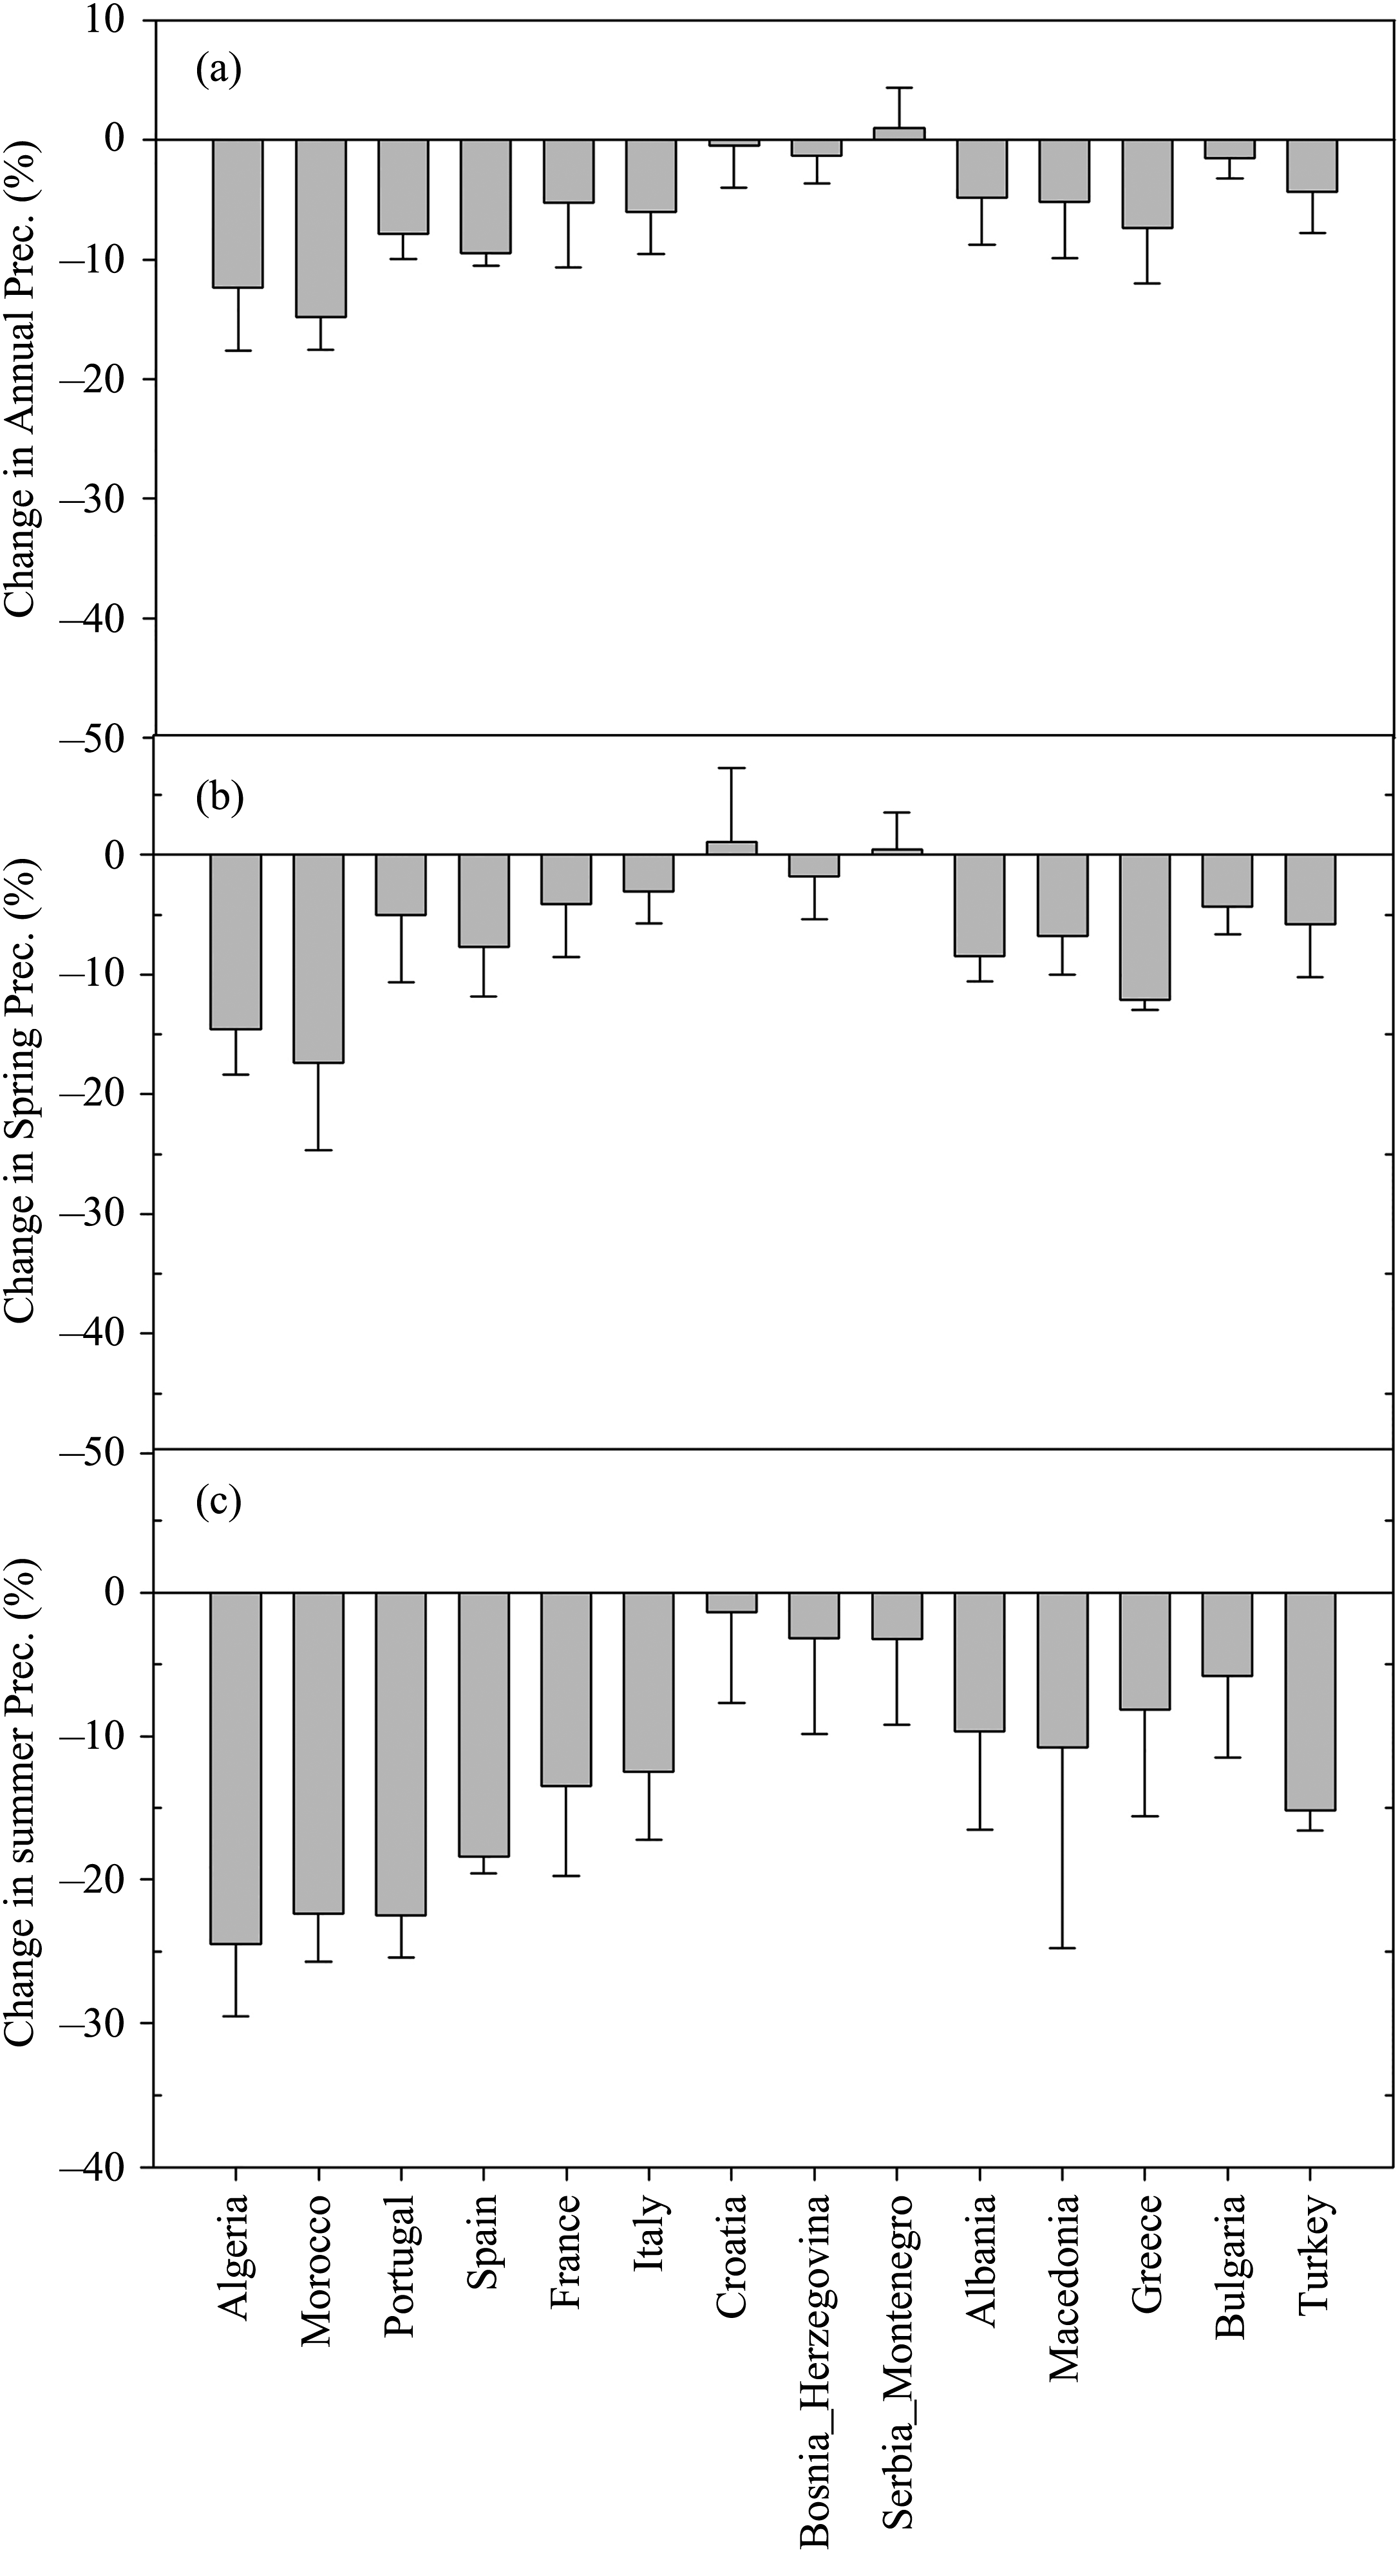
Changes in precipitation revealed a greater variability across the Mediterranean basin. On an annual basis, the models simulated stronger reductions in the western regions, with more than –14% in Morocco and –9.5% in Spain. Lower reductions were simulated in Italy and the southwestern Balkans, while very small variations compared to the present period were reported over the rest of the Balkans (Figure 3a). Similar changes both in magnitude and spatial distribution were evident for spring precipitation (Figure 3b). However, the models simulated the highest and widespread reductions for the summer (Figure 3c). This was evident mainly for North Africa and Portugal, depicting a reduction of more than 30%. Great decrements were also simulated over the southern Balkans for which precipitation was expected to be reduced up to –11%, on average. In contrast, only slight reductions (less than 5%) were simulated in the western Balkans.
Changes in Annual (a), Spring (b), and Summer (c) Precipitation
B. Grapevine Development and Yield
The results of the simulations of the crop model indicated that climate change, as projected by the three RCMs, may have significant impacts on both the development and the growth of grapevine over the Mediterranean basin.
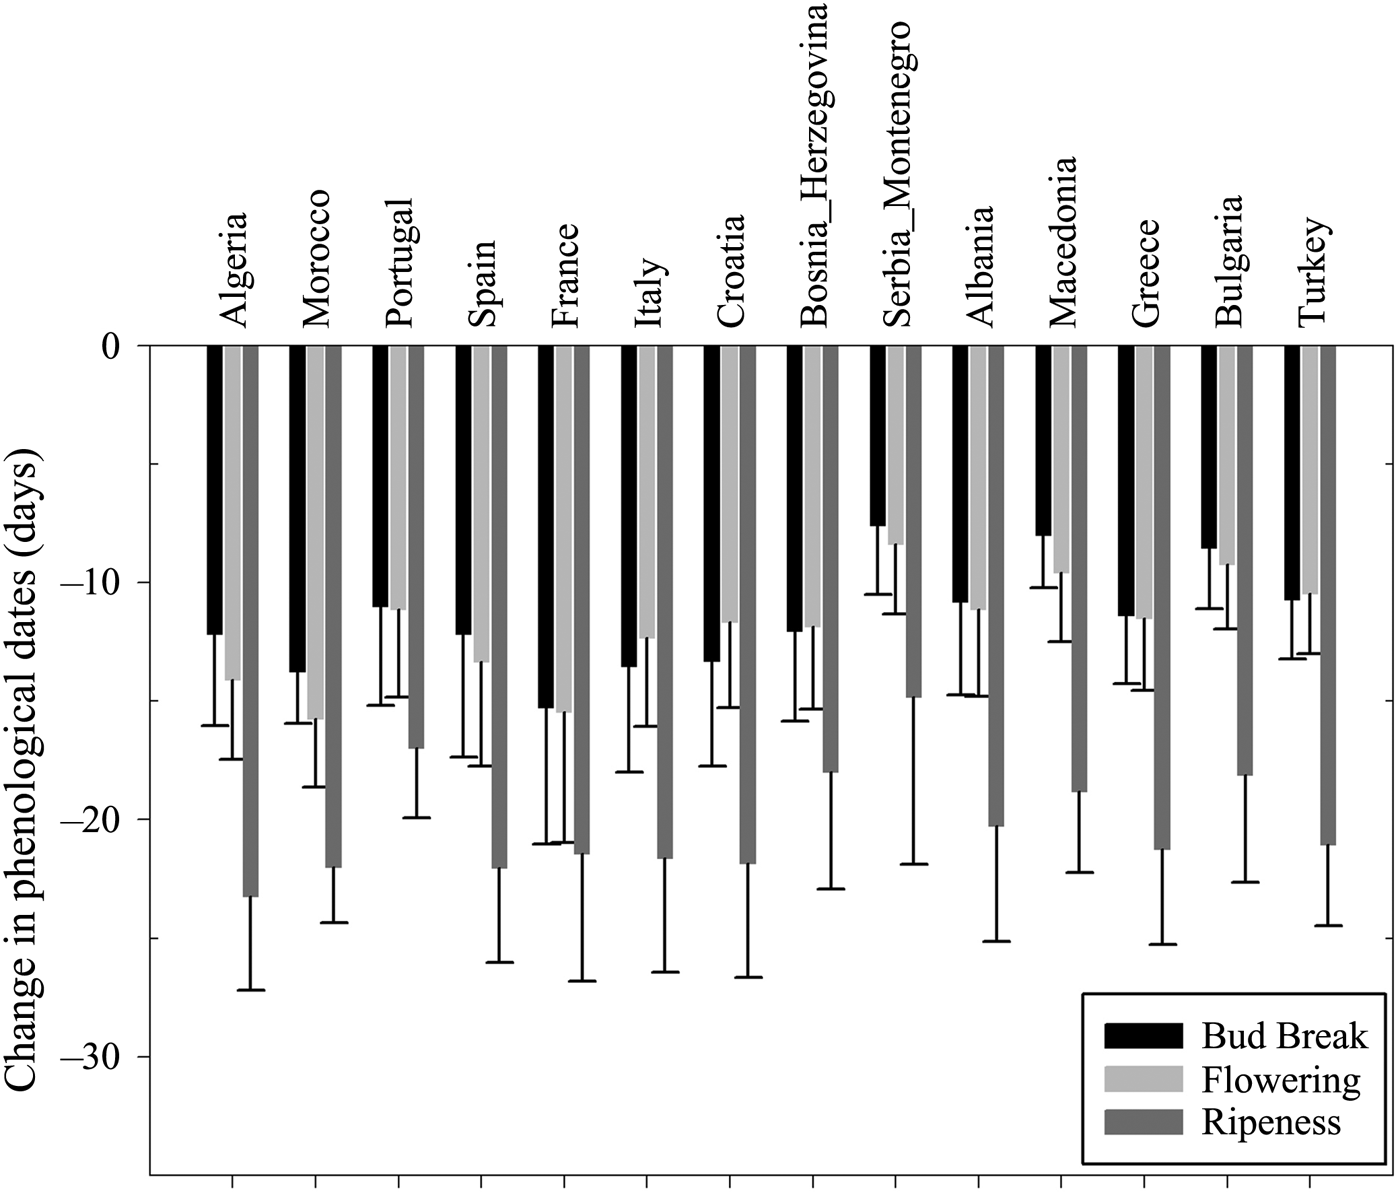
The rate of crop development was accelerated, and this caused advancement in the phenological phase. Bud break was simulated to occur earlier compared to the present period in all models. The advancement of the phase ranged from eight to 15 days, with the greatest changes recorded in the central-western regions of the basin. Similar trends and spatial patterns were observed for the date of flowering, while for ripeness, the advancement was even greater. In general, the maturation stage was predicted to occur between 15 and 23 days earlier than that observed in the present period, with a less defined geographical pattern across the region (Figure 4).
Changes in the Occurrence of the Phenological Phases
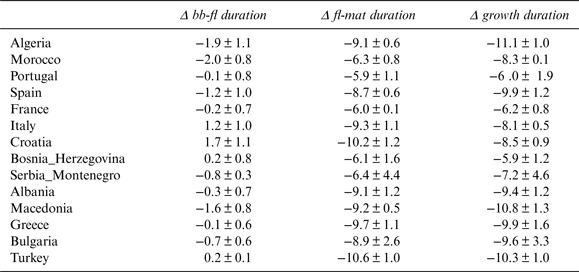
Accordingly, the entire grapevine growth cycle, from bud break to maturation, was shortened, by an average of six days in France and Portugal and ten days in north Africa, Spain, and the southwestern Balkans. Examining the effect of higher temperature on the duration of the different phenological phases, an asymmetric effect was observed. The vegetative phase (from bud break to bloom) was shown to be less affected than the reproductive phase (from bloom to ripeness). More specifically, the duration of the vegetative phase was not significantly changed. Both estimated reductions (in the western regions) and increases (central regions) did not exceed more than two days, compared with present period, in which it was 95 days, on average. On the contrary, the duration of the reproductive phase was both significantly and uniformly shortened (on average by nine days) over the whole study area (Table 1).
Changes in the Duration of the Phenological Phases from Bud Break to Bloom (Δ bb-fl), from Bloom to Ripeness (Δ fl-mat), and the Entire Cycle (Δ growth).
Notes: Changes were calculated as difference (days) between future (2021–2050) and present (1981–2010) periods. Data are average ±1 s.e. of the three RCMs.
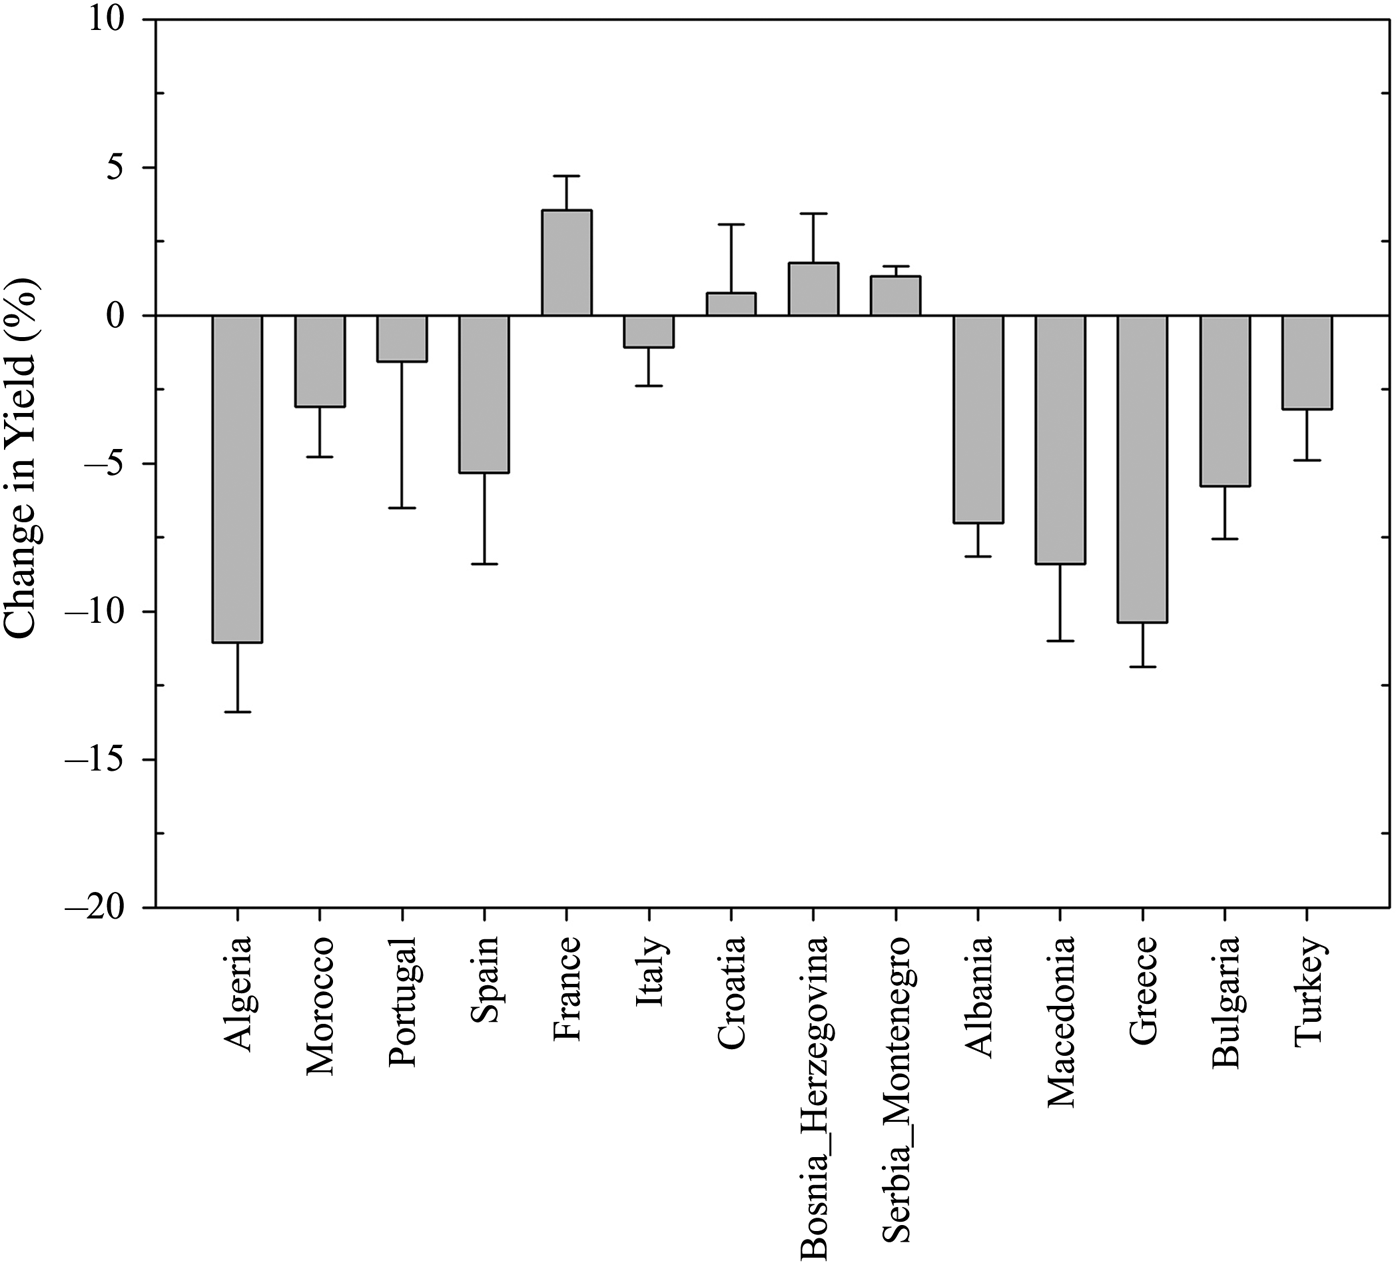
The response of grapevine yields to the future climatic scenario did not reveal a clear pattern. Both marginal increases and decreases were indicated across the study area, depending on the RCM used in the crop model. In Figure 5, the changes in mean grapevine yield, averaged for each country, were reported. Data presented were the average of the three RCMs and were calculated as the percentage difference between future (2021–2050) and present (1981–2010) periods. On average, the yields most affected were in Algeria (–11%) and in the southwestern Balkans (–8.6%). Slightly decreasing yields were simulated in Bulgaria, Morocco, Spain, and Turkey (ca. –4%). Yields were predicted to be substantially unchanged in Italy and Portugal (–1.5% or less) and along the shores of the Adriatic Sea (1.7% or less), while slight increases were recorded in southern France (3.6%) (Figure 5).
Changes in Grapevine Yield
IV. Discussion
In this study we evaluated the response of grapevine, in terms of phenology and yield to projected climate change in the Mediterranean basin. For this purpose, we fed a crop simulation model with the output of three RCMs that specifically accounted for the effect of the Mediterranean Sea on the climate dynamics.
In impact assessment studies, several sources of uncertainty affect the entire process, attributable to both incomplete knowledge of the system we are attempting to model and to the different ways in which the system can be modeled (New and Hulme, Reference New and Hulme2000; Viner, Reference Viner and Beniston2002). In the present study, we faced the uncertainties related to climate modeling by adopting climate models that enhanced the realistic representation of the climate dynamics over the study area (Gualdi et al., Reference Gualdi, Somot, Li, Artale, Adani, Bellucci, Braun, Calmanti, Carillo, Dell'Aquila, Déqué, Dubois, Elizalde, Harzallah, Jacob, L'Hélvéder, May, Oddo, Ruti, Sanna, Sannino, Scoccimarro, Sevault and Navarra2013), thus reducing the uncertainty related to the knowledge of the system. Moreover, we used different models to take into account the structural uncertainty (i.e., related to model structure and the representation of the system within the model), which is an important source of uncertainty (Chatfield et al., Reference Chatfield1995). It is unlikely that one model can perfectly reproduce all the different aspects of the real world. Some models are superior to others in reproducing specific dynamics but, at the same time, may less accurately simulate other aspects. Accordingly, the multimodel approach can provide better performance than a single model simulation, thereby enabling a more objective quantification of any uncertainties (Challinor et al., Reference Challinor, Ewert, Arnold, Simelton and Fraser2009; Randall et al., Reference Randall, Wood, Bony, Colman, Fichefet, Fyfe, Kattsov, Pitman, Shukla, Srinivasan, Stouffer, Sumi, Taylor, Solomon, Qin, Manning, Chen, Marquis, Averyt, Tignor and Miller2007).
The outputs of the selected climate models are in agreement with previous studies (Christensen et al., Reference Christensen, Hewitson, Busuioc, Chen, Gao, Held, Jones, Kolli, Kwon, Laprise, Magaña Rueda, Mearns, Menéndez, Räisänen, Rinke, Sarr, Whetton and Solomon2007; Giorgi and Lionello, Reference Giorgi and Lionello2008). Although there were some differences between the RCMs, likely attributed to the different implementations of the physics within the models (Gualdi et al., Reference Gualdi, Somot, Li, Artale, Adani, Bellucci, Braun, Calmanti, Carillo, Dell'Aquila, Déqué, Dubois, Elizalde, Harzallah, Jacob, L'Hélvéder, May, Oddo, Ruti, Sanna, Sannino, Scoccimarro, Sevault and Navarra2013), the results clearly indicated a trend toward warmer and drier conditions over the entire study area.
This trend will inevitably affect both the development and the growth of grapevine since both phases are regulated by environmental conditions (Jones and Davis, Reference Jones and Davis2000; Pearce and Coombe, Reference Pearce, Coombe, Dry and Coombe2004). The results of our study indicate that the higher temperatures projected by the RCMs for the future period will cause the developmental rate of grapevine to accelerate. This will result in an advancement of the beginning of all phenological phases as well as a shortening of their duration. This trend appears to be in place already. Evidence of earlier bud break, flowering, and maturity, as well as a reduced length of the growing season, are being seen in the various winemaking regions around the world (Mira de Orduña, Reference Mira de Orduña2010; Sadras and Petrie, Reference Sadras and Petrie2011; Webb et al., Reference Webb, Whetton and Barlow2011) and in Europe (Battaglini et al., Reference Battaglini, Barbeau, Bindi and Badeck2009; Fraga et al., Reference Fraga, Malheiro, Moutinho-Pereira and Santos2012, and citations herein). Mira de Orduña (Reference Mira de Orduña2010) also reported a number of studies and observations indicating that harvest time, which for grapevine is highly dependent on the subjective evaluation of optimal fruit composition, had clearly advanced over that in previous decades. A subsequent earlier fruit maturation period was also reported (Mira de Orduña, Reference Mira de Orduña2010).
The shortening of the developmental phases, in turn, reduced the time for biomass accumulation and ripening, affecting the final yield, which is linearly dependent on the duration of the ripening phase (Bindi et al., Reference Bindi, Fibbi, Gozzini, Orlandini and Miglietta1996; Moriondo et al., 2005, 2011; Spaeth and Sinclair, 1984). Additionally, the decreases in rainfall, especially during spring and summer, are likely to cause more frequent and more intense water stress periods during the entire growth cycle of the crop. This may have detrimental effects on both RUE and leaf expansion (Moriondo et al., Reference Moriondo, Bindi, Fagarazzi, Ferrise and Trombi2011a) and, hence, on yield.
However, the increased CO2 atmospheric concentration may partially offset these impacts due to the increased efficiency in the way the grapevine uses both water and radiation, therefore reducing the negative effects of temperature and rainfall changes (Giannakopoulos et al., Reference Giannakopoulos, Le Sager, Bindi, Moriondo, Kostopoulou and Goodess2009; Kimball et al., Reference Kimball, Kobayashi and Bindi2002; Olesen and Bindi, Reference Olesen and Bindi2002).
The different combinations of these factors caused the grapevine response to vary greatly, and this may explain the variation in yield changes found within the study area. In our study, the lowest annual and seasonal rise in temperature and the smallest reduction in rainfall were simulated by the RCMs in southern France and the western Balkans (Figures 2 and 3). Such new environmental conditions are not predicted to be limiting for the crop, which, in turn, may take advantage of the effects of increased atmospheric CO2 concentration. For this region, an overall positive impact with increased yield compared to the present period is predicted. In contrast, the RCMs simulated high temperature increases in combination with significant rainfall decreases for the southern Balkans. Yields are, therefore, predicted to sign decrease significantly, suggesting that environmental conditions, in some regions, might become unfavorable for grapevine cultivation.
These results of our study further support the findings of previous studies that report a likely reduction in areas suitable for winemaking in southern Europe over the next few decades (i.e., Fraga et al., Reference Fraga, Malheiro, Moutinho-Pereira and Santos2013; Jones et al., Reference Jones, White, Cooper and Storchmann2005; Moriondo et al., Reference Moriondo, Jones, Bois, Dibari, Ferrise, Trombi and Bindi2013).
The fragile equilibrium between climate, soil, and varieties that characterize viticulture might then be seriously threatened by climate change. However, we stress that these findings do not take into account any kind of adaptation, not even “blind adaptation” (ti.e., the instinctive adaptation to the climatic conditions implemented by farmers over the centuries). Further studies may suggest and evaluate possible adaptation strategies that can be implemented to cope with the new expected climatic conditions. These should take into account the genetic selection of varieties with enhanced resistance to heat and drought stress that can be used to replace current varieties. The use of more drought-resistant rootstocks should also be investigated.
V. Conclusions
In this study, we assessed the impacts of climate change on the grapevine cultivation over the Mediterranean basin. To take into account the uncertainty related to climate projections, we coupled three RCMs, which were designed specifically for a high-resolution simulation of climate in the Mediterranean region, with a crop growth model.
The results indicated that climate in the entire Mediterranean basin is generally projected to be warmer and drier, particularly during spring and summer. Warmer temperatures, coupled with increased water stress, due to lower precipitation, are expected to affect, with different impacts, both growth and the grapevine production. The effects will include the shortening and the advancement of the phenological phases, with a subsequent reduction in yields, mainly attributable to the reduced time required for biomass accumulation. These effects can be expected for most of the area that is currently suitable for the production of wines, according to the range 1,700–1,900 stipulated by the Winkler Index. Only in a few regions will the new environmental conditions not be detrimental, thereby allowing the crop to benefit from enhanced CO2 and thus resulting in either the maintenance or increase in yield compared to the present.
Further studies are required to explore the efficiency of some adaptation options to cope with projected climate change in the Mediterranean basin.