Growing up in a multicultural and multilinguistic world comes with a great variety of challenges for children. Developmental research has only just begun to investigate the outcomes of contemporary social complexity (super-diversity; Meissner & Vertovec, Reference Meissner and Vertovec2015).
One particular domain that is of specific interest for research and society is the domain of communication: children have to learn which entities words refer to, how to understand their interaction partner's intention, and how to express their own thoughts. These challenges are based on the fact that language itself is ambiguous and needs interpretation (Tomasello, Reference Tomasello2003). Previous research addressing these linguistic challenges has provided evidence for a number of differences between monolinguals and bilinguals. First, bilinguals put different weights on word learning constraints, like mutual exclusivity, because bilinguals cannot rely on the fact that each entity in the world can only have one word attributed to it (Byers-Heinlein, Fennell, & Werker, Reference Byers-Heinlein, Fennell and Werker2013; Davidson, Jergovic, Imami, & Theodos, Reference Davidson, Jergovic, Imami and Theodos1997; Kalashnikova, Escudero, & Kidd, Reference Kalashnikova, Escudero and Kidd2018; Kalashnikova, Mattock, & Monaghan, Reference Kalashnikova, Mattock and Monaghan2015). Second, bilinguals weigh verbal and non-verbal communicative signals (like gestures and language of the interaction partner) differently. In situations where contradicting verbal and non-verbal cues are present, bilinguals preferably consider non-verbal cues over verbal cues (Verhagen, Grassmann, & Küntay, Reference Verhagen, Grassmann and Küntay2017; Yow, Reference Yow2015; Yow & Markman, Reference Yow and Markman2011). For example, when a person points to an object but sits in front of a second object, bilinguals are more likely to follow the deictic gesture while monolinguals more often follow the local salience cue of the person's position (Yow & Markman, Reference Yow and Markman2011). Third, bilingual children do not only perceive communicative signals differently, they also produce communicative signals to a different degree. For example, bilinguals use more gestures when retelling a story compared to monolinguals (Nicoladis, Pika, & Marentette, Reference Nicoladis, Pika and Marentette2009; Pika, Nicoladis, & Marentette, Reference Pika, Nicoladis and Marentette2006; Sherman & Nicoladis, Reference Sherman and Nicoladis2004). Fourth and finally, bilinguals display greater sensitivity to the communicative needs of their interaction partners (Gampe, Wermelinger, & Daum, Reference Gampe, Wermelinger and Daum2019; Wermelinger, Gampe, & Daum, Reference Wermelinger, Gampe and Daum2017; Yow & Markman, Reference Yow and Markman2016).
One important question to be addressed is how these differences in communicative interactions can be explained. Some research suggests that growing up with exposure to two languages per se is critical to this relationship. In particular, bilinguals are more likely to experience challenging communication situations (e.g., being misunderstood; Yow & Markman, Reference Yow and Markman2016). Bilinguals have fewer productive words in each of their languages and are, accordingly, more likely to not verbally understand or produce every intention fully (Bedore, Peña, García, & Cortez, Reference Bedore, Peña, García and Cortez2005; Bialystok, Luk, Peets, & Yang, Reference Bialystok, Luk, Peets and Yang2010; Cattani et al., Reference Cattani, Abbot-Smith, Farag, Krott, Arreckx, Dennis and Floccia2014; Pearson, Fernández, & Oller, Reference Pearson, Fernández and Oller1993). To compensate for this shortcoming, bilingual children might display increased attention to non-verbal cues and more frequently produce non-verbal cues. Furthermore, bilinguals must constantly monitor the language they speak to each individual and choose the appropriate words in this language. This increases their sensitivity to their interaction partners. For this reason, growing up with two or more languages per se leads to more events of challenging communication children are exposed to, which, in turn, is likely to have an effect on their communication style. However, in this line of argumentation, productive language skills are a prerequisite: differences in vocabulary size are thought to play a major role in explaining language group differences (Wermelinger et al., Reference Wermelinger, Gampe and Daum2017; Yow & Markman, Reference Yow and Markman2011, Reference Yow and Markman2016). This raises the present research question as to whether interaction differences between monolingual and bilingual children are evident in their non-verbal interactions at an age before productive language acquisition becomes relevant. If children already show differences in their communication styles depending on their linguistic background before they show sophisticated productive language skills, it would have important implications for our understanding of language and communication development.
To answer this research question, we investigated the interactions between infants and their main caregivers in monolinguals and bilinguals. Infants were tested before productive language acquisition is relevant, at around 14 months. At this age, infants already receive and process a large amount of information via language, but they use language to a very limited extent on their own. Thus, they do not need to select the appropriate language to fit their interaction partner's language and do not yet need to find words to express their intentions. Nevertheless, they do need to coordinate their non-verbal expressions and actions as well as their vocalizations in interactions with their caregivers. Previous research suggests that coordination between an infant and caregiver at a preverbal age is an important feature of language acquisition, and high-quality interaction at this stage is a precursor of successful communication (Dale & Spivey, Reference Dale and Spivey2006; Goldstein, King, & West, Reference Goldstein, King and West2003; Tamis-LeMonda & Bornstein, Reference Tamis-LeMonda, Bornstein, Kail and Reese2002). In contrast, if coordination between the infant and the interaction partner is limited, infants have fewer possibilities to experience joint attention and a common communicative ground, which are additional important prerequisites of fully reading and adapting to the intentions of interaction partners (Tomasello, Reference Tomasello2003).
We investigated the coordination of interactions using the decorated-room paradigm (Liszkowski, Brown, Callaghan, Takada, & Vos, Reference Liszkowski, Brown, Callaghan, Takada and Vos2012) with additional toys to play with during a period of five minutes. To determine the coordination patterns and compare them between monolingual and bilingual infant–parent dyads, we micro-coded all verbal, behavioral, and gestural acts of infants and parents and subsequently used cross recurrence quantification analyses (Cox, van der Steen, Guevara, de Jonge-Hoekstra, & van Dijk, Reference Cox, van der Steen, Guevara, de Jonge-Hoekstra, van Dijk, Webber, Ioana and Marwan2016; Fusaroli, Konvalinka, & Wallot, Reference Fusaroli, Konvalinka, Wallot, Marwan, Riley, Giuliani and Webber2014; Webber & Zbilut, Reference Webber and Zbilut2007). This method characterizes common interactions between two interaction partners and is often used in developmental research on parent–child interactions (Cox et al., Reference Cox, van der Steen, Guevara, de Jonge-Hoekstra, van Dijk, Webber, Ioana and Marwan2016; De Jonge-Hoekstra, Van der Steen, Van Geert, & Cox, Reference De Jonge-Hoekstra, Van der Steen, Van Geert and Cox2016; Fusaroli et al., Reference Fusaroli, Konvalinka, Wallot, Marwan, Riley, Giuliani and Webber2014; Leonardi, Nomikou, Rohlfing, & Rączaszek-Leonardi, Reference Leonardi, Nomikou, Rohlfing and Rączaszek-Leonardi2016; Rohlfing & Nomikou, Reference Rohlfing and Nomikou2014). We quantified the percentage (recurrence rate) and duration (trapping time) of shared behavioral states between parents and infants as the two dependent variables. A high recurrence rate means that the parent and infant often share their behaviors (i.e., both are talking a lot, both explore objects or point to objects a lot), and thus demonstrate high coordination in their interaction. A long trapping time means that the parent and infant are coordinated in their behavior for a long time (i.e., talking long, exploring or pointing to an object long). This behavioral analysis allows us to answer the question of whether dyads differ in terms of which modality (e.g., language, gesture, action) is being used to interact and communicate. It also allows us to test whether monolingual and bilingual dyads differ in the coordination of their interactions.
If exposure to two languages is already relevant to shaping the interactions between infants and their caregivers before productive language acquisition commences, we expect to find differences between monolinguals’ and bilinguals’ interactions with their parents. If challenging communications play a central role in explaining previous differences, we expect to find no difference in interactions at 14 months of age.
Methods
Participants
Sixty-four infants took part in the study. Thirty-four of them were monolingual (the infants received input in Swiss German; 17 female, M = 411 days, SD = 5 days) and 30 were bilingual (the infant received input in Swiss German and one other language; 15 female, M = 412 days, SD = 5 days).
Some bilinguals acquired two languages through their parents and spoke Swiss German and one of the following languages from birth: Albanian (n = 1), English (n = 6), Finnish (n = 1), French (n = 3), Italian (n = 2), Polish (n = 1), Portuguese (n = 2), Romansh (n = 1), Spanish (n = 6), Swedish (n = 1), and Turkish (n = 1). Five more bilinguals heard Italian + English (n = 1), Greek (n = 1), High German (n = 2), and Serbian + Slovenian (n = 1) at home and had input in Swiss German through childcare since birth (n = 4) or since the age of five months (n = 1).
Input in the language(s) was assessed via a parental questionnaire that asked for each span since birth in which a caregiving change occurred, for each day of the week and each interaction partner, and how long the child spends time with this interaction partner. The questionnaire assesses cumulative exposure to all languages heard since birth. Bilingual infants had at least 25% input in each of their languages, but not more than 10% input in further languages (M = 3%, SD = 3.37; 4 infants). Bilingual infants had less input in Swiss German (M = 55%, SD = 2.8) than monolingual infants (M = 96%, SD = 1.5) (W = 17, p < .001).
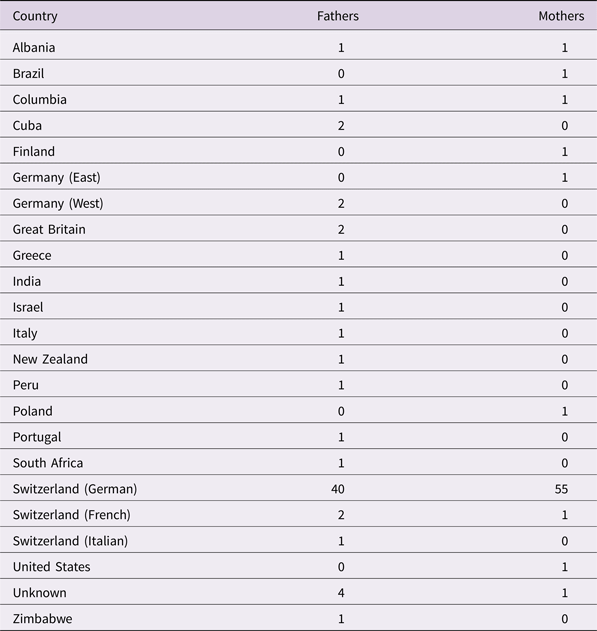
All infants were raised in Switzerland and the parents came from different countries of origin (see Table 1). Parents who accompanied the infants to the study and were the main caregivers consisted of 56 mothers and eight fathers (four fathers of monolingual infants and four fathers of bilingual infants). Most parents had an elevated level of education measured in years of education, and monolingual parents (M = 15.7, SD = 0.3, range = 12–18 years) did not differ from bilingual parents (M = 15.5, SD = 0.3) in education (W = 459, p = .791).
Countries in which parents were born

All procedures were approved by the local research committee and performed in accordance with the ethical standards of the 1964 Helsinki declaration and its later amendments. All parents were recruited from local birth records and gave informed consent. Children received a small toy and a certificate for their participation.
Material
The study was conducted in a room of about 11 square meters. For the set-up, we used the decorated room paradigm by Liszkowski et al. (Reference Liszkowski, Brown, Callaghan, Takada and Vos2012), primarily to evoke vocalizations and gestures in dyadic interactions. As decoration, we used 16 laminated color pictures of animals, plants, vehicles, and eleven additional things mounted on the wall, like a balloon, a feather boa, a blinking light, and so forth. In addition, we prepared a shelf with eight toys to evoke actions. On the shelf, we placed a doll, rattling cubes, a spin top, books, a shape sorter, a puzzle, a ball, and a wooden tower. In front of the shelf, a colorful blanket was placed. Three video cameras were installed in different corners and at different heights in the room. The blinds were lowered for every session and the lights were on to provide constant lighting conditions.
Procedure
The dyadic interaction was conducted as the second of two test sessions. In the prior session, all infants participated in a 15-minute eye-tracking study on communicative signals. The interaction session took place in the decorated room. The parent was instructed to explore the room together with the infant for five minutes. The parent was informed that objects in the shelf can be taken out and objects pinned to the wall should be left in their place. If asked whether the parent should let the infant play on its own, the experimenter answered that the main interest of the study was the interaction between the parent and the infant and repeated the instruction to explore the room together. The parent was asked to carry the infant on their waist when entering the room and to remove the infant's pacifier. The dyad was left alone in the decorated room for 5 minutes. Parents spoke in the language they wanted to use.
Coding
We micro-coded the behavior of all parents and infants from video-recordings of their five-minute interaction. Three interaction modalities were defined: language, gesture, and action. Language modality was defined as all vocalizations produced by the interaction partners (including laughter, cries, groaning, but not coughing or sneezing). Gesture modality comprised whole-hand pointing, reaching, and index-pointing. Action modality was defined as activities directly involving objects (touching, holding, playing with objects, or throwing them away). Behaviors were coded separately for each interaction partner and for each modality. Event times and durations were coded in frames with a frame-rate of 30 frames per second. For action and gesture, we coded the objects involved in this modality. This was not possible for the modality of language due to the fact that referents of linguistic utterances can be underspecified and ambiguous. Similar consecutive behaviors of one interaction partner were coded as separate events if the onset of the subsequent behavior happened more than two seconds (60 frames) after the offset of the preceding behavior. An exception to this rule was made only if the other interaction partner interrupted those similar consecutive behaviors with a behavior of the same modality. Then, the similar consecutive behaviors were coded as separate events, even if they were less than two seconds apart. This rule was valid for all three modalities. One quarter of the sample was coded for reliability by a second coder blind to the research question and hypothesis of the study. Inter-rater reliability coefficients were κ = .766 to .843.
Analyses
All micro-coded data were used for the categorical cross recurrence quantification analyses calculated using R base functions (own code; R Development Core Team, 2008). We analyzed all three modalities: the cross recurrence of action, language, and gesture. In addition, we analyzed the objects used in the modalities of gesture and action. This was done because a high recurrence rate between infants and parents in action, for example, also occurs if the infant is playing with an object and the parent is playing with another object. In this case, both use the same modality. However, if the parent and the infant both played with the same object together, this would be a stronger argument for a shared and coordinated interaction. We calculated recurrence rate and trapping time as measures of the recurrence analysis for each modality across all time frames; that is, for each point in time the behavior of the parent is compared to all points (behaviors) of the child. Recurrence rate was calculated as the percent of time points (frames) where a behavior of the infant matches the behavior of the parent (e.g., parent is gesturing and infant is gesturing). This means that matches between behaviors of all instances in the parent's time series and all instances in the infant's time series are registered. Trapping time was calculated as the average length of frames that a parent and infant shared a behavior.
Results
We investigated differences in coordination during interactions between the language status groups (monolingual and bilingual infants). We analyzed the data with mixed effect models with recurrence rate / trapping time as dependent variables and language status and modality (action, gesture, language)/objects as predictors with the subject as the random factor.
Analyses of language status
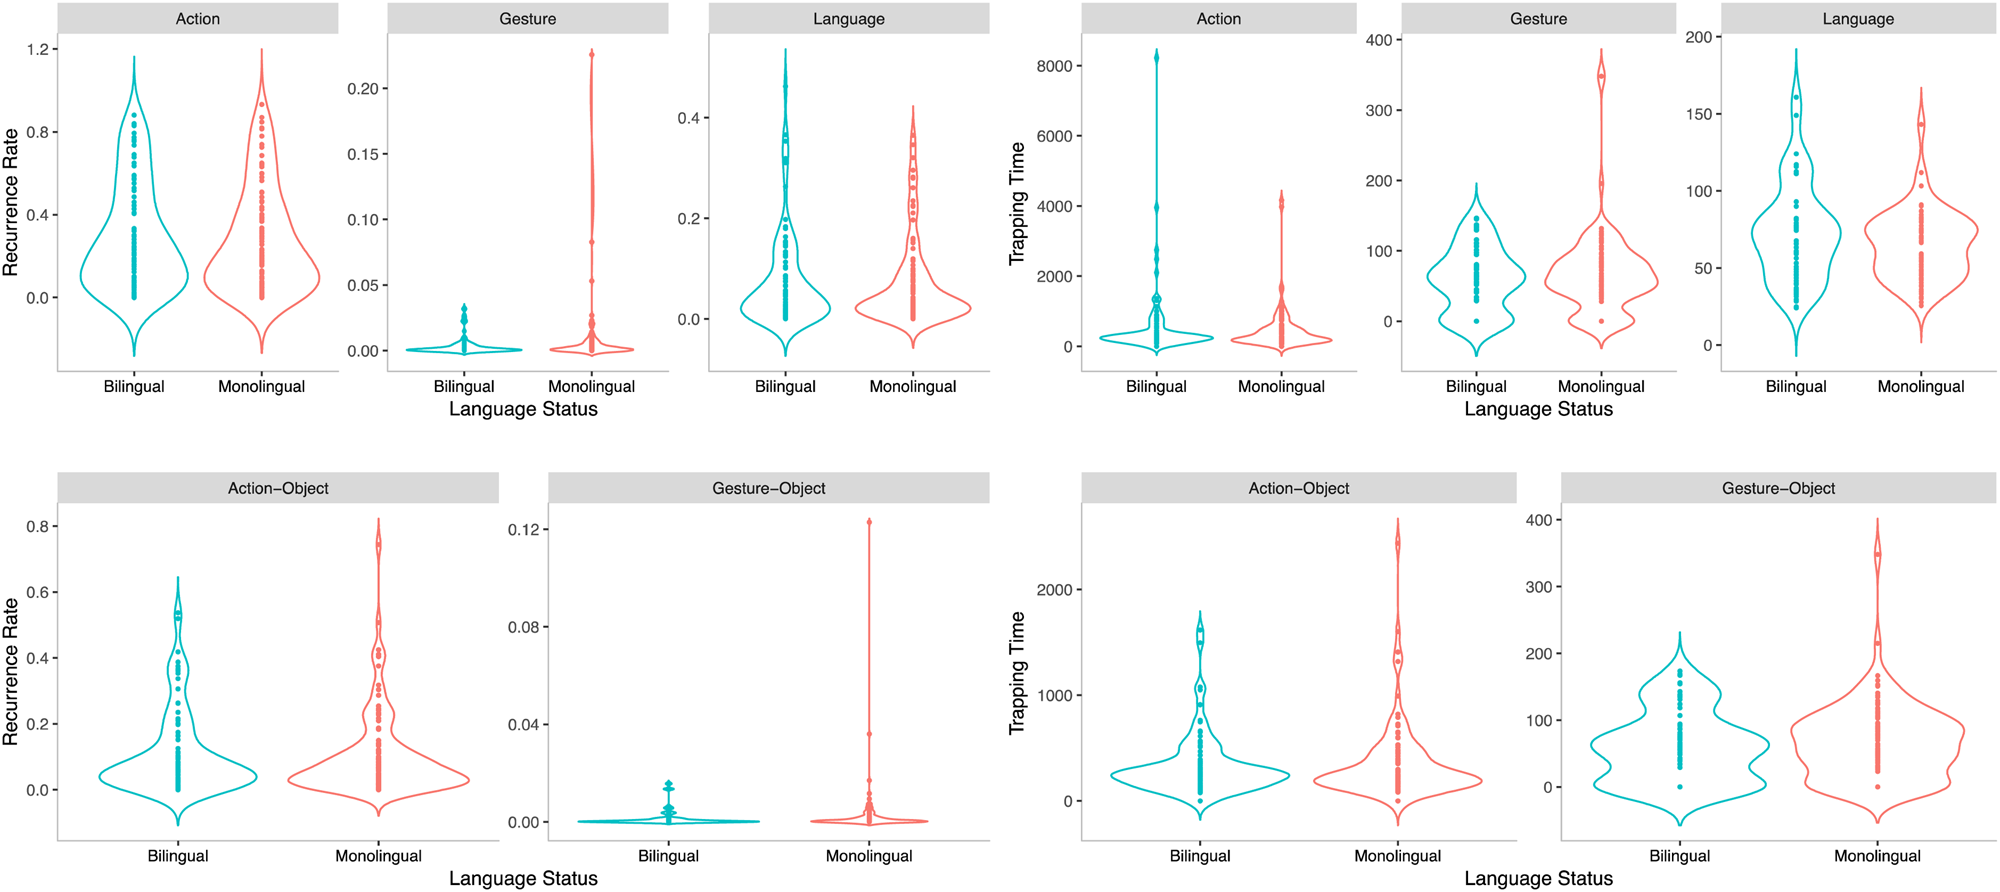
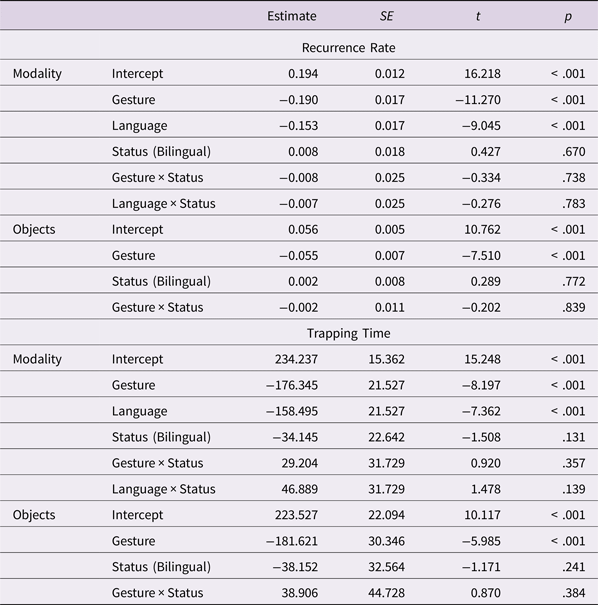
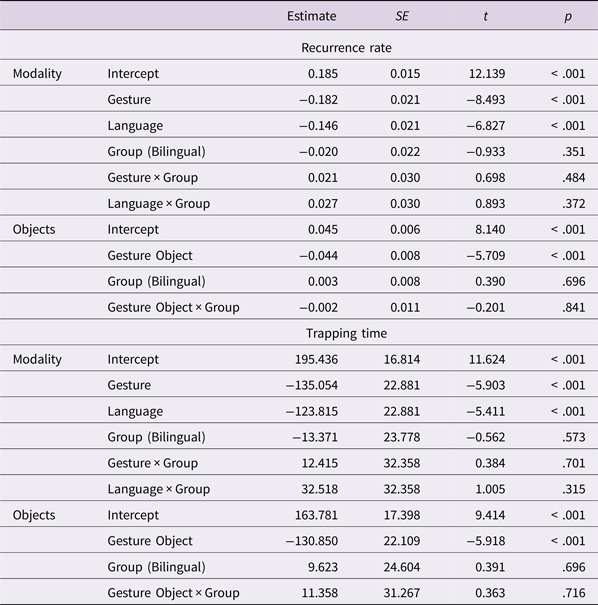
The results of the models for modalities are shown in Table 2. The results show that the modality of action was used most often and longest during interactions between parents and infants, followed by language and gesture; see Figure 1. Results further show no differences in language status. Monolingual and bilingual infants were equally coordinated and remained in a shared state with their parents for an equally long duration. There was also no interaction effect between language status and modality. Thus, monolingual and bilingual infants interacted similarly with their parents.
Recurrence rate (left panel) and trapping time (right panel) of the modalities in the first row and the objects in the second row.

Results of the mixed effects models for the language status comparison

Interim discussion
We investigated differences in the coordination of interactions between monolingual and bilingual infants with their parents using the decorated-room paradigm. Results show that both groups were similarly coordinated in their interactions. The fact that, at the age of 14 months, no differences in interactions were found suggests that challenges in the bilinguals’ expressive verbal communications could explain why older bilinguals show advantages in communicative situations (Wermelinger et al., Reference Wermelinger, Gampe and Daum2017; Yow & Markman, Reference Yow and Markman2011, Reference Yow and Markman2016).
However, the sample used in the present study compared a monolingual sample with infants who had all acquired the same language to a bilingual sample with a heterogeneous mix of languages in addition to the monolingual language. This heterogeneity in the bilingual language status group might have diminished all potential differences. Furthermore, some parents who participated with their bilingual infant spoke the same language as the monolingual sample (n = 20) while some parents spoke another language (n = 10). This resulted in the fact that some of the bilingual infants interacted with their Swiss parent during the study, and some of the bilingual infants interacted with their non-Swiss parent. These aspects could have substantially influenced the results of the current study. In terms of the different communication styles connected to different cultures (Graham & Argyle, Reference Graham and Argyle1975; Hall, Reference Hall1989; Ting-Toomey, Reference Ting-Toomey1999), the infants might have adjusted their communication style to the culture of the person currently available. Given the fact that, of all bilingual infants, most infants interacted with their Swiss parent while only a minority interacted with their non-Swiss parent, the present results might have been biased towards the monolingual language and/or culture. For this reason, we added two additional analyses of the present sample to test to what extent the skewedness of the sample had an influence on the results.
First, we compared monolingual and bilingual infants who had a Swiss parent as the main caregiver during the performance of the interaction task (language group comparison). In this subsample, the language and culture of the interaction partner was held constant to make the comparison between monolinguals and bilinguals even more balanced than in the language status comparison reported before. The only difference between the two groups of infants was whether they will grow up monolingual or bilingual.
Second, we focused on the bilingual language group and compared infants who participated with their Swiss parent to bilingual infants who participated with their non-Swiss parent (culture group comparison). In this subsample, the language status was held constant; that is, all children were bilingual. The only difference between the two groups of infants was the cultural background of their interaction partners. In case the culture of the current interaction partner has a substantial influence on the children's non-verbal communication (Bornstein et al., Reference Bornstein, Tamis-LeMonda, Tal, Ludemann, Toda, Rahn and Vardi1992; Fouts, Roopnarine, Lamb, & Evans, Reference Fouts, Roopnarine, Lamb and Evans2012; Kärtner et al., Reference Kärtner, Keller, Lamm, Abels, Yovsi, Chaudhary and Su2008; Lancy, Reference Lancy2008; Richman, Miller, & LeVine, Reference Richman, Miller and LeVine1992), the culture group comparison should reveal differences between parents of different cultures. It is important to note here that the results of this comparison have to be interpreted with caution because the size of the two samples is small.
Analyses of language and culture group
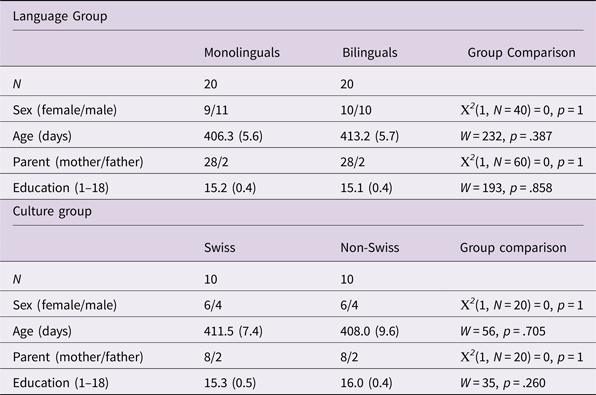
From the whole sample described in the ‘Methods’ section above, we created two subsamples: one language group sample and one culture group sample. Please refer to Table 3 for an overview of the characteristics of the two samples. The sample for the language group comparison consisted of 20 bilingual children with a Swiss main caregiver as the participating parent who were compared to 20 monolingual Swiss infants matched by age, gender of infant, gender of parent, and education. The sample for the culture group comparison consisted of all 10 bilingual infants with a non-Swiss main caregiver as the participating parent who were compared to 10 monolingual infants matched by age, gender of infant, gender of parent, and education with a Swiss parent as the main caregiver and participating parent. The countries in which the non-Swiss parents were born are the following: Germany (East), Poland, Switzerland (French-speaking), United States, Columbia, Brazil, Finland, Albania, and Cuba.
Demographics of subsamples. Numbers in brackets depict the SE.
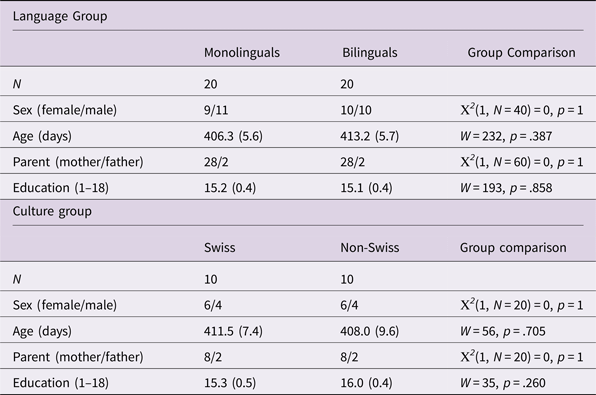
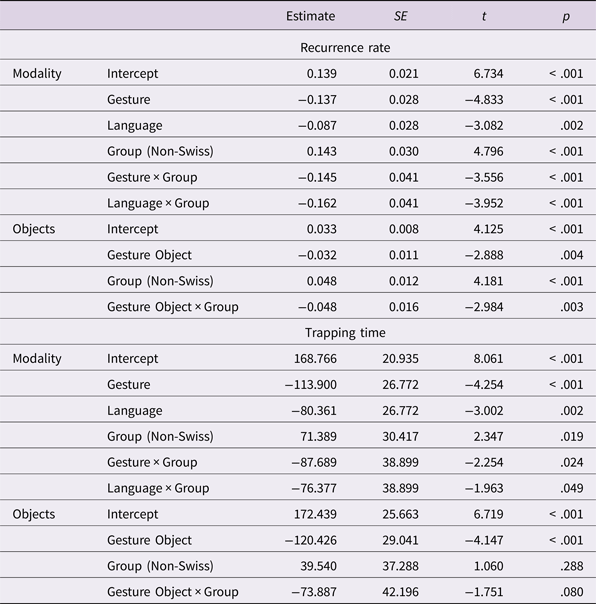
We analyzed the data again with mixed effect models with recurrence rate / trapping time as dependent variables and language group / culture group and modality (action, gesture, language)/objects as predictors, with subject as the random factor. The results of the models for modalities can be seen in Table 4 and the results of the models for the objects can be found in Table 5.
Results of the mixed effects models for the language group comparison

Results of the mixed effects models for the culture group comparison

Language group comparison
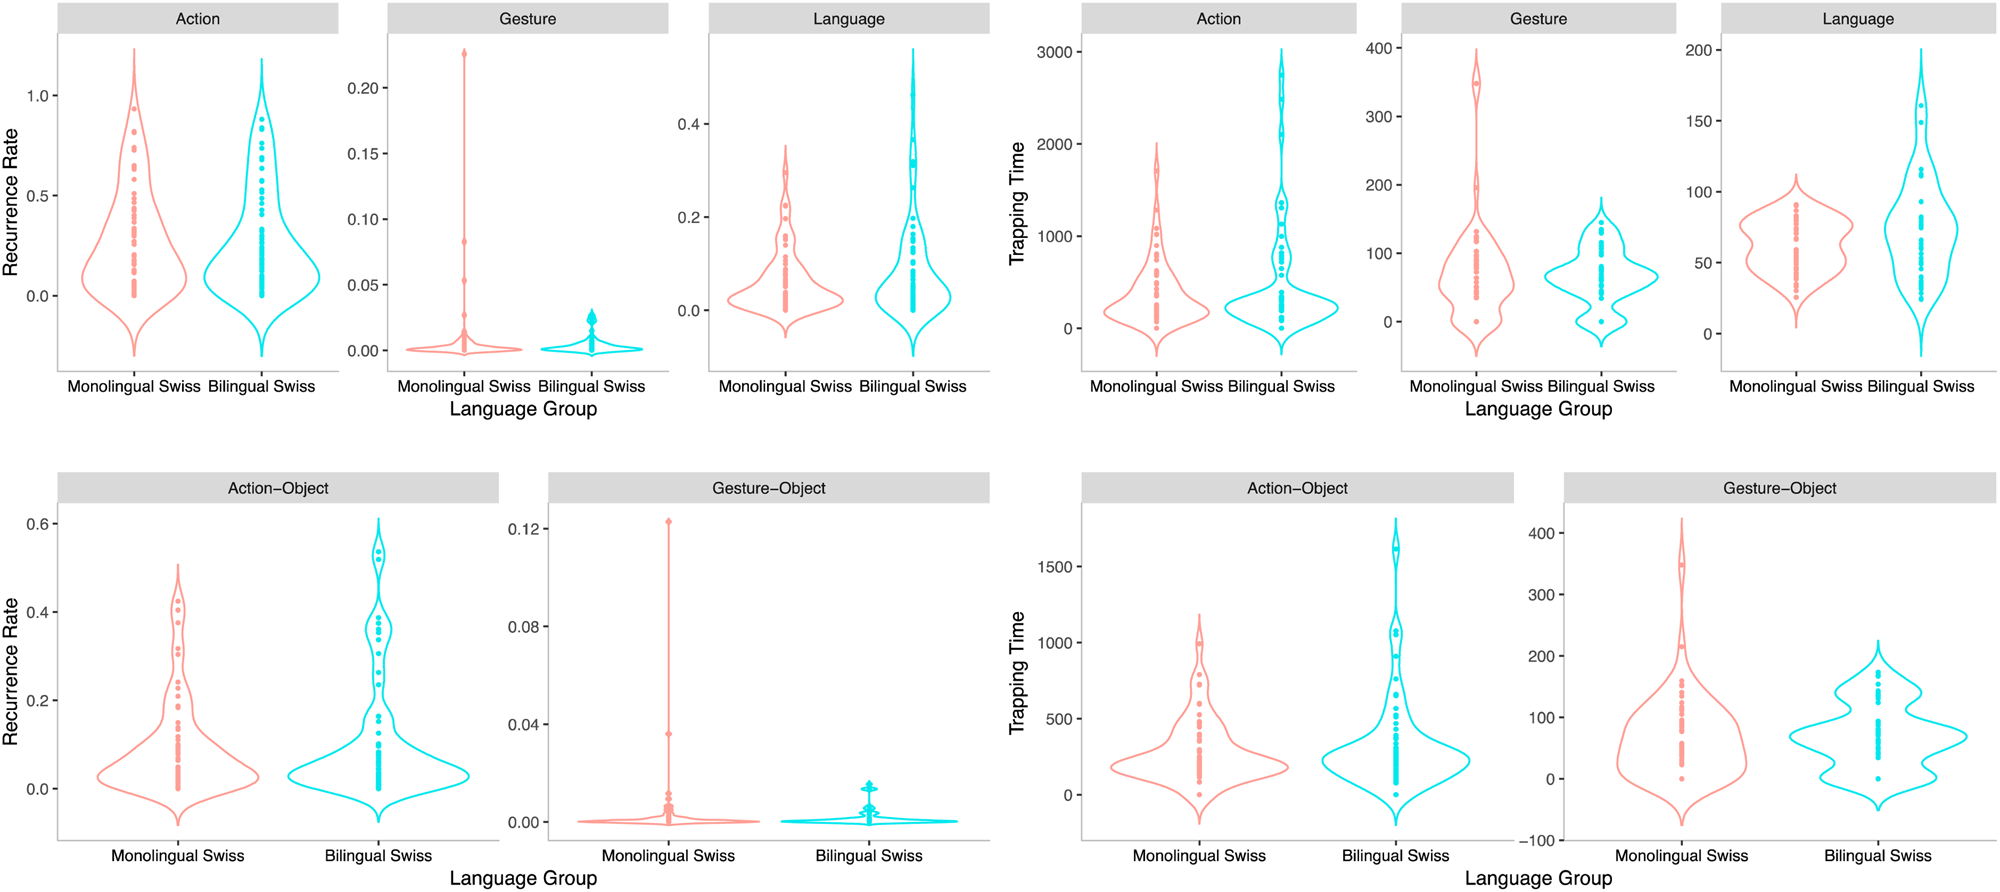
In the language group comparison, there were no differences between language groups in terms of recurrence rate and trapping time, neither for modalities nor for objects in action and gesture; see Figure 2.
Recurrence rate (left panel) and trapping time (right panel) of the modalities in the first row and the objects in the second row for the language group comparison.

Culture group comparison
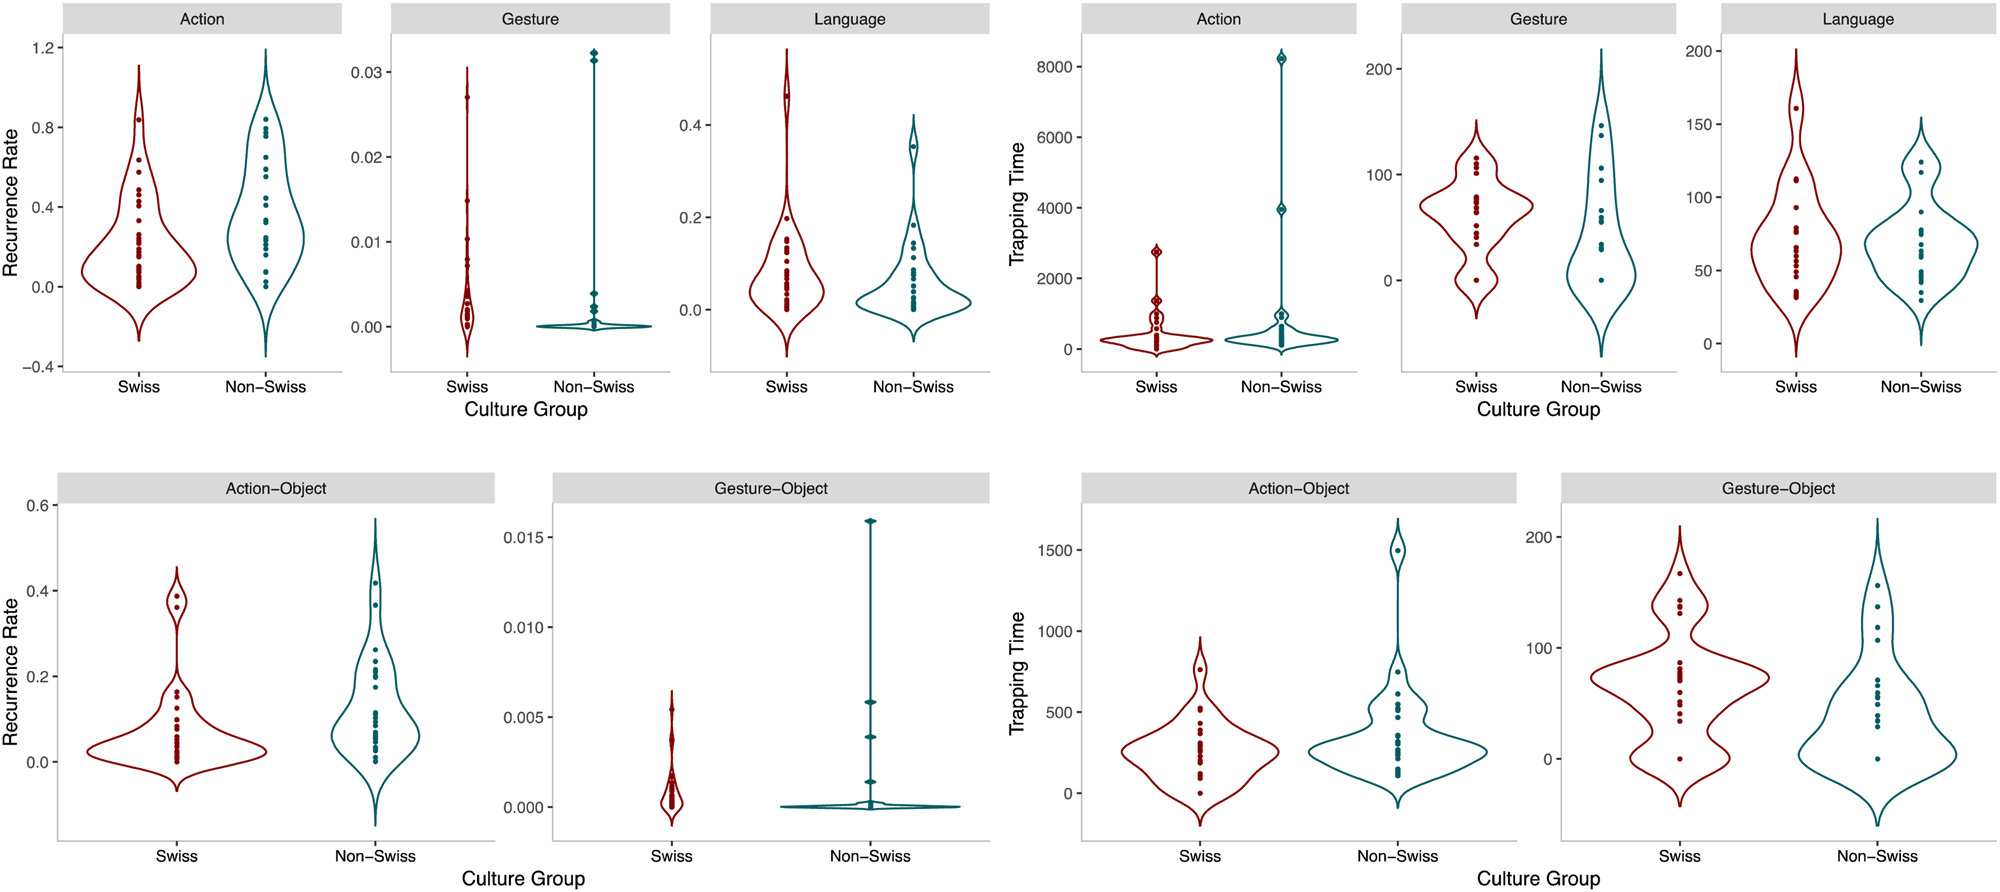
In contrast, in the culture group comparison, culture group was a significant predictor for recurrence rate and trapping time in the modality model and for recurrence rate in the object model. All models with the culture group as the significant predictor also had interaction effects with the other modalities involved. The results of the recurrence rate in the modality model (Figure 3) show that, in the Swiss culture group, dyads used shared states of action (M = 0.139, SE = 0.021) most often, followed by language (M = 0.052, SE = 0.021) and gesture (M = 0.002, SE = 0.021). This pattern was similar in the non-Swiss group, but the actual values differed, showing that the non-Swiss group used more shared action states than the Swiss group (M = 0.282, SE = 0.022), followed by language (M = 0.033, SE = 0.021) and gesture (M < .001, SE = 0.022).
Recurrence rate (left panel) and trapping time (right panel) of the modalities in the first row and the objects in the second row for the culture group comparison.

The results of the trapping time in the modality model show that, in the Swiss culture group, dyads spent the longest time in shared states of action (M = 168.766 frames, SE = 20.935), followed by language (M = 88.405, SE = 20.935) and gesture (M = 54.865, SE = 20.935). This pattern was similar in the non-Swiss group, but the actual values differed, showing that the non-Swiss group showed longer shared action states than the Swiss group (M = 240.155, SE = 22.067), followed by language (M = 83.417, SE = 22.067) and gesture (M = 38.565, SE = 22.067).
Summarized, the results in the modality model show that the Swiss culture group (bilingual infants interacted with their Swiss parent) was less coordinated than the non-Swiss group (bilingual infants interacted with their non-Swiss parent), and shared the same behavior for shorter times. This is especially evident in the modality of action, showing that non-Swiss group dyads acted more often and were coordinated for a longer period of time than the Swiss group.
The results of the recurrence rate for specific objects show that, in the Swiss culture group, dyads used a shared object most often in the action modality (M = 0.033, SE = 0.008), followed by the gesture modality (M = 0.039, SE = 0.008). This pattern was similar in the non-Swiss group, but the actual values differed, showing that the non-Swiss group used a shared object more often in action (M = 0.081, SE = 0.008), followed by gesture (M = 0.022, SE = 0.008).
Summarized, the results show that the Swiss culture group was less coordinated and was coordinated for a shorter period of time than the non-Swiss group. In the modality of action, the non-Swiss group dyads acted more often together on the same object than the Swiss group. There were no differences in the duration of shared objects.
Discussion
The aim of the present study was to investigate the coordination of interactions between parents and infants in 64 dyads of monolingual and bilingual infants at the age of 14 months, around the onset of their productive language acquisition. In particular, we investigated whether the communicative differences found in older bilingual children (e.g., Wermelinger et al., Reference Wermelinger, Gampe and Daum2017; Yow & Markman, Reference Yow and Markman2011) are already evident in the interactions with their parents at an earlier age. We investigated the coordination between parents and their infants in terms of shared behavior as important precursors of verbal language development. The results showed that differences in interactions were evident neither in the overall sample nor in the sample of monolingual and bilingual infants when they interacted with their Swiss parent. Thus, comparing bilinguals with varying backgrounds or bilinguals with the same language and culture to monolinguals did not produce different patterns: The interactions across the language groups were comparable. Further results suggest that bilingual infants showed more frequent coordinated actions and coordinated for a longer period of time when the parent was non-Swiss compared to when the parent was Swiss. This resulted in an overall higher number of coordinated interactions in non-Swiss dyads. This pattern was less evident when looking at which objects the dyads were using. Here, we found a similar difference for how often they used the same object, but no difference in the durations of use of the shared object. This suggests that, once dyads used the same object, both groups did so for the same amount of time, but overall non-Swiss dyads more often used the very same object in the interaction compared to Swiss dyads.
These results show that monolingual and bilingual infants interact in a similar way with their main caregivers and especially when the caregivers share the same language and culture. These findings thus suggest it is not language status per se – that is, being monolingual or bilingual – that affects how infants interact with their parents. However, when taking the parents’ cultural background into account, the pattern of results changed. The culture of the interacting caregivers was a predictor of the interaction with their bilingual infants. The interactions of infants with their Swiss parents differed from the interaction with the non-Swiss parent with respect to rate and duration of coordination. Please note that, given the small number of dyads and the heterogeneity in the bilingual sample with parents coming from nine different countries speaking eight different languages, these findings have to be interpreted with care. Nevertheless, they converge with other results on differences between infants from various cultural backgrounds that are evident before productive language skills become important (Bornstein et al., Reference Bornstein, Tamis-LeMonda, Tal, Ludemann, Toda, Rahn and Vardi1992; Fouts et al., Reference Fouts, Roopnarine, Lamb and Evans2012; Kärtner et al., Reference Kärtner, Keller, Lamm, Abels, Yovsi, Chaudhary and Su2008; Lancy, Reference Lancy2008; Richman et al., Reference Richman, Miller and LeVine1992). All cultures are said to show maternal sensitivity to the infants’ and children's needs; that is, how a parent perceives and interprets a child's signals and responds to them in an appropriate way (Emmen, Malda, Mesman, Ekmekci, & IJzendoorn, Reference Emmen, Malda, Mesman, Ekmekci and IJzendoorn2012; Kärtner, Keller, & Yovsi, Reference Kärtner, Keller and Yovsi2010; Mesman et al., Reference Mesman, Minter, Angnged, Cissé, Salali and Migliano2018). But cultures differ in how exactly caregivers respond to infants’ signals (Bornstein et al., Reference Bornstein, Tamis-LeMonda, Tal, Ludemann, Toda, Rahn and Vardi1992; Fouts et al., Reference Fouts, Roopnarine, Lamb and Evans2012; Kärtner et al., Reference Kärtner, Keller, Lamm, Abels, Yovsi, Chaudhary and Su2008; Lancy, Reference Lancy2008; Richman et al., Reference Richman, Miller and LeVine1992). For example, in independent cultures, the sense of sight is used more often, whereas in interdependent cultures, the sense of touch is used more often in interactions (Kärtner et al., Reference Kärtner, Keller, Lamm, Abels, Yovsi, Chaudhary and Su2008). Furthermore, verbal responsiveness, face-to-face communication, and smiling are largely absent in many communities (Lancy, Reference Lancy2008). In our sample, Swiss parents and non-Swiss parents differed in how often and how long they used the same modality as their infant, and also in how often they used the same object as their infant. Together with the lack of variation across the comparisons of language groups, this suggests that the significance of exposure to one or two languages is lower in interactions prior to productive language acquisition (Yow, Reference Yow2015; Yow & Markman, Reference Yow and Markman2011, Reference Yow and Markman2016).
The differences between culture groups found in our sample can have an effect on whether bilinguals are advantaged or disadvantaged when compared to monolinguals in other studies. If the monolingual infants are proficient at a specific skill because socialization in this culture puts greater emphasis on this ability, then it is likely that a comparison to bilinguals will show disadvantages for bilinguals. One domain where studies showed conflicting evidence is inhibitory control (for recent reviews, see Adesope, Lavin, Thompson, & Ungerleider, Reference Adesope, Lavin, Thompson and Ungerleider2010; Barac, Bialystok, Castro, & Sanchez, Reference Barac, Bialystok, Castro and Sanchez2014). Thus, if cultural differences are at play, advantages or disadvantages might be harder to find in comparisons between monolinguals and bilinguals depending on the composition of the two groups. Recent research has shown, for example, that the variations in the context (e.g., the reliability of the environment) has a substantial influence on children's delay-of-gratification performance (Kidd, Palmeri, & Aslin, Reference Kidd, Palmeri and Aslin2013).
The indicated cultural differences found between the two groups of bilinguals in our sample might have long-term consequences. The longer phases within one modality and the higher number of coordinated states can lead to different experiences. One such difference can be the variability in communication styles. While some cultures are more direct (Hampden-Turner & Trompenaars, Reference Hampden-Turner and Trompenaars2000), the communication styles of other cultures in our sample might have been more indirect, thus leading to subtle differences in action and object manipulation. These slightly different experiences of longer shared behaviors might, for example, influence the infant's attention to different cues. Communicative cues such as gesturing or pointing become more salient compared to more local cues such as a sitting position, and thus can explain the differences found between monolinguals and bilinguals (Yow & Markman, Reference Yow and Markman2011). These more frequent interactions and longer shared communications might even lead to better adaptation to communication partners (Wermelinger et al., Reference Wermelinger, Gampe and Daum2017; Yow, Reference Yow2015; Yow & Markman, Reference Yow and Markman2016) because infants with a high number of coordinated interactions can take in more detail about their interaction partner as each modality has a longer duration. These insights are in line with previous research suggesting that bilinguals have different experiences than monolinguals, but it may also be that these experiences are not solely driven by their language group and other factors may contribute to the identified advantages of bilinguals. In fact, other differences have been shown between monolingual and bilingual infants which might be attributed to enhanced cognitive flexibility and decreased cognitive specificity (Bosch & Sebastián-Gallés, Reference Bosch and Sebastián-Gallés2003; Brito & Barr, Reference Brito and Barr2012; Ferjan Ramírez, Ramírez, Clarke, Taulu, & Kuhl, Reference Ferjan Ramírez, Ramírez, Clarke, Taulu and Kuhl2017; Kovacs & Mehler, Reference Kovacs and Mehler2009; Mercure et al., Reference Mercure, Kushnerenko, Goldberg, Bowden-Howl, Coulson, Johnson and MacSweeney2019). Alternatively, differences in communication by the parents might also be attributed to differences centering around being in a community that does not speak your nature language versus being native to the community language. Parents who migrated to another country might adapt similar emphasis on non-verbal communication cues as do bilinguals who do not have the same productive language skills as their peers (Gampe, Wermelinger, & Daum, Reference Gampe, Wermelinger and Daum2019; Yow & Markman, Reference Yow and Markman2011, Reference Yow and Markman2016). Future research needs to investigate whether the differences found between monolinguals and bilinguals can be attributed to differences between language groups, and/or to cultural groups, and/or to other factors such as being non-native in a community language.
Furthermore, it is interesting to investigate whether the differences also extend to other interaction partners the child knows, as well to interaction partners that the child is not yet familiar with. Recent research has begun to investigate the differences in interactions between infants and mothers versus fathers and other family members (Bridgett et al., Reference Bridgett, Ganiban, Neiderhiser, Natsuaki, Shaw, Reiss and Leve2018; Cabrera, Volling, & Barr, Reference Cabrera, Volling and Barr2018; Hallers-Haalboom et al., Reference Hallers-Haalboom, Mesman, Groeneveld, Endendijk, van Berkel, van der Pol and Bakermans-Kranenburg2014; Lucassen et al., Reference Lucassen, Tharner, Van IJzendoorn, Bakermans-Kranenburg, Volling, Verhulst and Tiemeier2011; Zeegers et al., Reference Zeegers, Vente, Nikolić, Majdandžić, Bögels and Colonnesi2018). For parenting practices, data showed that mothers are more sensitive and less intrusive than fathers (Hallers-Haalboom et al., Reference Hallers-Haalboom, Mesman, Groeneveld, Endendijk, van Berkel, van der Pol and Bakermans-Kranenburg2014). From cross-cultural research, we already know that cultures differ in how they guide their infants in participating in interaction and the number of caregivers an infant communicates with (Fouts et al., Reference Fouts, Roopnarine, Lamb and Evans2012; Rogoff et al., Reference Rogoff, Mistry, Göncü, Mosier, Chavajay and Heath1993; Whaley, Sigman, Beckwith, Cohen, & Espinosa, Reference Whaley, Sigman, Beckwith, Cohen and Espinosa2002). It is possible that we found no difference between monolingual and bilingual infants and their Swiss parent because both interaction partners are tuned into their own style of interaction. Thus, a future study should include both mothers and fathers or other main caregivers to see how the interaction partners shape the communicative interactions.
Taken together, the present findings show no universal difference in the dyadic communication of monolingual and bilingual children with their parents when comparing caregivers with the same cultural background. It is thus not mere exposure to two languages per se that serves as the basis for potential differences in the communication of monolinguals and bilinguals. It is rather a multidirectional interplay between a number of different factors, such as language, culture, and cognition, to name only a few, that need to be considered as well.
Materials
All materials and data are available via osf: <https://osf.io/9qcby/>.