The management of hypoplastic left heart syndrome with an intact atrial septum or severely restrictive inter-atrial communication presents a challenge for the clinician and is associated with high mortality.Reference Rychik, Rome, Collins, DeCampli and Spray 1 – Reference Vlahos, Lock, McElhinney and van der Velde 4 Several different measures have been attempted at various centres for urgent decompression of the left atrium to alleviate severe hypoxia and acidosis and diminish left atrial hypertension. This has been carried out with marginal success.Reference Vlahos, Lock, McElhinney and van der Velde 4 – Reference Du Marchie Sarvaas, Trivedi, Hornberger, Jin Lee, Kirsch and Benson 10 Prenatal recognition of restrictive or intact atrial septum in foetuses with hypoplastic left heart syndrome provides an opportunity to plan the delivery and immediate postnatal intervention. Pulmonary venous Doppler flow patterns in foetuses with hypoplastic left heart syndrome have been correlated with an intact atrial septum or severely restrictive inter-atrial communication in the postnatal period. Studies have shown that in foetuses with hypoplastic left heart syndrome, a pulmonary venous Doppler forward/reverse velocity time integral ratio is a strong predictor of the need for emergent left atrial decompression in the newborn period.Reference Michelfelder, Gomez, Border, Gottliebson and Franklin 11 , Reference Divanovic, Hor, Cnota, Hirsch, Kinsel-Ziter and Michelfelder 12 It is, thus, crucial to identify the at-risk foetus for accurate prenatal counselling and postnatal management. A multidisciplinary approach in the management of these neonates was institutedReference Javois, Van Bergen, Cuneo and Husayni 13 in two centres. The policy was to deliver the baby in or close to the cardiac catheterisation laboratory by cesarean section and carry out immediate transcatheter intervention to create an adequate inter-atrial communication for neonates who were prenatally diagnosed to have hypoplastic left heart syndrome with an intact atrial septum or severely restrictive inter-atrial communication. Our hypothesis was that by using this approach early left atrial decompression may help improve survival. The primary objective of this study was to review the outcomes of utilising this approach. The secondary objective was to assess the predictive value of a foetal pulmonary venous Doppler index to identify at-risk foetuses with hypoplastic left heart syndrome that may need emergent postnatal cardiac intervention.
Materials and methods
In this study, we included newborns with hypoplastic left heart syndrome born over a 5-year period in two centres. Hypoplastic left heart syndrome was defined as the presence of mitral atresia and aortic atresia, mitral stenosis and aortic atresia, or severe mitral stenosis and aortic stenosis along with a hypoplastic left ventricle. All of them had mitral and aortic valve annulus diameter Z scores ⩽4. All the cases with additional or other cardiac anomalies, including hypoplastic left heart syndrome with ventricular septal defect, unbalanced atrioventricular septal defect, double-outlet right ventricle with mitral and aortic atresia or stenosis, critical aortic stenosis, and endocardial fibroelastosis with normal or large left ventricle, were excluded from this study. The neonates were subclassified into three groups. Group 1 included neonates with hypoplastic left heart syndrome with an adequate inter-atrial communication. Group 2 included neonates with a prenatal diagnosis of hypoplastic left heart syndrome with an intact atrial septum or severely restrictive inter-atrial communication. Group 3 included neonates with a severely restrictive inter-atrial communication who were not prenatally diagnosed. Patients in Group 3 were all transferred from other centres after postnatal diagnosis. The primary end point was survival to bidirectional Glenn, stage 2 palliation. Mortality or heart transplantation before the bidirectional Glenn was considered treatment failure.
For neonates with hypoplastic left heart syndrome with an intact atrial septum, we classified the atrial morphology into three distinct types as proposed by Rychik et al:Reference Rychik, Rome, Collins, DeCampli and Spray 1
-
1. Type A: Relatively large left atrium with a thick septum secundum and a thin septum primum adherent to each other.
-
2. Type B: A small, muscular left atrium with circumferential thickening of atrial walls and a thick “spongy” muscular atrial septum without ostensible distinction between the septum .primum and the septum secundum.
-
3. Type C: A giant left atrium with a thin, rightward bulging, septum primum and secundum and severe mitral regurgitation.
Foetal echocardiograms were routinely performed at both centres. The foramen ovale was assessed in all foetuses with hypoplastic left heart syndrome. Colour Doppler was used to confirm its patency. The foramen was considered restrictive if the maximum diameter was ⩽2.5 mm (⩽5th percentile of ⩾20 weeks of gestation) with continuous high-velocity flow (>60 cm/second). Doppler flow pattern in the pulmonary vein was obtained by placing the sample volume over a pulmonary vein in the lung parenchyma or at its junction with the left atrium using colour flow to guide positioning. Normal pulmonary vein flow is composed of forward flow in ventricular systole and diastole, with cessation of flow or small A-wave reversal during atrial systole. The velocity time integral for forward and reverse pulmonary vein flow was measured, and the ratio of the averaged reverse and forward flow was calculated as a percentage (velocity time integral reverse/forward flow×100) in all patients. In foetuses with serial foetal echocardiograms, only the most recent study was used for the analysis.
Postnatal clinical management protocol
We instituted a carefully timed multidisciplinary approach including various subspecialties in both centres. In centre 1, when a prenatal diagnosis of hypoplastic left heart syndrome with an intact atrial septum or severely restrictive inter-atrial communication is made, the baby is electively delivered in the cardiac catheterisation suite #2 via C-section by the obstetrician. The baby is then immediately brought to cardiac catheterisation suite #1, which is 10 feet across the hallway. In centre 2, it is not feasible to deliver the child in the catheterisation laboratory. The baby is electively delivered in the women’s hospital and transported immediately to the cardiac catheterisation suite in the children’s hospital across the street. The neonate is intubated by the neonatologist, cleaned by the nursing team, anaesthetised by the paediatric cardiac anaesthesiologist, and sterilely prepped by the cardiac catheterisation team. The cardiac surgeons and extracorporeal membrane oxygenation specialists are available in the suite. If the patient’s condition deteriorates during or after the catheterisation, neck access is obtained via cut down. The interventional cardiologist uses a radiofrequency perforating wire to create an inter-atrial communication followed by either balloon septoplasty or stent implantation across the inter-atrial septum under fluoroscopy and transoesophageal echo guidance. The patient is transferred to the Cardiac Intensive Care Unit for further stabilisation after adequate inter-atrial mixing and left atrial decompression is documented. Choice of the type and timing of further palliation are based on the clinical condition of the baby.
Statistical analysis
Patient and procedural variables were assessed for association with outcomes. Normally distributed, continuous variables were expressed as mean±standard deviation. Skewed, continuous variables were expressed as median and range. Categorical variables were expressed as a number with a percentage of the total. A χ2 analysis was used to test for differences in categorical variables, and the Wilcoxon rank sum test was used for continuous variables. Analysis of variance was used to analyse the differences between group means and their associated procedure. In addition, the Bonferroni method was used for correcting for multiple comparisons. Survival analysis was performed using the Kaplan–Meier product limit method for all subgroups of patients. COX regression on survival was then performed to see whether there was a real difference when other confounding factors were accounted for. Univariate analysis was carried out using a p-value of <0.05. Significant factors were entered into a multivariate logistic regression model to assess their independent impact. SPSS-22.0.1 for Mac (SPSS Inc., Chicago, Illinois, United States of America) was used for statistical analysis.
Results
Demographics
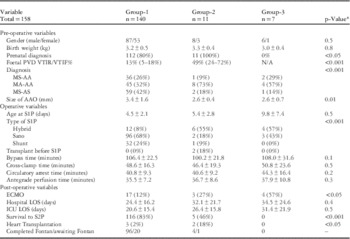
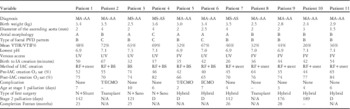
Over a 5-year period, there were 170 neonates with hypoplastic left heart syndrome admitted and managed between the two institutions: 19 (11.2%) of them had an intact atrial septum or severely restrictive inter-atrial communication. Prenatal diagnosis was available for 120 of the 151 neonates in Group 1 (80%). Of the 19 neonates, 12 (63%) were diagnosed prenatally (Group 2) and underwent immediate transcatheter intervention, whereas seven neonates did not have a prenatal diagnosis and were transferred in from other centres (Group 3). The demographics of the patients in all three groups along with the interventions and outcomes are detailed in Table 1.
Comparison of variables between the three subgroups.

AAO=ascending aorta; ICU=Intensive Care Unit; LOS=length of stay; S1P=stage 1 palliation; S2P=stage 2 palliation
* Comparing Groups 1 and 2
Foetal pulmonary vein Doppler findings
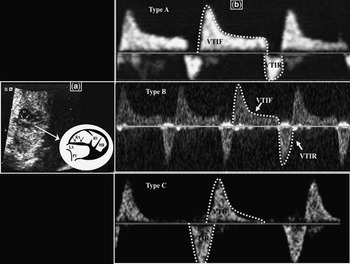
The 12 patients in Group 2 had a total of 26 foetal echocardiograms between gestational ages of 26 and 38 weeks (median 32 weeks). All had a foramen ovale ⩽1 mm in diameter; 12 patients from Group 1 with 24 foetal echocardiograms between gestational ages of 22 and 38 weeks (median 30 weeks) were used as controls. The median velocity time integral reverse/forward flow percentage in Group 2 was 49% (range 24–72%), which was significantly higher (p<0.05) compared with Group 1 (median 13%, range 5–18%); three pulmonary vein Doppler flow patterns were recognised in foetuses with hypoplastic left heart syndrome (Fig 1). Type A flow consisted of continuous forward flow during systole and early diastole with a velocity time integral reverse/forward flow percentage ⩽18%. Type B flow consisted of continuous forward flow with an increased A-wave reversal (velocity time integral reverse/forward flow per cent >18% ⩽65%), and Type C flow consisted of brief to and fro flow with minimal or no early ventricular diastolic flow (velocity time integral reverse/forward flow per cent >65%). All the patients in Group 1 had Type A pulmonary vein Doppler flow pattern. In Group 2, nine foetuses had Type B flow pattern at the latest foetal echo, and three foetuses had Type C flow pattern. Foetal pulmonary vein Doppler velocity time integral reverse/forward flow percentage of >18% (sensitivity, 1, 95% CI, 0.58–1; specificity, 1, 95% CI, 0.96–1) was predictive of an intact atrial septum or a severely restrictive inter-atrial communication.
Transabdominal foetal echocardiogram. ( a ) Foetal 2D echocardiogram demonstrating thickened, intact inter-atrial septum in the presence of hypoplastic left ventricle at 28 weeks of gestation. ( b ) Foetal Doppler flow interrogation of the pulmonary vein showing three different pulmonary vein Doppler patterns (Type A, B, and C). Arrows=atrial septum; LA=left atrium; MB=moderator band; PV=pulmonary vein; RA=right atrium; RV=right ventricle.

Postnatal anatomy
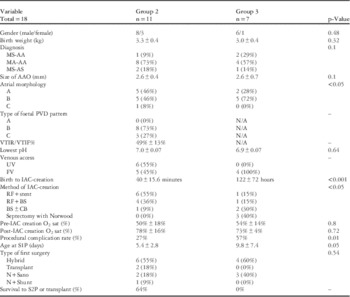
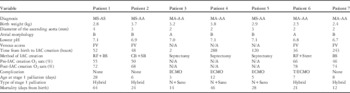
In Group 2, six neonates had Type A atrial morphology, five had Type B, and one had Type C atrial morphology (Table 2). In Group 3, two patients had Type A and five had Type B atrial morphology. Of those with Type A atrial morphology, three patients had a decompression pathway; two patients with Type B and none with Type C atrial morphology had any form of decompression pathway leading away from the left atrium. There was one patient in Group 3 who also had partial anomalous pulmonary venous return to the ductus venosus along with hypoplastic left heart syndrome and severely restrictive inter-atrial communication. Ventriculo-coronary connections also called coronary sinusoids occur exclusively with the mitral stenosis-aortic atresia subtype (the incidence was 56%). The difference in anatomy and outcomes of patients in Groups 2 and 3 are detailed in Table 2.
Comparison between patients in Groups 2 and 3.

BS=balloon-septoplasty; CB=cutting balloon; FV=femoral vein, N=Norwood; N/A=not applicable; PV=pulmonary vein; RFP=radiofrequency perforation; UV=umbilical vein
Catheter intervention
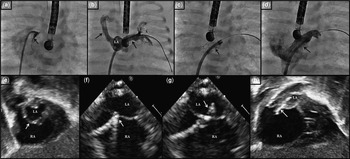
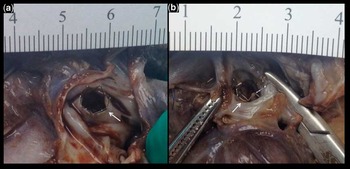
In Group 2, seven neonates were delivered in the catheterisation suite at centre 1. The remaining five delivered in centre 2 were transported from the women’s hospital to the catheterisation suite in the children’s hospital within a median time of 17 minutes (range 14–21 minutes) from delivery. All of them underwent immediate catheter intervention. All except one had radiofrequency perforation to create an intra-atrial communication that was further balloon dilated; seven of them required an intra-atrial stent implantation to keep the inter-atrial communication widely patent (Figs 2 and 3). In Group 3, four of the seven neonates had catheter intervention, whereas three neonates had surgical septectomy on extracorporeal membrane oxygenation. Umbilical venous access was used in six of the first seven patients; however, more recently, ultrasound-guided femoral venous access is the preferred approach. The median time from delivery to the creation of an unobstructed Inter-atrial communication for neonates belonging to Group 2 was 42 minutes (range 17–67 minutes) and for Group 3 it was 122 hours (range 36–288 hours). None of the patients required extracorporeal membrane oxygenation support before catheterisation in Group 2, whereas three patients required extracorporeal membrane oxygenation support post-procedure secondary to cardiac tamponade that was managed with pericardiocentesis in each case without subsequent sequelae. Tables 3 and 4 provide the description of the patients in Groups 2 and 3.
Fluoroscopy and 2D Echocardiogram. ( a ) Contrast staining of the inter-atrial septum (arrow) shows an intact septum that is bowing towards the right atrium. ( b ) After radiofrequency perforation of the intact atrial septum with a sheath now across it. Angiogram demonstrates dilated right and left pulmonary veins (arrow) that fill retrograde from the diminutive left atrium. The pulmonary venous tributaries appear dilated and tortuous. ( c ) After stent implantation across the inter-atrial septum (arrow). ( d ) After stent implantation across the inter-atrial septum (arrow). Angiogram demonstrates unobstructed left-to-right shunt. ( e ) Postnatal 2D transthoracic echocardiogram shows a hypoplastic left atrium. Arrow points to the intact atrial septum that is thickened and bowing to the right. ( f ) TEE demonstrating the radiofrequency perforating wire (arrow) intending the atrial septum. ( g ) TEE demonstrating the radiofrequency perforating wire (arrow) across the atrial septum into the left atrium after perforation with 5 W of energy for 5 seconds. ( h ) Post-procedure 2D transthoracic echocardiogram demonstrates the stent (arrow) implanted across the atrial septum with decompression of the left atrium. LA=left atrium; RA=right atrium.

Inter-atrial stent. Post-mortem of the one patient who had radiofrequency perforation and stent implantation. The figure illustrates the stent across the inter-atrial septum (arrow) as seen from the right atrium ( a ) and the left atrium ( b ). The stent is in a good position. The patient died secondary to retrograde aortic arch obstruction, 5 days after the Hybrid procedure.

Description of patients in Group 2.

D=died; T=cardiac tamponade
Description of patients in Group 3.

Outcomes
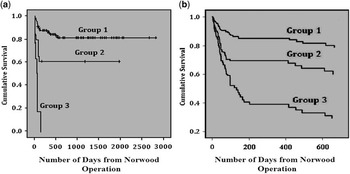
In Group 2, two patients underwent orthotopic heart transplantations. Earlier in the experience, the preference was to perform a Norwood operation; however, later on, the hybrid procedure was preferred over the Norwood operation. Overall survival to stage 2 was 83 and 50% for Groups 1 and 2, respectively, and 0% for Group 3 (Fig 4). In Group 2, there were four inter-stage mortalities, two underwent orthotopic heart transplantation as the primary procedure, four have completed Fontan, and two are awaiting Fontan completion. In Group 3, four patients had Hybrid and three had Norwood stage 1 palliation; however, all seven patients in Group 3 had a protracted post-operative course with none surviving till stage 2 palliation or transplantation. Survival benefits were observed both clinically and statistically between Groups 2 and 3 (p<0.001).
Survival curves. ( a ) Kaplan–Meier Survival Curve comparing Groups 1, 2, and 3. ( b ) Survival plot generated by Cox-Regression comparing the three groups.

Discussion
Despite steady improvement in survival of infants with hypoplastic left heart syndrome in recent years, the presence of an intact atrial septum or severely restrictive inter-atrial communication continues to be a significant contributor to high mortality.Reference Rychik, Rome, Collins, DeCampli and Spray 1 – Reference Vlahos, Lock, McElhinney and van der Velde 4 This results in severe postnatal haemodynamic instability, with severe cyanosis, acidosis, and pulmonary venous congestion. There is no uniform consensus regarding the management of hypoplastic left heart syndrome with an intact atrial septum or severely restrictive inter-atrial communication. The different approaches to open the atrial septum have included surgical septectomies,Reference Litwin, Plauth, Jones and Bernard 14 percutaneous blade septostomies,Reference Atz, Feinstein, Jonas, Perry and Wessel 2 , Reference Kahn Ali, Bricker, Mullins, Al Yousef, Nihill and Vargo 5 – Reference Park, Neches and Mullins 7 , Reference Park, Neches and Zuberbuhler 15 – Reference Rao 17 Brockenbrough transseptal needle septoplasties,Reference Atz, Feinstein, Jonas, Perry and Wessel 2 , Reference Cope 18 , Reference Ross, Braunwald and Morrow 19 and radiofrequency perforation with or without atrial septal stent placement.Reference Coe, Timisky, Villnave and Trevenen 8 – Reference Du Marchie Sarvaas, Trivedi, Hornberger, Jin Lee, Kirsch and Benson 10 , Reference Javois, Van Bergen, Cuneo and Husayni 13 , Reference Cope 18 , Reference Nykanen, Pihkala, Taylor and Benson 20 Neonates with restrictive atrial communication at birth demonstrate abnormal pulmonary venous thickening and lymphatic dilation.Reference Graziano, Heidelberger, Ensing, Gomez and Ludomirsky 21 Foetal interventions and creation of an atrial septal communication in utero for this subset of hypoplastic left heart syndrome patients have had mixed outcomes.Reference Marshall, Van der Velde and Tworetzky 22 In one study, infants born after foetal intervention had a hospital survival of 79% compared with 61% of infants treated postnatally.Reference Vida, Bacha and Larrazabal 23 Most of these foetal interventions were performed to create an inter-atrial communication, although some had only aortic valve dilations.Reference Tworetzky, Wilkins-Haug and Jennings 24 Long-standing pulmonary venous hypertension during in utero development may result in an abnormally reactive pulmonary arteriolar bed with the potential for late vasospasm. This propensity for pulmonary vascular lability may not be easily recognised by conventional means, placing these patients at higher risk for mortality at any stage. Therefore, the ideal timing for creating an adequate inter-atrial communication is not clear. There does appear to be an agreement that the earlier the intervention the better the outcome.
This study looks at the experiences in two centres over a 5-year period. A policy was designed to identify at-risk patients and assemble the multidisciplinary resources required to care for these critically ill neonates in the immediate post-partum period. In centre 1, it was feasible to perform a C-section on the mother in the catheterisation suite. In centre 2, emergent transportation was achieved. The technique of creating an unrestrictive inter-atrial communication is as described. The cardiac interventionalist uses ultrasound guidance for femoral venous access and dilates it to accommodate a 5-Fr, 45-cm sheath. Once access is obtained, a 5-Fr Judkins Right 2 catheter, which has been pre-loaded with a coaxial injectable catheter (Baylis Medical, Montreal, Canada) that contains a Nykanen RadioFrequency perforating wire (Baylis Medical), is passed into the right atrium. Transoesophageal echo is utilised to facilitate the engagement of the angled coronary catheter to the atrial septum. Hand injection of a contrast through a side arm attached to the end of the guide catheter is used to stain the septum and helps delineate the anatomy and facilitate subsequent perforation. Radiofrequency energy is delivered using the Baylis RF generator. Typical application of 5 W for 5 seconds is used initially and increased as deemed necessary. The coaxial catheter is passed into the left atrium. The perforating wire is exchanged for a 0.014" diameter Hi-torque guide wire followed by the removal of the coaxial catheter. Over the guide wire, a coronary balloon is advanced across the atrial septum (2–4×6 mm). The inflation and deflation of the balloon help in advancing the 5-Fr sheath over this balloon through the inter-atrial septum into the left atrium. A bare-metal, pre-mounted, biliary stent (Cordis Palmaz Blue 6×16 mm) is implanted by partially unsheathing the stent during dilation to “dog-bone” it across the atrial septum. The restrictive inter-atrial communication is usually not at the level of the foramen ovale and is typically not amenable to balloon septostomy or septoplasty. Invariably, a new communication with radiofrequency perforation has to be created. Earlier in the experience, balloon septoplasty alone was performed after radiofrequency perforation. The atrial septum is thicker than usual in these patients. Therefore, stent implantation was preferred later in the experience. Decompressing veins from the left atrium are usually inadequate. Rapid intervention was associated with better procedural outcomes. Transoesophageal echo was the best guide for radiofrequency perforation.Reference Walayat, Cooper and Sholler 25
Foetal pulmonary vein Doppler flow pattern helps in predicting the severity of inter-atrial restriction and helps plan management after birth. It also has prognostic implications.Reference Michelfelder, Gomez, Border, Gottliebson and Franklin 11 , Reference Divanovic, Hor, Cnota, Hirsch, Kinsel-Ziter and Michelfelder 12 , Reference Taketazu, Barrea, Smallhorn, Wilson and Hornberger 26 A pulmonary vein Doppler index of velocity time integral reverse/forward flow >18% was found to be a useful indicator for the need for early intervention. Since the advent of foetal intervention, this type of analysis is not simply an academic exercise in this patient population. Although we did not attempt foetal intervention, this pulmonary vein Doppler index will help us identify foetuses that may benefit from such therapy in the future. It must be remembered that the presence of a decompressing vein, typically the levo-atrial cardinal vein, which partially decompresses the left atrium, may lead to a falsely reassuring pulmonary vein Doppler index.
With careful and diligent preparation, and using a multidisciplinary approach, time-saving measures can be instituted by delivering prenatally diagnosed neonates with hypoplastic left heart syndrome with an intact atrial septum via C-section in the cardiac catheterisation suite where left atrial decompression can be performed quickly and safely using transcatheter radiofrequency perforation of the atrial septum. It should be understood that transseptal puncture procedures involve risk; however, the benefits clearly outweigh the risks of the procedure. Even though the outcomes of these patients are not as good as those with no restriction to the inter-atrial communication, earlier intervention definitely leads to improved survival. Reasonable approaches for patients with hypoplastic left heart syndrome and an intact atrial septum would be the following: (1) Foetal diagnosis and the use of pulmonary venous Doppler interrogation to identify at-risk foetuses in need of left atrial decompression. (2) Prenatal intervention to decompress the left atrium to prevent long-standing pulmonary venous congestion during foetal life. (3) If foetal intervention is not feasible, emergent postnatal cardiac catheterisation and radiofrequency perforation and intra-atrial stenting to keep the inter-atrial communication widely patent. An advantage of stent implantation over balloon septoplasty is that it has the potential to maintain the atrial septum widely patent for an extended length of time as the Norwood palliation may be delayed.Reference Cheatham 27 , Reference Perry, Lang, Keane, Jonas, Sanders and Lock 28 (4) Even if foetal intervention is performed, immediate postnatal intervention is needed. Foetal pulmonary venous return is much less compared with postnatal life due to increased pulmonary vascular resistance. After birth, however, a marked increase in pulmonary blood flow increases pulmonary venous return. The intra-atrial communication created during foetal life is usually inadequate after birth. Therefore, catheterisation including radiofrequency perforation and septal stent implantation may be necessary after birth even if foetal interventions are performed. (5) In this high-risk subset of neonates, the pulmonary capillary bed that has been exposed to higher pressures takes time to recover. Adopting a hybrid strategy that includes banding of the bilateral pulmonary artery branches and ductal stenting can be a reasonable first-stage palliation before Norwood arch reconstruction.Reference Akinturk, Michel-Behnke and Valeske 29 It also potentially gains vital time to stabilise the patients, correct other non-cardiac anomalies, and delay the Norwood operation.Reference Venugopal, Luna and Anderson 30 Although prenatal presence of any degree of atrial septal restriction in the setting of hypoplastic left heart syndrome confers a significant survival disadvantage, with this stepwise approach, better outcomes can be achieved. Continued coordination of care between different subspecialties is invaluable for this to be accomplished successfully.
Acknowledgements
None.
Financial support
None.
Conflicts of interest
None