The global prevalence of diabetes continues to rise, posing a major public health challenge. In 2022, the prevalence of diabetes among adults reached 14 %, up from 7 % in 1990(1). Diabetes imposes a substantial burden of morbidity and mortality primarily attributable to its long-term complications, particularly CVD and renal failure(1,Reference Wong and Sattar2) . The identification of modifiable lifestyle factors for the primary prevention of diabetes represents an urgent public health priority.
Dietary factors play crucial roles in the development of diabetes(Reference Neuenschwander, Ballon and Weber3). While earlier studies primarily focused on individual nutrients or specific food groups, recent studies have increasingly emphasised the role of overall dietary patterns in shaping health outcomes. One such pattern is dietary acid load (DAL), which reflects the diet’s acid–base balance. DAL is estimated based on nutrient composition. In epidemiological studies, it is most often assessed using the potential renal acid load (PRAL)(Reference Remer and Manz4,Reference Remer, Dimitriou and Manz5) and net endogenous acid production (NEAP)(Reference Frassetto, Todd and Morris6), both of which are derived from dietary nutrient composition, particularly reflecting protein and mineral intake.
Acid stress has recently been conceptualised as a spectrum ranging from high-acid-producing diets to chronic metabolic acidosis(Reference Wesson7). This concept provides a potential biological framework linking higher DAL to metabolic dysfunction. Higher DAL may contribute to insulin resistance through diet-induced acid stress, potentially by impairing insulin signalling(Reference Hayata, Miyazaki and Niisato8) and stimulating cortisol secretion(Reference Della Guardia, Thomas and Cena9), which may promote visceral fat accumulation and a further reduction in insulin sensitivity(Reference Williams, Kozan and Samocha-Bonet10,Reference Wieërs, Beynon-Cobb and Visser11) . However, epidemiological evidence linking DAL to incident diabetes is inconsistent. Prospective studies(Reference Fagherazzi, Vilier and Bonnet12–Reference Kiefte-de Jong, Li and Chen14) and meta-analyses(Reference Jayedi and Shab-Bidar15), conducted predominantly in Western populations, have generally reported that higher DAL levels are associated with a higher risk of diabetes, particularly among women. In contrast, studies conducted in Japanese populations have shown partially different patterns, particularly with regard to sex-specific associations. The Japan Public Health Center-based Study, which included 64 660 adults aged 45–75 years with 5 years of follow-up, reported a positive association between PRAL and diabetes risk among men only(Reference Akter, Kurotani and Kashino16). Meanwhile, a cross-sectional analysis based on the baseline survey of the Japan Multi-Institutional Collaborative Cohort, which included 28 147 adults aged 35–69 years, also reported a positive association between NEAP and high blood glucose levels but did not identify clear sex-specific differences(Reference Arisawa, Katsuura-Kamano and Uemura17).
Given these discrepancies, considering that East Asians, including Japanese, typically exhibit distinct dietary patterns(Reference Micha, Khatibzadeh and Shi18) and lower insulin secretion capacity compared with Western populations(Reference Yabe, Seino and Fukushima19), further investigation is warranted. Therefore, the primary aim of the present study was to examine the relationship between DAL and diabetes incidence in Japanese adults using data from the Japan Collaborative Cohort (JACC) Study(Reference Tamakoshi, Ozasa and Fujino20).
Experimental methods
Study design and participants
We used data from the JACC Study, a nationwide prospective study conducted in forty-five areas across Japan. At baseline (1988–1990), the participants provided information on lifestyle, medical history and dietary intake through self-administered questionnaires. An intermediate survey was conducted 5 years later using similar questionnaires to reassess lifestyle and health status and to inquire about any changes since baseline. In the present study, baseline data were used to assess exposures and covariates, while data from the intermediate survey were used to evaluate outcomes. Detailed descriptions of the cohort profiles have been published elsewhere(Reference Tamakoshi, Ozasa and Fujino20).
Of the 110 585 participants aged 40–79 years at baseline, we excluded 24 184 individuals from areas where dietary survey was not conducted, and 24 614 individuals who did not respond to the dietary questionnaire. We further excluded 3005 individuals with a history of stroke, myocardial infarction or cancer, 343 individuals with extreme energy intake (≤ or ≥ 3 sd from the mean), 3749 individuals with missing baseline diabetes status and 2469 individuals with diabetes at baseline. In addition, 12 032 individuals from areas not included in the intermediate survey, 19 323 individuals who did not respond to the survey and 1826 participants with missing information on intermediate diabetes status were excluded. The final analytical sample comprised 19 040 adults (7037 men and 12 003 women). The enrollment process is shown in Figure 1.
Participant enrollment process. sd represents standard deviation.

Assessment of dietary intake
Dietary intake was assessed using a forty-item FFQ. Participants reported their typical food and beverage consumption over the preceding year by choosing one of five frequency options for each item: rarely, 1–2 times per month, 1–2 times per week, 3–4 times per week or almost daily. Nutrient intake was calculated with reference to the Standard Tables of Food Composition in Japan (Fifth Revised and Enlarged Edition, 2005)(21). Nutrient intake from dietary supplements was not included in these estimates. To ensure the accuracy and validity of the FFQ-derived nutrient estimates, portion sizes and estimation precision were calibrated using data from a separate validation study(Reference Date, Fukui and Yamamoto22). This validation study collected four 3-day weighed dietary records at 3-month intervals from eighty-five participants (eight men and seventy-seven women). In the validation study, the energy-adjusted Spearman correlation coefficients for the nutrients used to calculate DAL were 0·24 for protein, 0·38 for potassium and 0·35 for calcium. Crucially, because both protein and potassium, the key nutrients required for calculating NEAP, showed acceptable validation correlation coefficients, all components required for calculating NEAP were considered to be adequately valid. Conversely, the corresponding coefficients for phosphorus and magnesium, the key nutrients required for estimating PRAL, were not reported.
Assessment of dietary acid load
In this study, DAL was assessed using PRAL and NEAP, which were estimated from the nutrient estimates derived from the FFQ. PRAL and NEAP were calculated using the following formulas(Reference Remer and Manz4–Reference Frassetto, Todd and Morris6):
 $\eqalign{ PRAL\;\left( {mEq/d} \right) =& \ 0\cdot4888 \times protein\;\left( {g/d} \right) \cr & + 0\cdot0366\; \times phosphorus\;\left( {mg/d} \right) \cr & - 0\cdot0205\; \times potassium\;\left( {mg/d} \right) \cr & - 0\cdot0125\; \times calcium\;\left( {mg/d} \right) \cr & - 0\cdot0263\; \times magnesium\;\left( {mg/d} \right) \cr}$
 $NEAP\;\left( {mEq/d} \right) = 54\cdot5 \times {{protein\left( {g/d} \right)} \over {potassium\;\left( {mEq/d} \right)}} - 10\cdot2$
The calculated PRAL and NEAP values were energy-adjusted using the residual method, separately for men and women, based on the energy estimates derived from the FFQ. The participants were then categorised into sex-specific quartiles for analysis according to their PRAL and NEAP scores, with the lowest quartile of each score used as the reference category.
Assessment of diabetes status
In both the baseline and intermediate surveys, participants were asked about history of diabetes using a standard question with four response options: (1) never had diabetes, (2) currently under treatment, (3) previously treated and (4) had diabetes but not treated. Participants who selected options (2) to (4) were classified as having diabetes. For our analysis, we calculated the 5-year cumulative incidence of diabetes. Incident cases were defined as participants who were free of diabetes at baseline but reported a diagnosis of diabetes at the intermediate survey. Participants who did not respond to the query about history of diabetes at baseline or who reported having diabetes at baseline were excluded from the analysis. To assess the reliability of self-reported diabetes diagnoses, a separate validation study was conducted in a subsample of 1230 men and 1837 women by cross-referencing their self-reports with laboratory findings and treatment status(Reference Iso, Date and Wakai23). This validation showed sensitivity of 70 % and 75 % and specificity of 95 % and 98 % in men and women, respectively. Further details of the diagnostic criteria for diabetes in this validation study are available in a previous study(Reference Iso, Date and Wakai23).
Confounding factors
We adjusted for a comprehensive set of potential confounders identified a priori on the basis of biological plausibility and prior epidemiological findings. Categorical variables are shown with their response options in parentheses, and all dietary intake variables were treated as continuous variables. Socio-demographic covariates included age (40s, 50s, 60s and 70s), region of study area (Hokkaido, Tohoku, Kanto, Chubu, Kinki, Chugoku and Kyushu), BMI (< 18·5, ≥ 18·5 and < 25, ≥ 25 and < 30, ≥ 30 kg/m2), educational attainment (≤ 6, 7–9, 10–12, 13–15, ≥ 16 years) and occupation (employee, part-time, self-employed, homemaker, unemployed, others). In male participants, the ‘homemaker’ category was combined with ‘others’ owing to the small number of participants in these categories. Furthermore, lifestyle and health-related variables included drinking status (current drinker, former drinker and non-drinker), smoking status (current smoker, former smoker and non-smoker), habitual exercise per week (rarely, 1–2 h, 3–4 h, ≥ 5 h), habitual walking per day (rarely, approximately 30 min, 30 min to 1 h, ≥ 1 h), family history of diabetes (no or yes) and self-reported history of kidney disease (no or yes) and liver disease (no or yes). Energy and macronutritional covariates included energy, fat and carbohydrate intake. We also included micronutrient intake variables, such as zinc, vitamin B₁, folate, vitamin D and dietary fibre, based on their known relevance to glucose metabolism and blood glucose regulation(Reference Beltramo, Berrone and Tarallo24,Reference An, Wan and Luo25) . All dietary variables were adjusted for energy intake using the residual method.
Statistical analyses
We performed sex-specific analyses to examine the association between DAL and incidence of diabetes. DAL was evaluated using PRAL or NEAP. Both measures were categorised into sex-specific quartiles and included in the models as exposure variables. Logistic regression analysis was used to estimate odds ratios (ORs) and 95 % confidence intervals (CIs) for the incidence of diabetes across the PRAL or NEAP quartiles, using the lowest quartile as the reference category. All analyses were two-sided, and P < 0·05 was considered statistically significant.
Four sequential models were developed in this study. Model 1 was adjusted for age and region of the study area. Model 2 was further adjusted for major demographic, lifestyle and medical history factors, including BMI, educational attainment, occupation, drinking status, smoking status, habitual exercise, habitual walking, family history of diabetes, history of kidney disease and history of liver disease. Model 3 additionally adjusted for major dietary variables, including intake of energy, fat and carbohydrates. Model 3* extended model 3 by further adjusting for five micronutrients related to glycaemic control, particularly intakes of zinc, vitamin B₁, folate, vitamin D and dietary fibre. Model 3 was regarded as the primary model because it adjusted for major potential confounders, including demographic, lifestyle, medical history and major dietary factors. Model 3* was used as an additional sensitivity analysis to assess whether the findings were robust to further adjustment for micronutrients related to glycaemic control. Because these micronutrients may also be related to dietary patterns captured by DAL, this model may partly adjust for nutritional components underlying DAL-related dietary patterns. Therefore, model 3* was interpreted cautiously as supplementary to the primary findings from model 3.
In addition, to examine the dose–response associations of PRAL and NEAP as continuous variables, restricted cubic spline analyses were conducted as supplementary analyses. Following commonly used knot locations for three-knot spline models(Reference Schuster, Rijnhart and Twisk26), knots were placed at the 10th, 50th and 90th percentiles of each DAL index, and the 10th percentile was used as the reference value. These spline analyses were performed using model 3 and model 3*.
To account for missing values in covariates, multiple imputation was performed to generate forty imputed datasets. Logistic regression analyses were performed separately within each dataset, and the estimates were combined using Rubin’s rules. Additionally, sensitivity analyses were conducted through subgroup analyses stratified by age (< 60 years and ≥ 60 years), menopausal status (postmenopausal) and BMI (≥ 25 kg/m2 and < 25 kg/m2). Regarding menopausal status, analyses were restricted to women who self-reported being postmenopausal. A corresponding analysis for premenopausal women was not feasible because non-reporters represented a group that includes both premenopausal women and those with missing responses. All statistical analyses were conducted using R version 4.5.0. Logistic regression analyses were conducted using the glm function in standard R Stats package 4.5.0, and restricted cubic spline analyses were performed using rcspline with the Hmisc package version 5.2.3. Multiple imputation was performed using the mice package version 3.18.0.
Results
Participant characteristics
Table 1 summarises key baseline participant characteristics for the lowest and highest PRAL categories, separately for women and men. Full baseline characteristics across all PRAL and NEAP quartiles, including medical history and dietary factors, are provided in online Supplementary Tables S1 and S2. Participants in the higher DAL groups tended to be younger and were more likely to reside in the Hokkaido, Kinki and Kyushu regions. These patterns may reflect regional differences in dietary habits; however, they may also be attributed to differences in demographic characteristics across regions. Lower educational attainment and a lower prevalence of engagement in regular physical activity were also observed in these groups. Lower folate and dietary fibre intake were observed in the higher DAL groups. Among the covariates for which missing values were imputed, family history of diabetes had the highest proportion of missing values: 3770 women (31·4 %) and 2128 men (30·2 %) (online Supplementary Tables S1–S2). The absence of missing values for drinking status among men reflects the exclusion of men with incomplete alcohol intake information from the dataset used for nutrient calculation in the JACC Study. The percentile distributions of DAL are shown in online Supplementary Table S3.
Participant characteristics in the lowest and highest quartiles of PRAL

Table 1. Long description
The table compares participant characteristics in the lowest and highest quartiles of PRAL for women and men. It includes data on PRAL, NEAP, age, region of study area, BMI, educational attainment, occupation, drinking status, smoking status, habitual exercise per week, and habitual walking per day. The table has 15 rows and 20 columns. Column headers include PRAL (mEq/d), NEAP (mEq/d), Age (years), Region of study area, BMI (kg/m^2), Educational attainment, Occupation, Drinking status, Smoking status, Habitual exercise per week, and Habitual walking per day. Row labels include Quartile 1, Quartile 4, and Overall for both women and men. Notable trends include variations in PRAL and NEAP values, age distributions, regional study areas, BMI categories, educational attainment levels, occupations, drinking and smoking statuses, and physical activity levels. The table provides a detailed comparison of these characteristics across different quartiles of PRAL for both women and men.
PRAL represents potential renal acid load. NEAP represents net endogenous acid production. sd represents standard deviation.
Association between dietary acid load and risk of incident diabetes
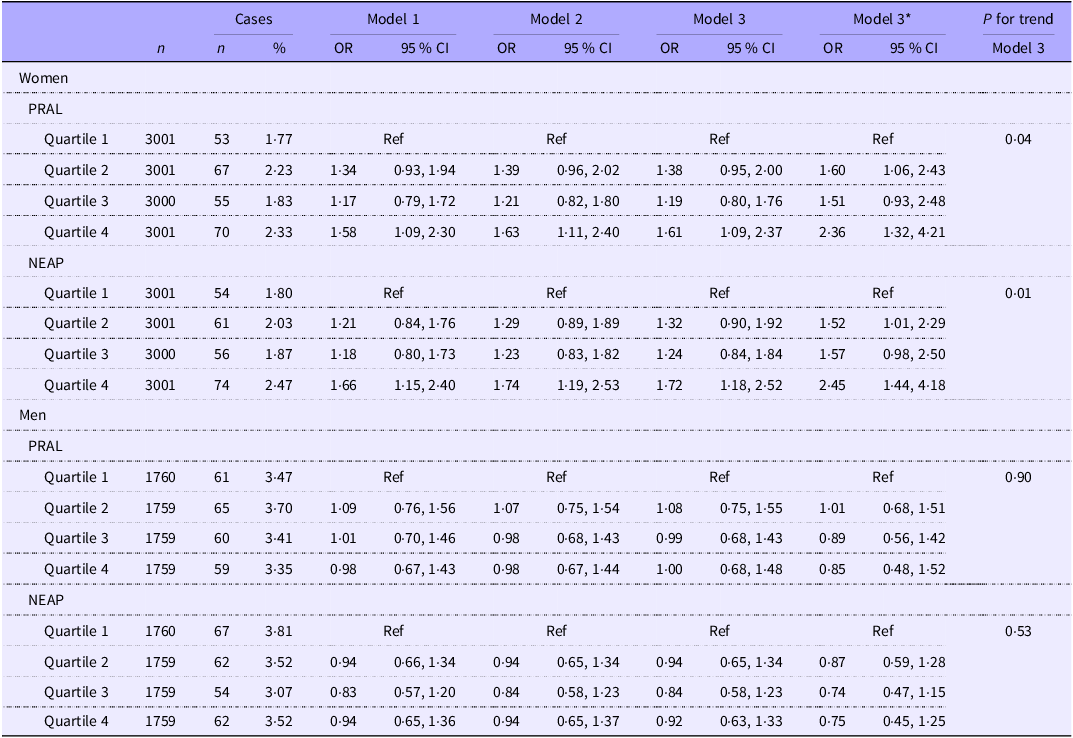
Table 2 shows the association between DAL and incident diabetes. Among women, 245 of 12 003 participants (2·04 %) had incident diabetes during the 5-year follow-up. The incidence rates of diabetes across increasing PRAL quartiles were 1·77 %, 2·23 %, 1·83 % and 2·33 %, respectively. Using the lowest quartile as the reference, the multivariable-adjusted OR for incident diabetes in the highest PRAL quartile was 1·61 (95 % CI: 1·09, 2·37) in model 3, the primary model. For NEAP, the corresponding incidence rates of diabetes across increasing quartiles were 1·80 %, 2·03 %, 1·87 % and 2·47 %, respectively. Using the lowest quartile as the reference, the OR for incident diabetes in the highest NEAP quartile was 1·72 (95 % CI: 1·18, 2·52) in model 3. These results indicate that higher DAL is associated with a higher risk of incident diabetes in women after adjustment for major potential confounders. This association was also observed in model 3*, which further adjusted for selected micronutrients related to glycaemic control; the corresponding OR for the highest quartiles of PRAL and NEAP were 2·36 (95 % CI: 1·32, 4·21) and 2·45 (95 % CI: 1·44, 4·18), respectively.
Odds ratios and 95 % confidence intervals for incident diabetes according to DAL

Table 2. Long description
A table comparing odds ratios and confidence intervals for incident diabetes according to DAL in women and men. The table has 12 rows and 12 columns. Column headers are Cases, Model 1, Model 2, Model 3, Model 3*, and Model 3 P for trend. Row labels are Women PRAL Quartile 1, Women PRAL Quartile 2, Women PRAL Quartile 3, Women PRAL Quartile 4, Women NEAP Quartile 1, Women NEAP Quartile 2, Women NEAP Quartile 3, Women NEAP Quartile 4, Men PRAL Quartile 1, Men PRAL Quartile 2, Men PRAL Quartile 3, Men PRAL Quartile 4, Men NEAP Quartile 1, Men NEAP Quartile 2, Men NEAP Quartile 3, Men NEAP Quartile 4. Each row contains values for n, cases n, cases percent, OR, 95 percent CI for Model 1, Model 2, Model 3, Model 3*, and Model 3 P for trend. Row 1: Women PRAL Quartile 1, 3001, 53, 1.77, Ref, Ref, Ref, Ref, 0.04. Row 2: Women PRAL Quartile 2, 3001, 67, 2.23, 1.34, 0.93, 1.94, 1.39, 0.96, 2.02, 1.38, 0.95, 2.00, 1.60, 1.06, 2.43. Row 3: Women PRAL Quartile 3, 3000, 55, 1.83, 1.17, 0.79, 1.72, 1.21, 0.82, 1.80, 1.19, 0.80, 1.76, 1.51, 0.93, 2.48. Row 4: Women PRAL Quartile 4, 3001, 70, 2.33, 1.58, 1.09, 2.30, 1.63, 1.11, 2.40, 1.61, 1.09, 2.37, 2.36, 1.32, 4.21. Row 5: Women NEAP Quartile 1, 3001, 54, 1.80, Ref, Ref, Ref, Ref, 0.01. Row 6: Women NEAP Quartile 2, 3001, 61, 2.03, 1.21, 0.84, 1.76, 1.29, 0.89, 1.89, 1.32, 0.90, 1.92, 1.52, 1.01, 2.29. Row 7: Women NEAP Quartile 3, 3000, 56, 1.87, 1.18, 0.80, 1.73, 1.23, 0.83, 1.82, 1.24, 0.84, 1.84, 1.57, 0.98, 2.50. Row 8: Women NEAP Quartile 4, 3001, 74, 2.47, 1.66, 1.15, 2.40, 1.74, 1.19, 2.53, 1.72, 1.18, 2.52, 2.45, 1.44, 4.18. Row 9: Men PRAL Quartile 1, 1760, 61, 3.47, Ref, Ref, Ref, Ref, 0.90. Row 10: Men PRAL Quartile 2, 1759, 65, 3.70, 1.09, 0.76, 1.56, 1.07, 0.75, 1.54, 1.08, 0.75, 1.55, 1.01, 0.68, 1.51. Row 11: Men PRAL Quartile 3, 1759, 60, 3.41, 1.01, 0.70, 1.46, 0.98, 0.68, 1.43, 0.99, 0.68, 1.43, 0.89, 0.56, 1.42. Row 12: Men PRAL Quartile 4, 1759, 59, 3.35, 0.98, 0.67, 1.43, 0.98, 0.67, 1.44, 1.00, 0.68, 1.48, 0.85, 0.48, 1.52. Row 13: Men NEAP Quartile 1, 1760, 67, 3.81, Ref, Ref, Ref, Ref, 0.53. Row 14: Men NEAP Quartile 2, 1759, 62, 3.52, 0.94, 0.66, 1.34, 0.94, 0.65, 1.34, 0.94, 0.65, 1.34, 0.87, 0.59, 1.28. Row 15: Men NEAP Quartile 3, 1759, 54, 3.07, 0.83, 0.57, 1.20, 0.84, 0.58, 1.23, 0.84, 0.58, 1.23, 0.74, 0.47, 1.15. Row 16: Men NEAP Quartile 4, 1759, 62, 3.52, 0.94, 0.65, 1.36, 0.94, 0.65, 1.37, 0.92, 0.63, 1.33, 0.75, 0.45, 1.25.
OR and CI represent the odds ratio and confidence interval, respectively. PRAL represents potential renal acid load. NEAP represents net endogenous acid production.
Model 1 represents the results of a multivariate logistic regression model adjusted for age and region of study area.
Model 2 represents the results of a multivariate logistic regression model adjusted for the variables in model 1, in addition to major demographic, lifestyle and medical history factors, including BMI, educational attainment, occupation, drinking status, smoking status, habitual exercise, habitual walking, family history of diabetes, history of kidney disease and history of liver disease.
Model 3 represents the results of a multivariate logistic regression model adjusted for the variables in model 2, in addition to major dietary factors, including intakes of energy, fat and carbohydrate.
Model 3* represents the results of a multivariate logistic regression model adjusted for the variables in model 3, in addition to the five micronutrients related to glycaemic control, including intakes of zinc, vitamin B₁, folate, vitamin D and dietary fibre.
Among men, 245 of 7037 participants (3·48 %) had incident diabetes during the 5-year follow-up. The incidence rates of diabetes across increasing PRAL quartiles were 3·47 %, 3·70 %, 3·41 % and 3·35 %, respectively. Using the lowest quartile as the reference, the multivariable-adjusted OR for incident diabetes in the highest PRAL quartile was 1·00 (95 % CI: 0·68, 1·48) in model 3. For NEAP, the corresponding incidence rates of diabetes across increasing quartiles were 3·81 %, 3·52 %, 3·07 % and 3·52 %, respectively. Using the lowest quartile as the reference, the OR for incident diabetes in the highest NEAP quartile was 0·92 (95 % CI: 0·63, 1·33) in model 3. Similar null findings were observed in model 3*, which further adjusted for selected micronutrients related to glycaemic control. Overall, these findings indicate no clear association between DAL and incident diabetes in men.
In the restricted cubic spline analyses treating DAL indices as continuous variables, both PRAL and NEAP showed dose–response associations with incident diabetes among women in model 3 (Figure 2). Similar dose–response patterns were also observed in model 3* (online Supplementary Figure S1). In contrast, no clear dose–response pattern was observed among men in either model.
Associations of PRAL and NEAP with incident diabetes by sex using restricted cubic splines. Panels show model 3 results for (A) PRAL in women, (B) NEAP in women, (C) PRAL in men and (D) NEAP in men. The solid line represents the estimated odds ratio, and the shaded area represents the 95 % CI. Splines were fitted with knots at the 10th, 50th and 90th percentiles, and OR were estimated relative to the 10th percentile of each exposure. Model 3 was adjusted for age, region of study area, BMI, educational attainment, occupation, drinking status, smoking status, habitual exercise, habitual walking, family history of diabetes, history of kidney disease, history of liver disease, and intakes of energy, fat and carbohydrates. NEAP, net endogenous acid production; PRAL, potential renal acid load.

Subgroup analyses according to baseline age, menopausal status and BMI
Online Supplementary Tables S4–S5 present the results of subgroup analyses according to age group (< 60 years or ≥ 60 years), menopausal status (postmenopausal, women only) and BMI (< 25 kg/m2 or ≥ 25 kg/m2). Among women, the association between DAL and incident diabetes was particularly strong in the younger age (< 60 years) and higher BMI (≥ 25 kg/m2) groups in model 3. While analyses among men showed no significant associations across any subgroup.
Discussion
In this large-scale prospective cohort study, higher PRAL and NEAP levels were associated with a higher risk of incident diabetes among women. In contrast, no clear association was observed in men. This positive association among women was supported not only by the quartile-based analyses but also by the spline analyses, which suggested a dose–response relationship between DAL and incident diabetes. Compared with previous research, our findings align with a meta-analysis(Reference Jayedi and Shab-Bidar15) conducted predominantly in Western populations, which demonstrated that DAL was significantly associated with diabetes risk only among women. In contrast, the Japan Public Health Center-based Study conducted in Japan reported significant association between PRAL and incident diabetes in men but not in women(Reference Akter, Kurotani and Kashino16). In their study, the null association observed among women was partly attributed to their lower incidence of diabetes and a narrower distribution of DAL compared with men. In our cohort, women also tended to have lower DAL levels. Nevertheless, in our study, a significant association was observed among Japanese women, providing new evidence that DAL may contribute to diabetes risk even within a relatively low exposure range. The association among women became clearer after further adjustment for selected micronutrients related to glycaemic control in model 3*, suggesting that the observed association was not explained by these selected micronutrient intakes, which may also be related to dietary patterns captured by DAL.
Several biological mechanisms have been proposed to support the association between DAL and the development of diabetes(Reference Williams, Kozan and Samocha-Bonet10,Reference Wieërs, Beynon-Cobb and Visser11) . DAL may increase insulin resistance through diet-induced acid stress, and elevated cortisol levels may promote visceral fat accumulation, further reducing insulin sensitivity. The significant association observed among women in the present study may reflect metabolic vulnerability following the menopausal transition, potentially attributable to fluctuations in gonadal hormone secretion, in addition to the general mechanisms described above(Reference Carr27–Reference Opoku, Abushama and Konje29). Notably, in our subgroup analyses, higher diabetes risk was observed in women in their 40s and 50s, which corresponds to the period during which diabetes risk begins to increase following the menopausal transition, suggesting that adverse effects of DAL may be more pronounced at this stage. In contrast, among older women in their 60s and 70s with longer postmenopausal duration, the association was weaker. This may be partly attributable to the stabilisation of the hormonal environment after menopause, as well as to the exclusion of individuals with diabetes at baseline, which may have removed those at higher risk and thereby attenuated the observed trend relative to that observed among younger women.
However, no significant associations were observed among men. Although the point estimates for some associations among men were below 1·0, the CI was wide and included the null value; therefore, these estimates should not be interpreted as evidence of an inverse association. Men are generally at a higher risk of diabetes than women, and contributions from nondietary factors may be relatively large, potentially obscuring the effects of DAL. Previous research has shown that men tend to accumulate more visceral fat than women, which is strongly associated with insulin resistance and diabetes risk(Reference Nordström, Hadrévi and Olsson30). Other unmeasured factors, such as differences in fat distribution, hormonal status and lifestyle patterns, may also contribute. The presence of such unmeasured factors may partly explain why no association was observed between DAL and diabetes risk among men. In addition, the validation study of the FFQ used in this study(Reference Date, Fukui and Yamamoto22) included seventy-seven women but only eight men, and therefore, the validity of DAL-related estimates might not have been sufficiently established among men. Given the social context in Japan at the time of the baseline dietary survey, when women were more commonly involved in household meal preparation, dietary information reported by male participants using an FFQ may also require particularly cautious interpretation. Therefore, the absence of statistically significant associations among men should not be interpreted as definitive evidence that DAL is unrelated to diabetes risk in men. Rather, these findings should be interpreted cautiously in light of the potential uncertainty in dietary assessment among men and the limited validation data for male participants.
Our findings suggest that dietary patterns that lower dietary acid load may be relevant for diabetes prevention, particularly among women. From a practical perspective, PRAL may be lowered through a plant-forward, nutritionally balanced dietary pattern. In general, vegetables, fruits, legumes and other plant-based foods provide base-forming precursors, including minerals such as potassium, calcium and magnesium, whereas several protein-rich foods, including meat, fish and shellfish and cheese, tend to increase dietary acid load(Reference Remer and Manz4,Reference Passey31,Reference Storz, Ronco and Hannibal32) . Thus, increasing the intake of vegetables, fruits, legumes and other plant-based foods, and partially replacing some acid-producing foods, such as meat, fish and shellfish and cheese, with plant-based foods, including soya products, may be feasible dietary approaches to lowering PRAL in Japanese adults. These suggestions should not be interpreted as recommending excessive protein restriction or the indiscriminate restriction of all animal-source foods. Although protein-rich foods can contribute to dietary acid load, adequate protein intake remains important for maintaining muscle mass, physical function and good health, particularly in older adults(Reference Bauer, Biolo and Cederholm33,Reference Volkert, Beck and Cederholm34) . Rather, the overall balance between acid-producing and base-producing foods should be improved while maintaining nutritional adequacy.
This study had several strengths. First, it employed a large nationwide prospective cohort covering diverse regions and age groups in Japan, allowing investigation within a broad and representative population(Reference Tamakoshi, Ozasa and Fujino20). Second, analyses were conducted with adjustments for a wide range of demographic, lifestyle and dietary factors to enhance the robustness and reliability.
However, this study also had few limitations. First, diabetes was ascertained through self-report. However, validation measures of self-reported diabetes described in the Methods suggest that substantial misclassification is unlikely(Reference Iso, Date and Wakai23). Second, nutrient intake estimates derived from the FFQ are subject to inherent limitations. The FFQ validation study(Reference Date, Fukui and Yamamoto22) was conducted predominantly among women, with only eight male participants, and the validity of phosphorus and magnesium – both required for PRAL estimation – was not reported, thus introducing some uncertainty regarding dietary assessment among men and the precision of PRAL estimates. This uncertainty should be considered when interpreting the null findings observed in men. Third, in the JACC Study, 24 614 (28·5 %) of the 86 401 participants eligible for dietary calculations could not be included because they did not respond to the FFQ. Furthermore, among the 40 189 participants who were eligible at baseline and resided in areas where the intermediate survey was conducted, 21 149 (52·6 %) did not respond to the intermediate survey or provide information about their diabetes status. Thus, the possibility of selection bias arising from nonresponse to the FFQ cannot be entirely ruled out. Fourth, this study used baseline data collected between 1988 and 1990, which may limit generalisability of the findings to the current Japanese population. For example, phosphorus intake from food additives has been suggested to have increased in recent years(Reference Suzuki and Yamashita35); therefore, identical dietary patterns today may yield different DAL estimates than those derived from the 1988–1990 baseline assessment. Fifth, dietary habits may have changed during the 5-year follow-up period. Because dietary intake was assessed only at baseline, possible changes in participants’ diets over time may have resulted in exposure misclassification and attenuation of the observed associations. Finally, as this was an observational study, the possibility of residual confounding or reverse causality cannot be entirely excluded.
Taken together, our study clearly demonstrated that higher DAL was significantly associated with a higher risk of incident diabetes among Japanese women. In men, no significant associations were observed; however, given the uncertainty of the validity of dietary intake estimation in men, it cannot be concluded that no association exists. Further evidence from studies in East Asian populations using more precise nutritional assessment methods is required to clarify the association between DAL and incident diabetes, which could contribute to the development of dietary guidance and preventive approaches.
Supplementary material
For supplementary material/s referred to in this article, please visit https://doi.org/10.1017/S000711452610806X
Acknowledgements
The authors sincerely thank all participants and staff members for their invaluable contributions and commitment to this study.
During the preparation of this work, the authors used ChatGPT 5 in order to improve language and readability. After using this tool/service, the authors reviewed and edited the content as needed and take full responsibility for the content of the publication.
This work was supported by Grants-in-Aid for Scientific Research from the Ministry of Education, Science, Sports, and Culture of Japan (grant numbers 61010076, 62010074, 63010074, 1010068, 2151065, 3151064, 4151063, 5151069, 6279102, 11181101, 17015022, 18014011, 20014026, 20390156 and 26293138) and KAKENHI grants from the Japan Society for the Promotion of Science (grant numbers 16H06277 and 22H04923). The funders had no role in the study design, data analysis, interpretation of the results or writing of this manuscript.
S. S.: Conceptualisation-Equal, Data curation-Equal, Formal analysis-Equal, Investigation-Equal, Methodology-Equal, Software-Equal, Writing – original draft-Equal; A. Y.: Conceptualisation-Equal, Investigation-Equal, Writing – review & editing-Equal; H. W.: Methodology-Equal, Validation-Equal, Writing – review & editing-Equal; T. K.: Data curation-Equal, Writing – review & editing-Equal; A. T.: Funding acquisition-Equal, Project administration-Equal, Resources-Equal, Supervision-Equal, Writing – review & editing-Equal.
The authors declare no conflicts of interest.
Ethical approval for this study was obtained from the Ethics Committee of the Graduate School of Medicine at Hokkaido University (approval no. 14–044). In the JACC Study, consent procedures varied across the forty-five study areas. Individual informed consent was obtained before participation in thirty-six areas, comprising written consent in thirty-five areas and oral consent in one area. In the other nine areas, consent was provided collectively by the respective area leaders.
Data sharing is restricted because the dataset used in this study contains potentially sensitive information. In accordance with restrictions imposed by the data provider, the Ministry of Health, Labour and Welfare of Japan, the data cannot be made publicly available. Requests for access to the data should be directed to the JACC Study Group, which serves as the non-author contact point for data access inquiries. Contact information: JACC Study Group (JACC_study@med.hokudai.ac.jp).