


NOMENCLATURE
- AR
-
aspect ratio
- b
-
span, [m]
- c
-
chord, [m]
- CL
-
coefficient of lift
- CD
-
coefficient of drag
- CM
-
coefficient of moment about
 ${1 \over 4}$
chord
- DIC
-
digital image correlation
- E
-
Young’s modulus, [GPa]
- MAV
-
micro aerial vehicle
- Re
-
Reynolds number
- S
-
planform area, [m 2]
- t
-
membrane thickness, [mm]
- U
-
flow velocity, [m/s]
- We
-
Weber number
- Z
-
maximum out of plane membrane deflection
- Z*
-
Z / c
- θ
-
flap deployment angle, [Degrees]
- λ o
-
membrane pre-stretch
- ν
-
kinematic viscosity of air, [m 2/s]
- π2
-
aeroelastic parameter for membrane stiffness
- ρ
-
density of air, [Kg/m 3]
- σ
-
membrane spanwise stress, [MPa]

1.0 INTRODUCTION
Aerodynamic stall limits the operation of aircraft. Finding methods to expand the flight envelope of aircraft has been a goal of aerodynamicists and aircraft designers for decades. As a result, there are many forms of high-lift devices used to delay the onset of stall. Observation of natural flyers has been a source of inspiration for aerodynamics since before the beginning of human flight(Reference Anderson1). Nearly 60 years before the Wright Brothers’ first flight, F.H. Wenham published a paper in which he observed that the relative speed at which birds flew appeared to be related to the ratio of span to chord of their wings. This is the origin of Aspect Ratio (AR)(Reference Wenham2). Studies investigating the flight of animals continue today. Recent studies of flapping flight show potential to improve the performance of Micro Air Vehicles (MAVs)(Reference Dimitriadis, Gardiner, Tickle, Codd and Nudds3,Reference Manzanera and Smith4) – an unmanned aircraft having a maximum dimension of 15 cm and operating at speeds of below 15 m/s. The feasibility of such vehicles was first proposed by RAND Corporation(Reference Hundley and Gritton5) before a formal definition by the U.S. Defense Advanced Research Projects Agency (DARPA)(Reference McMichael and Francis6).
1.1 Background Information – High-Lift Effectors
One type of high-lift device inspired by natural flyers is the suction-surface pop-up flap. Many types of birds have feathers on the top surface of their wings, from the greater secondary coverts and marginal coverts feather groups(Reference Scott and McFarland7), which deploy as separated flow develops from the wing’s trailing edge and delay aerodynamic stall. Figure 1 shows a duck and a raven, both with pop-up flap deployed during landing. This behaviour of bird wings has been mimicked in various experiments with a flap attached to the top surface of a wing(Reference Brücker and Weidner8-Reference Allemand and Altman13). The flap is hinged about its leading edge and the trailing edge of the flap is left free. During the transition to a regime of fully separated flow, a region of flow reversal develops on the aft portion of the top surface of the wing; this reversed flow lifts the flap. The flap rotates until the weight of the flap and the force from the normal flow on the raised edge of the flap are in equilibrium with the force from the reversed flow pushing on the inner aft portion of the flap(Reference Schatz, Knacke and Thiele14). The lifted flap provides a physical barrier to delay the forward propagation of separated flow over the suction surface of the wing, delays the onset of stall, and increases the angle-of-attack for maximum lift.
A mallard (left) and a raven (right) as they flare for landing. Notice the feathers that are standing up on the top of the wing close to the wing root.

The first known observation of this effect was by W. Liebe, who hypothesised that the feathers that popped up during high angle-of-attack flight were a biological high-lift device. His observations inspired a research project in 1938 where a leather flap was affixed to one wing of a Messerschmitt 109 to quantify the effect. The presence of the flap on one wing of the aircraft resulted in compromised aerodynamic stability and inconclusive results(Reference Schatz, Knacke and Thiele14). The effect of the passive flap was successfully quantified in 1996 at the German Aerospace Center (DLR) with a similar experiment to the Messerschmitt 109, but utilising a passive flap attached to each wing of a glider with an HQ-41 aerofoil. The flap was found to produce a 7% increase in coefficient of lift (CL ) at stall(Reference Wang and Schluter12,Reference Bechert, Bruse, Hage and Meyer15) . In the years since 1997, many researchers have advanced our understanding of the pop-up flap in many areas including: optimisation of flap size and position(Reference Wang and Schluter12,Reference Schatz, Knacke and Thiele14,Reference Kernstine, Moore, Cutler and Mittal16-Reference G-ograve and Maughmer18) , optimisation of flap material and geometry(Reference Johnston, Gopalarathnam and Edward9,Reference Traub and Jaybush17,Reference Bechert, Bruse, Hage and Meyer19) , flap deployment angle(Reference Schatz, Bunge, Lübcke and Thiele10,Reference Bechert, Bruse, Hage and Meyer19-Reference Dharmadasa22) , flap performance at low Reynolds Number (Re)(Reference Schluter11), using pop-up flaps for drag reduction(Reference Feuvrier, Mazellier and Kourta23), dynamic testing with the pop-up flap(Reference Brücker and Weidner24), testing of pop-up flaps on highly elliptical low AR wings(Reference Arivoli and Singh25), kinematics and stability of the wing and flap(Reference Meyer, Hage, Bechert, Schatz, Knacke and Thiele26-Reference Montefort, Pohl, Liu, Gregory and Crafton28), the effects of having multiple flaps(Reference G-ograve and Maughmer18), and how hairy surfaces can have a similar function to the pop-up flap(Reference Brücker and Weidner8,Reference Favier, Dauptain, Basso and Bottaro29) .
1.2 Background Information – Membrane Wings
Another form of bio-mimicry in aerodynamics is the utilisation of membrane wings. As technology has advanced to allow for the creation of MAVs, aircraft stability at low Re has become increasingly important. As the size of an aircraft is reduced, the aircraft’s inertia scales more quickly than the aerodynamic forces, resulting in increased susceptibility to perturbation from gusty environmental conditions(Reference Lentink, Jongerius and Bradshaw30,Reference Mohamed, Massey, Watkins and Clothier31) . Bats and sugar gliders are two examples of natural flyers that utilise membrane wings and fly with agility in conditions similar to those where current MAVs struggle to achieve flight stability. Membrane wings are flexible and deflect with increasing aerodynamic loads or Re; as the load is increased, the membrane camber is enhanced. One method of adjusting the camber is membrane pre-strain or excess length(Reference Smith and Shyy32-Reference Rojratsirikul, Wang and Gursul34). Research has been conducted on the aerodynamics of membrane wings(Reference Smith and Shyy32,Reference Galvao, Israeli, Song, Tian, Bishop, Swartz and Breuer35-Reference Song and Breuer38) . The benefits of membrane wings have inspired many MAV designers to emulate natural flyers(Reference Albertani, Stanford, Hubner and Ifju39-Reference Shyy, Ifju and Viieru41). The use of membrane wings has been shown to increase maximum lift as compared to its rigid wing counterpart(Reference Zhang, Hubner, Timpe, Ukeiley, Abudaramv and Ifju42). Such wings have been experimentally found to increase small aircrafts’ gust tolerance(Reference Abudaramv43,Reference Ifju, Jenkins, Ettinger, Lian, Shyy and Waszak44) and aerodynamic damping(Reference Babcock, Albertani and Abate45). The deformed shapes of membrane wings are also significantly sensitive to their edge constraints. The form of gust tolerance cited by Abudaramv is specific to membrane wings with a free trailing edge(Reference Abudaramv43), which are fundamentally different in the way they passively change wing twist with aerodynamic loading than the perimeter supported membranes investigated in this work. Due to the benefits of both membrane wings and pop-up flaps, there is interest in the interactions of membrane wings and the pop-up flap.
1.3 Research Objectives
The objectives of this project were to
-
1. Investigate if the pop-up flap remains effective when applied to pliant wings.
-
2. Determine if membrane pre-strain and Re have a significant impact on the effectiveness of the pop-up flap.
-
3. Determine if membrane camber has a significant effect on flap effectiveness.
2.0 WIND TUNNEL AND TESTING APPARATUS
The experiments were conducted in the closed-loop low-speed (up to 18 m/s) wind tunnel at Oregon State University (OSU). The tunnel test section is 1.52 m wide and 1.22 m high by 9.14 m long. Turbulence level is less than 0.3% and solid blockage factor with the wing investigated in this paper is 34.15 × 10⁻⁶. The angle-of-attack of the wing was changed by rotating a u-shaped arm, shown in Fig. 2. This arm was attached to a rotational servo motor through the wall of the wind tunnel; this allowed for the angle-of-attack to be driven remotely.
The variable angle-of-attack apparatus that supports the test article in the wind tunnel.

The sting balance used in this experiment was a three-forces, three-moments sensor with full scale loads of 13.35 N for normal force, 8.897 N for side and axial force, 0.5650 N. m for pitch moment and 0.3390 N. m for roll and yaw moment. Two standard deviation accuracies on full-scale loads are 0.11% for normal, 0.09% for axial and 0.12% for side forces, 0.15% for pitch, 0.16% for roll and 0.11% for yaw moments, respectively(46).
2.1 Data Acquisition
An analogue-to-digital converter (National Instruments CompactRio) was utilised to capture all six channels of data from the sting balance, along with the air temperature, airspeed, angle-of-attack and airspeed control voltage. A LabVIEW Visual Interface (VI) then ran a PID controller to adjust the angle-of-attack and airspeed, sent updated control voltages back to the analogue-to-digital converter, and exported aerodynamic loads data to a text file. This text file was later used for more advanced data processing using R-Studio and MATLAB.
2.2 Test Article
The reference rigid wing consisted of a flat plate with the same chord and wingspan as the membrane wing, ellipsoidal leading edge and trailing edge and a thickness of 3.1 mm.
The membrane wing test article had an aspect ratio of 2, as shown in Fig. 3. This wing was constructed from two steel frames, with a chord of 140 mm and a span of 280 mm, which sandwich the membrane from the top and bottom. The frames were bonded to the pre-strained membrane.
The geometry of the frame that supports the membrane wing.

In order to stretch the membrane to the desired level of pre-strain, a speckled sheet of latex rubber was placed onto the membrane pre-strain fixture in its fully retracted state (139.7 mm by 381 mm), shown in Fig. 4. This fixture allows for each edge of the membrane to be pulled independently by tightening one of four screws. Two cameras, mounted above the pre-strain fixture, were used to capture images of the slack membrane. The membrane was stretched, and another set of images was recorded. Both sets of images were used for Digital Image Correlation (DIC) in VIC3D in order to determine the state of strain of the membrane(Reference Osterberg47,Reference Carpenter and Albertani48) .
The pre-strain fixture used for adjusting membrane tension.

The stretching process resulted in the measured average membrane strain in both the spanwise direction (y-axis) and the chordwise direction (x-axis) at the desired level of pre-strain to within 0.5%. The rigid frame was then adhered to the middle portion of the membrane while still in place on the pre-strain fixture using a spray adhesive applied to the one side of the frame (this allowed for avoiding the corners of the membrane where the strain is measured to be the least consistent). After the adhesive had set, the membrane was removed from the pre-strain fixture, the other side of the aerodynamic frame was adhered to the backside of the membrane, and the excess material was trimmed from the wing’s edges. Once the pre-strained membrane was attached to the steel frame, the wing was mounted at its trailing edge to the sting balance.
The pop-up flap was constructed from a piece of 110lb card stock (0.22 mm thickness), and had a chord of 0.2 c. The flap was attached to the wing at a position of 0.6 c from the leading edge with a 1 cm wide strip of Scotch Tape 3710 polypropylene film (with an average thickness of 0.048 mm, tensile strength of 771.0 N/100 mm of width and Young's modulus of 1,300-1,800 MPa, according to the manufacturer’s technical data sheet). The flap size and position were based on published experimental results for a rigid wing(Reference Schluter11,Reference Johnston and Gopalarathnam20,Reference Wang and Schlüter21) . To avoid the flap from being mechanically bound by the coupling of its stiffness and the spanwise deflection of the membrane on which the flap is hinged, the flap was cut along its spanwise direction into five sections free to rotate about their hinge. The centre flap is
 ${1 \over 3}b$
in span while the flaps closer to the wing tips are each
 ${1 \over 6}b$
in span (see Fig. 5). The flaps do not constrain the wing membrane in the chordwise direction and minimally constrain the membrane in the spanwise direction on the hinge line.
The membrane wing with the attached flap deployed in flow.

3.0 EXPERIMENTAL FACTORS
An elastic membrane wing and a rigid flat-plate were tested with and without the pop-up flap for three different Re. Each test condition was repeated three times. Twelve hundred data points were recorded at a sampling frequency of 500 Hz at each angle-of-attack tested, and the LabView program that was used for data collection applied a band stop filter from 58 to 62 Hz to reduce the noise in the data from AC contamination of the signal. All conditions tested are shown in Table 1.
Levels tested for each experimental factor

4.0 METHODS
A script was used to collect data between replications. The data for each repetition of each angle-of-attack were reported as a mean and a standard deviation. The mean value of each condition was analysed in the ANOVA. The standard deviations of the means from the three repetitions for each test condition are represented in the error bars on the various figures that follow.
R-Studio was used to conduct a two-way Analysis of Variance test (ANOVA) on each trial to determine the flap’s level of significance on the CL while isolating this effect from that of the angle-of-attack. An independent means model of angle-of-attack and flap condition was created. The ANOVA was then conducted on the angle-of-attack and the flap condition. In the ANOVA, the variation in the model is attributed to the different factors based on the mean squared residuals. Residuals that can not be attributed to one of the factors are a measure of the error in the ANOVA. The residuals are also tested for normality and equal variance to verify that the fundamental assumptions of the ANOVA are satisfied.
For this experiment, it was anticipated that there may be a relationship between flap effectiveness and wing camber. A metric for membrane camber was needed. Both π2 and Z* were used to quantify membrane deformation. π2, shown in Equation (1) (Reference Smith and Shyy32), is the aeroelastic stiffness coefficient. This parameter is defined by the ratio of membrane stress, calculated from strain multiplied by the modulus (1.2e6Pa was used as the modulus and is the 100% modulus shown in the data for a similar latex membrane tested by Stanford in 2008(Reference Stanford49)), multiplied by membrane thickness over dynamic pressure multiplied by chord, and has an inverse correlation with flow-induced membrane deformation(Reference Zhang, Hopper, Wrist, Hubner and Ukeiley50).
 $$\begin{equation}\pi _{2} = {\sigma
t \over q c} %\xbox {query}{\XMLaddatt {linkend}{aer_1700010q17}}
\end{equation}$$
The modified Waldman 2013 camber model has been previously observed to correlate closely with DIC measurements of camber(Reference Waldman and Breuer51), and is utilised in this paper for the prediction of camber. This model is similar to the model published in Song’s 2008 publication(Reference Song, Tian, Israeli, Galvao, Bishop, Swartz and Breuer52) and assumes that the membrane deforms to a circular arc, and relates the camber of the membrane to the pressure gradient between the lower and upper surfaces of the wing and the membrane stiffness (Equations (3) and (4). This method correlates the Weber number (Equation (2)) to Z* membrane displacement nondimensionalised by the wing chord(Reference Waldman and Breuer51)
 $$\begin{equation}
We = {L \over E t b}
\end{equation}$$
In this equation, L is the lift, E is membrane Young’s modulus, t is membrane thickness and b is wingspan. From Waldman(Reference Waldman and Breuer51), Equation (3) can be used to estimate Z* for a given Weber number.
 $$\begin{equation}
We \approx 8(\lambda _{o}-1)Z^{*} + \left(\left({64 \over 3}\right)-32{\lambda _{o}-1}\right)Z^{*3}
\end{equation}$$
Finite span change in lift slope (Equation (4)) from Waldman(Reference Waldman and Breuer51) is used to correct the second term of Equation (3).
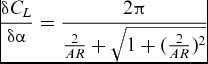 $$\begin{equation}
{\delta C_{L} \over \delta \alpha } = {2 \pi \over {2 \over AR} + \sqrt{1+({2 \over AR})^{2}}}
\end{equation}$$
In order to utilise this model, the Weber number (Equation (2)) was calculated for each test condition. The Weber number was then used with the known value of pre-strain in Equation (3) with the correction from Equation (4) multiplying the second term of Equation (3) to find Z*, the chord-normalised maximum camber.
Two AOS S-PRI cameras (capable of capturing 1,000 frames per second at 1280×1024 resolution) were mounted above the test article with a stereoscopic angle of approximately 40°. These cameras were utilised to collect synchronised images during each test. Roughly 50 images were captured at a frequency of 100 Hz during each angle-of-attack that was tested.
5.0 RESULTS AND DISCUSSION
Figure 6 shows a comparison of the effect of the pop-up flap on a flat-plate and on the membrane wing with a pre-strain of 0.075. The membrane has a higher increase in the lift force at stall, and has a larger increase in the lift force after stall.
Comparison between the rigid flat plate (left) and a membrane pre-strained to 0.075 (right). Both the lift and drag behaviour is shown for wings with and without flaps, for a Re of 75,000.

Previous work on pliant membrane wings(Reference Albertani, Stanford, Hubner and Ifju39,Reference Shyy, Ifju and Viieru41,Reference Babcock, Albertani and Abate45,Reference Osterberg47-Reference Stanford49,Reference Waszak, Jenkins and Ifju53) shows a correlation between an increasing coefficient of lift and a decrease of pre-strain, for similar test conditions. This correlation is due to the relative increase of camber of the membrane wing when decreasing the membrane pre-strain. For membrane wings, an increase in angle-of-attack below the stall angle causes an increase in lift and camber. This effect is greater in low pre-strain membranes relative to high pre-strain membranes.
5.1 ANOVA
Due to the nature of membrane wings, many modes of vibration are present in the membrane during testing(Reference Rojratsirikul, Genc, Wang and Gursul54). These vibrations are largely responsible for the variance in the data, which is similar to the variance presented in Waszak’s 2001 publication(Reference Waszak, Jenkins and Ifju53). A two-way ANOVA was conducted on the data from each test condition (across repetitions and angles of attack) to verify that statistical significance was maintained despite experimental noise. The resulting p-values are a measure of the significance of the effects of both the flap and the angle-of-attack. No significant effect of the flap was observed for the rigid plate at a Re of 50,000 or for the slack membrane at a Re of 83,000. All other trials were found to have a p-value of less than 5.0 × 10⁻⁵, which is well below the minimum significance level of 0.05(Reference Ramsey and Schafer55). The P-value gives the likelihood of a type 1 error – erroneously rejecting the null hypothesis (that there is no significant effect), when in fact there is no effect. This means that the lower the P-value the higher the certainty that the observed effect is significant. The ANOVA table for the first trial of the Re = 75,000 pre-strain = 0.075 test condition is shown in Table 2 as an example.
ANOVA table for the Re = 75,000 pre-strain = 0.075 test condition

ANOVA was selected as the statistical metric in this experiment because it is robust to non-normality in data for large sample sizes and robust to non-equal variance of samples if sample sizes are both similar across trials(Reference Montgomery56), both conditions of which are met by our data. Despite the data analysed making this test robust to violation of the fundamental ANOVA assumptions, normality, equal variance and independence were all still evaluated. Figure 7 shows the normality of the data evaluated for one of the conditions tested.
Verification of the normality assumption of the Re = 75,000 pre-strain = 0.075 test condition. The residuals distribution is on the left and the normal probability plot (QQ-plot) of the residuals is on the right.

From the distribution of the residuals for the trial shown in Fig. 7 (left), there is clearly a degree of non-normality in the distribution of the data. From the QQ-plot shown in Fig. 7 (right), it can be observed that the values toward the far right of the chart are not on the theoretical line, indicating a slight lack of normality in the data.
Figure 8 shows the residuals plotted against the fitted values. This chart provides a way to evaluate the equal variance assumption of the ANOVA test. Figure 8 shows that the residuals do not have equal variance, but that they are not so far from constant as to raise concern about the validity of the ANOVA.
Verification of the assumption equal variance.

5.2 Effect on Lift
Figures 9, 10 and 11 show different test conditions grouped by Re. Each figure is accompanied by a table displaying the P-values calculated with the two-way ANOVA for each trial. In each of these plots, each line is the result of three trials, to show a mean accompanied by an error bar representing one standard deviation in the data at each plotted point.
Each test condition for Re = 50,000

Each test condition for Re = 75,000

Each test condition for Re = 83,000

The same data that was presented in Figs 9, 10, and 11 is shown in a different form in Fig. 12, illustrating a direct comparison between the high and low pre-strain conditions and the rigid plate condition with the same flap configuration and Re. It is observed that the measured increase in maximum CL with the addition of the pop-up flap is greater for the membrane wing than for the equivalent rigid plate case.
The CL is plotted against angle-of-attack for pre-strain of 0.025 (left) and pre-strain of 0.075 (right).

It is observed that for many of the membrane test conditions, the CL curve does not pass through the [0,0]. As such, it is critical to quantify the level of error in the angle-of-attack measurement. The error between the assigned angle-of-attack and the angle-of-attack measured through DIC was evaluated for these three tests. The average errors between assigned angle-of-attack and measured angle-of-attack were 0.302°, 0.364° and 0.212° with standard deviations of 0.227°, 0.198° and 0.055°. This level of error alone is not enough to explain the asymmetry in the CL vs angle-of-attack graphs. So DIC data was used to evaluate the camber of the membrane wing at 0° angle-of-attack. The evaluation of a subset of DIC data shows that in the low pre-strain tests, there is a significant camber at 0° angle-of-attack. It is suspected that this is due to the asymmetries of the aerodynamic frame causing a pressure gradient and inducing a small camber.
For each of the Re tested, the largest observed increase in CL at stall is observed for the two higher values of pre-strain (pre-strain = 0.05 and pre-strain = 0.075). An optimum pre-strain is observed in these test conditions between 0.05 and 0.075. Membrane pre-strain and Re were evaluated independently for their influence on flap effectiveness. However, only poor correlations with high residual errors were produced through independent linear regression. The significance of these factors was only revealed when the interaction term of pre-strain and Re was also considered in a two-way ANOVA. By accounting for the interaction term as an additional factor, far more of the variance could be attributed to one of the factors rather than remaining as residual error, increasing the statistical power of the ANOVA. The results of this ANOVA show that the dominant factor in modelling the increase in maximum CL is the interaction between Re and pre-strain. The individual effects of Re and pre-strain on increase in maximum CL are also statistically significant.
5.3 Effect of Camber on Lift
The results of the ANOVA are best understood when one considers that both of these parameters affect the camber of the pliant wing. The more membrane pre-strain, the stiffer the wing and the less camber is observed. Increasing the Re increases the pressure gradient across the membrane, camber and lift. Figure 13 shows the increase in maximum lift with the addition of the flap for each test condition of the membrane wing plotted against π2. The equation for this parameter, shown in Equation (1), combines both the membrane pre-strain and the free-stream flow velocity (proportional to Re) into one value.
The average increase in maximum lift with the addition of the flap plotted against π2.

Figure 14 shows the relationship between predicted non-dimensional camber Z* and the increase in maximum CL . This is theoretically inversely proportional to the π2 parameter; however, this parameter does not assume a value of zero for a pre-strain of zero and allows for comparison of the slack membrane trials without the use of an additional parameter. The relationship between increase in maximum CL and Z* is fit to a quadratic expression, shown as the regression line in Fig. 14. A region of the membrane of roughly 0.1c immediately ahead of the flap was reinforced by the flap attachment. It is therefore assumed that the membrane has a slightly higher effective modulus when the flap is attached, and that the Z* will over-predict camber for these conditions. This assumption was checked using DIC data from one of the test conditions and it was found that while the membrane displacements were similar, the flapped wing did have a lower measured camber for an equivalent lift force; as such, the x-axis of Fig. 14 is predicted camber of the clean wing.
The average increase in maximum lift with the addition of the flap plotted against Z* of the clean wing(Reference Waldman and Breuer51).

In both Figs 13 and 14, there are two test conditions that do not seem to follow the same trend. The two conditions where the data lies substantially below the quadratic fit are the pre-strain of zero and the pre-strain of 0.025, both at the Re of 50,000 condition. In both of these conditions, the flap deployment was observed to be lesser than most trials, as can be seen in Table 6. The flap loses effectiveness when it folds forward and assumes a flap deployment angle of greater than 90°. In both conditions that do not appear to follow the same trend, the flap never reached a state where it folded forward, so it is likely the flap never reached its optimal deployment angle during these tests conditions.
Maximum flap deployment angle observed for each test condition where DIC data was collected

The implication of the quadratic relationship shown in Fig. 14 is that, for this particular case of flap design and position, there is an optimum level of camber for the performance of the pop-up flap for membrane aerofoils. This result matches the findings of Schlüter, who showed that rigid wings with various aerofoil sections performed differently with the flap(Reference Schluter11).
5.4 Relative Flap Deployment
In the photos collected for DIC of the membrane, it is possible to approximate the angular deflection of the pop-up flap. The maximum observed flap deployment angle is reported in Table 6 for each of the test conditions. Flap angle is 90° when perpendicular to the wing chord.
5.5 Effect on Drag and Pitching Moment
The behaviour of the wing with respect to coefficient of drag (CD
) and coefficient of pitching moment about
 ${1 \over 4}$
chord (CM
) is also altered with the addition of the flap. Figure 15 shows the angle-of-attack versus CD
plot (left) and the angle-of-attack versus CM
(right) for the Re = 75,000 test condition. The same trends observed in this case are reflected in the other membrane test conditions.
Drag versus angle-of-attack with and without pop-up flap plotted for various pre-strains (left) and pitching moment versus angle-of-attack with and without pop-up flap plotted for various pre-strains (right).

The effect of the flap on CD is minimal before the stall angle of the clean wing. After this stall angle, there is an increase in CD that accompanies the increase in CL . This can be observed in Fig. 15 (left) and Fig. 10, respectively. The behaviour of CM is also changed with the addition of the flap; in all test conditions where the flap had a measurable effect, the CM was reduced for low angles of attack and increased for high angles of attack. At first inspection, it may be assumed that the addition of the flap changes the mass distribution of the wing and may be responsible for this change in CM , however, during testing, a new tare file was constructed for each test condition. The independent tare file between the flap and clean conditions means that the observed change is not caused by the mass added by the flap, but rather by an aerodynamic effect of the flap. The observed behaviour of CM is indicative of a reduction in static stability, and is worthy of further investigation.
6.0 CONCLUSIONS
The effect of a pop-up flap was experimentally measured for three different Re and four levels of pre-strain on an elastic membrane wing as well as on a rigid flat plate. The data collected shows that the Re, pre-strain, and the interaction between the two each have a significant effect on the lift increase caused by the flap. Only the low Re rigid plate and the high Re slack membrane conditions were not found to produce a statistically significant effect on maximum lift. Predicted membrane camber offers the best correlation with lift increase due to the addition of the flap of all metrics evaluated. Relevant findings of this project, specific to the flap configuration tested, include:
-
• The addition of the pop-up flap increases the maximum lift by 5%-15% for the membrane wing configurations tested; the pop-up flap generates a larger increase in maximum lift for pre-strained membrane wings with respect to a rigid flat-plate.
-
• Pre-strain, Re, and the interaction term between the two each have a significant effect on the increase in maximum CL with the addition of the flap. The effect of the interaction term of Re and pre-strain is greater than the effect of pre-strain, which is greater than the effect of Re.
-
• The effectiveness of the pop-up flap changes with the value of membrane camber. For the flap size, flap position and membrane geometry tested, the flap has a maximum effectiveness when pre-strain is 0.05 and Re is 83,000.
In addition to the primary focus on CL , results offer additional remarks as follows:
-
• CD was consistently observed to increase with the addition of the flap for angles of attack beyond the clean wing stall angle.
-
• CM behaviour was consistently observed to change with the addition of the flap. CM was reduced at low angles of attack and increased at high angles of attack.
ACKNOWLEDGEMENTS
The authors would also like to extend their greatest gratitude to those who have made this research project possible:
-
• European Office of Aerospace Research & Development (EOARD) of the United States Air Force (USAF) with Dr. Gregg Abate as project monitor
-
• Aerospace Engineering Department at the Politecnico di Milano University, Italy
-
• Air Force Office of Scientific Research under DURIP grant FA9550-12-1-0026



