Introduction
Functional traits of vascular plant primary producers can be major drivers of the community composition of herbivores and decomposers (Grime et al. Reference Grime, Cornelissen, Thompson and Hodgson1996, Agrawal & Fishbein Reference Agrawal and Fishbein2006, Loranger et al. Reference Loranger, Meyer, Shipley, Kattge, Loranger, Roscher and Weisser2012). The nutrient content of plant tissues, in particular, plays an important role in supporting the diversity and abundance of consumers (Loranger et al. Reference Loranger, Meyer, Shipley, Kattge, Loranger, Roscher and Weisser2012). However, patterns described to date are primarily based on studies of vascular plants (Mattson Reference Mattson1980, Grime Reference Grime2001). In contrast, cryptogams (bryophytes, lichens and algae) have received less attention despite the large, and even dominant, role these primary producers play in many ecosystems, especially at higher latitudes and altitudes, and in the global carbon cycle (Davis Reference Davis1981, Convey Reference Convey2013, Convey et al. Reference Convey, Chown, Clarke, Barnes, Bokhorst, Cummings, Ducklow, Frati, Green, Gordon, Griffiths, Howard-Williams, Huiskes, Laybourn-Parry, Lyons, McMinn, Morley, Peck, Quesada, Robinson, Schiaparelli and Wall2014). The few studies examining cryptogam traits in relation to consumption have mainly focused on the inhibitory function of secondary compounds in preventing herbivory (Gauslaa Reference Gauslaa2005, Asplund & Wardle Reference Asplund and Wardle2013). The most extensive study to date on the impacts of physiological traits of lichens for invertebrate communities found variable responses from different invertebrate groups to lichen nutrient content which was, in part, due to the variety in lichen growth forms across the different growth locations that were studied (Bokhorst et al. Reference Bokhorst, Asplund, Kardol and Wardle2015). To overcome the variability caused by differences in growth form and growth location, natural gradients in intra-specific lichen nutrient concentrations are required.
Mosses, lichens and algae are the major macroscopic primary producer components of food webs in many polar terrestrial ecosystems (Convey Reference Convey2013) and can often be found in the vicinity of penguin colonies. These penguin colonies and other vertebrate aggregations along the coast of the Antarctic Peninsula and many offshore islands provide large quantities of nitrogen that encourage plant growth (Lindeboom Reference Lindeboom1984, Erskine et al. Reference Erskine, Bergstrom, Schmidt, Stewart, Tweedie and Shaw1998). Bird-derived nitrogen sources are well known to support vigorous growth of primary producers globally (Anderson & Polis Reference Anderson and Polis1999, Sanchez-Pinero & Polis Reference Sanchez-Pinero and Polis2000, Ellis Reference Ellis2005) and to increase ecosystem process rates (Bokhorst et al. Reference Bokhorst, Huiskes, Convey and Aerts2007a). The impacts generally diminish with increasing distance from the source, creating a nutrient gradient within the vegetation which also includes declines in δ15N (Erskine et al. Reference Erskine, Bergstrom, Schmidt, Stewart, Tweedie and Shaw1998, Zmudczyńska et al. Reference Zmudczyńska, Olejniczak, Zwolicki, Iliszko, Convey and Stempniewicz2012, Crittenden et al. Reference Crittenden, Scrimgeour, Minnullina, Sutton, Tang and Theobald2015). Such gradients in δ15N are useful to determine whether higher trophic levels feed on the penguin-affected vegetation, as δ15N levels typically increase by 2–3 units per step in trophic level (Peterson & Fry Reference Peterson and Fry1987). To date, the existence or magnitude of any impact of increased nutrient content of primary producers for higher trophic levels in Antarctic terrestrial ecosystems is poorly understood (Davis Reference Davis1981).
To address these issues we tested whether proximity to penguin colonies was associated with increased nitrogen concentrations and δ15N values in cryptogams on Signy Island, Maritime Antarctic, and whether this, in turn, correlated with the community composition of the most prominent elements of the terrestrial fauna, springtails and mites (Convey Reference Convey2013). We hypothesized that: i) the nitrogen concentrations and δ15N values of cryptogams would decrease with increasing distance from penguin colonies, and ii) that, as a consequence, this would be associated with decreased abundance, diversity (H’) and species richness of micro-arthropods living among these cryptogams. Confirmation of these hypotheses would provide the first direct evidence for trophic cascades in the Antarctic terrestrial environment, and add support to recent studies (Caruso et al. Reference Caruso, Trokhymets, Bargagli and Convey2013) challenging the long-held view that abiotic factors are the driving forces underlying spatial patterns and processes in the Antarctic terrestrial biota (Convey Reference Convey1996, Hogg et al. Reference Hogg, Craig, Convey, Newsham, O’Donnell, Adams, Aislabie, Frati, Stevens and Wall2006).
Materials and methods
Study sites
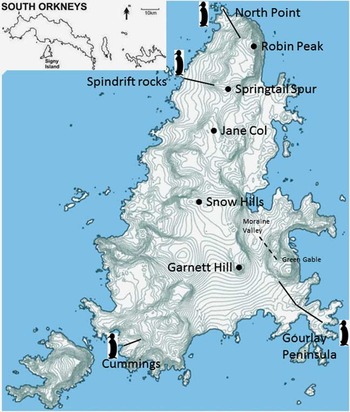
This study was performed on Signy Island (60°17'S 45°59'W) in the Maritime Antarctic region north-eastof the Antarctic Peninsula. The island is part of the South Orkney Islands archipelago, has an annual temperature of c. -2°C and receives c. 400 mm yr-1 of precipitation of which most falls as snow (Walton Reference Walton1982, Royles et al. Reference Royles, Amesbury, Convey, Griffiths, Hodgson, Leng and Charman2013). Up to 50% of the island’s surface is free of snow and ice during summer (December–February) exposing some of the best-developed and most diverse cryptogam communities in the Antarctic. There are four areas hosting large penguin colonies along the coastline of Signy Island (Fig. 1). The largest of these is at North Point, which is inhabited by Adélie (Pygoscelis adeliae (Hombron & Jacquinot)), chinstrap (P. antarctica Forster) and gentoo penguins (P. papua Forster) (total of 13 000 breeding pairs). The colony at Gourlay Peninsula is dominated by Adélie and chinstrap penguins (12 900 breeding pairs). Smaller colonies are situated along the west coast of the island, with the Cummings Cove area hosting 7000 chinstrap penguin pairs, and Spindrift Rocks 2000 pairs of Adélie penguins.
Map of Signy Island indicating the major penguin colonies. The lines represent the sampling transects along which samples of cryptogams and micro-arthropods were collected. The dashed line represents transects without penguin presence from the bottom of Moraine Valley to the top of Green Gable.

Sampling regime
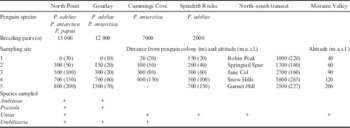
During December 2013, mosses, algae and lichens were sampled as close as possible to the four penguin colonies and at four additional sites at increasing distances away from each colony along each of three replicate transects, with sampling points separated by≥10 m from each other. Due to the differences in vegetation development and topography between the four colonies it was not possible to collect all cryptogam species from each transect and sampling distances from the penguin colonies differed (for details see Table I, Fig. 1). To determine the impact of cryptogam nitrogen concentrations on micro-arthropod communities across larger geographical scales lichens along the north–south axis of Signy Island were also sampled; thereby extending the transects starting from the North Point penguin colony. In addition, as some of the transects increased in altitude (≤200 m a.s.l.) at greater distance from the penguin colonies, three transects along a hillside remote from any penguin colonies were also included in order to control for any potential effect of altitude on micro-arthropod community composition (see Fig. 1).
Details of cryptogam sampling transects in relation to penguin colonies across Signy Island. For the exact location of each penguin colony and the locations of the north–south transect and Moraine Valley see Fig. 1. Distances from penguin colonies for the north–south transect were measured from North Point for Robin Peak, Springtail Spur and Jane Col, while Snow Hills and Garnet Hill were measured from the Gourlay Peninsula.

– Not present at site.
The study focused on the dominant lichen species Usnea antarctica (DuRietz) and Umbilicaria antarctica (Frey & I.M. Lamb), the moss Andreaea depressinervis (Card.) and the foliose alga Prasiola crispa (Lightfoot). Henceforth these species will be referred to by their genus name alone. Sampling from extensive moss carpets or turves was avoided in order to avoid artefacts caused by autocorrelation with the presence or extent of moss, which is known to be a preferred micro-habitat for many micro-arthropods (Davis Reference Davis1981, Usher & Booth Reference Usher and Booth1984, Bokhorst et al. Reference Bokhorst, Wardle, Nilsson and Gundale2014).
At each sampling site, Prasiola was collected with a PVC corer (7 cm diameter) including the underlying soil (at most 1 cm if any present) and stored in a plastic container. Moss and lichen clumps were collected by hand and also stored in individual plastic containers. Mean cryptogam dry mass was: 5.8 g (standard deviation=2.8) for Andreaea, 3.0 g (1.7) for Umbilicaria, 3.7 g (1.6) for Usnea and 1.8 g (0.9) for Prasiola. All samples were kept in the shade at ambient temperatures while in the field and at c. 5°C in the dark when stored at the station until extraction (within 24 h) in a modified Tullgren extractor for 24 h. Extracted Collembola and Acari were preserved in 70% ethanol and identified to species level, except for the smallest Prostigmata which were grouped together. Micro-arthropod abundance was expressed as the number of individuals per gram moss, algae or lichen. To obtain dry vegetation mass of each sample all soil and rock (if any) were removed and the remaining vegetation weighed when dry after completion of the micro-arthropod extractions. Moisture content of the sample was quantified by weighing each sample before and after placement in the Tullgren funnels.
Analyses of nitrogen and δ15N
Dried cryptogam samples were transported to Europe for nitrogen and stable isotope δ15N analyses. Nitrogen and δ15N were analysed using a Fisons NA 1500 elemental analyser coupled to a Finnigan conflo II interface, and a Finnigan MAT Delta S isotope ratio mass spectrometer. In addition, δ15N values were measured for adult individuals of the springtail Cryptopygus antarcticus Willem (c. 20 ind. per sample; 210 µg) and the mites Alaskozetes antarcticus (Michael) and Halozetes belgicae (Michael) (both c. 6 ind. per sample; 300 µg and 250 µg, respectively) to determine if penguin-derived nitrogen flows from the primary producers to these grazers. The δ15N analyses of micro-arthropods were carried out on samples extracted from Andreaea as the moss contained the highest micro-arthropod abundance. To remove any ethanol before analyses the micro-arthropods were placed in pre-weighed tin cups and oven dried (60°C) for 24 h. To quantify the biomass of the springtails and mites in each sample the cups were weighed again after drying before analysis of δ15N (mass ranged from 89–612 µg per sample).
Calculations and statistical analyses
To determine differences in nitrogen concentrations, δ15N, water content, abundance of total micro-arthropods, diversity (H’) and species richness along the penguin transects a mixed-effect model was used with distance to the penguin colony as fixed factor and site as a random factor for each of the cryptogam species separately. To compare the rate of change of cryptogam traits (%N, δ15N and water content) and the micro-arthropod community along transects the slopes of linear regression lines through the transect datapoints were compared using cryptogam species as fixed factor and site as a random factor. To determine the impact of penguin colonies on the micro-arthropod variables along greater spatial distances the same mixed-effect model was used as described above but limited to Usnea using data from the North Point and the north–south transects. To account for potential impacts of altitude (as a proxy for temperature) differences along the transects the differences in Usnea nitrogen concentrations, δ15N, water content and micro-arthropod variables were compared with altitude along penguin-influenced transects (North Point, Cummings Cove and Spindrift Rocks) and non-affected transects (Moraine Valley) with altitude as a fixed factor and site as a random factor. Correlation coefficients were calculated between the nitrogen, δ15N and water content of cryptogams and the micro-arthropod variables to explore which, if any, of these was a stronger driver behind observed patterns in community composition. Abundance data were log-transformed to achieve homogeneity of variance. All statistical analyses were carried out using SPSS 22.0 (IBM SPSS Statistics version 22.0, Armonk NY, US).
Results
Cryptogam nitrogen and water content
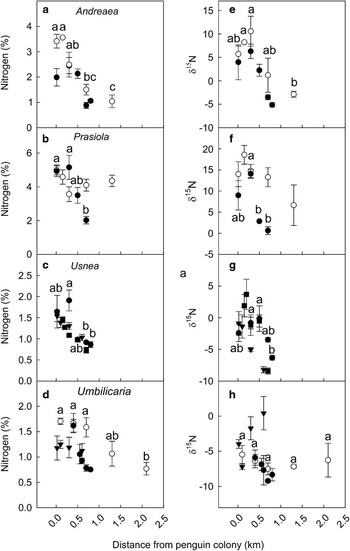
Nitrogen concentrations of cryptogams declined by nearly two-thirds with increasing distance from penguin colonies (Fig. 2a–d, Table II). Δ15N declined by between 5–15 units as the distance to penguin colonies increased, although the variation between species and different transects was large (Fig. 2e–h). For example, Prasiola showed no change in %N or δ15N along the Gourlay transect but it did along the North Point transects (Fig. 2b), while Andreaea showed declines in nitrogen along transects of both sites (Fig. 2a). The horizontal extent of the impact of the penguin colonies on cryptogam nitrogen concentrations and δ15N was c.700–1000 m for Andreaea, 500–750 m for Prasiola, 300–500 m for Usnea and 700–1500 m for Umbilicaria. Mean nitrogen concentrations and δ15N values were highest (F3,133=64.1 and 104.7 respectively; P<0.001) for Prasiola (4.1%, 10.4‰), followed by Andreaea (2.1%, 2.7‰), Usnea (1.1%, -2.4‰) and Umbilicaria (1.1%, -5.9‰). There were some differences in water content for individual cryptogams between sites and along transects (Table II) but not in a consistent pattern along transects (Fig. S1 found at http://dx.doi.org/10.1017/S0954102015000607). Mean water content was highest (ANOVA F3,133=30.4 P<0.001) for Prasiola (67%), followed by Umbilicaria (60%), Andreaea (52%) and Usnea (25%) (Table II).
Nitrogen concentrations (%N) and δ15N values of a. Andreaea depressinervis, b. Prasiola crispa, c. Usnea antarctica, and d. Umbilicaria antarctica along transects away from penguin colonies on Signy Island. Note that not all species were present along each transect. Different letters indicate significant differences (Tukey HSD P<0.05) in nitrogen or δ15N values between sampling sites. For clarity these differences are only presented for one transect but other transects show similar patterns. Datapoints are the mean of n=3 with standard error. ●=North Point, ○=Gourlay, ▼=Cummings Cove, ■=Spindrift Rocks.

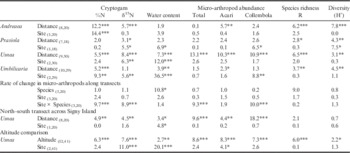
Mixed-effects ANOVA results of cryptogam differences in %N, δ15N, water content and micro-arthropods in relation to distance to penguin colonies. The change in micro-arthropods along transects compares the slopes of linear regression through the datapoints (Fig. 3). The north–south transect statistics show the comparison of the micro-arthropod community among Usnea from the North Point penguin colony to the southern tip of the island. The altitude statistics represent a comparison of the micro-arthropod community among Usnea along three penguin-associated transects to that of non-penguin-affected transects.

*P<0.05, **P<0.01, ***P<0.001.
Micro-arthropod communities in relation to distance from penguin colonies, cryptogam nitrogen and water content
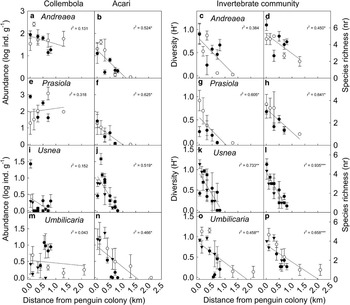
There were consistent declines in Acari abundance (3.9 ind. 100 m-1), species richness (0.2 species 100 m-1) and diversity (H’) (0.07 100 m-1) across cryptogam species and sites (Fig. 3, Table II) resulting in lower (Tukey HSD P<0.01) values at the furthest transect points compared to points closest to the penguin colonies. Change in Collembola abundance was variable between species and sites with larger changes along Gourlay compared to North Point transects among Prasiola and Umbilicaria resulting in no overall change in Collembola abundance along transects within the Prasiola samples (Fig. 3e). These variable Collembola patterns were also responsible for the significant species–site interactions for changes in total micro-arthropods (Table II).
Micro-arthropod abundance, diversity (H’) and species richness along transects away from penguin colonies on Signy Island. The data obtained were submitted to linear regression analysis. Significant r 2 are indicated by: *P<0.05, **P<0.01 and ***P<0.001. Datapoints are the mean of n=3 with standard error. ●=North Point, ○=Gourlay, ▼=Cummings Cove, ■=Spindrift Rocks.

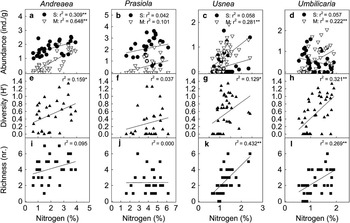
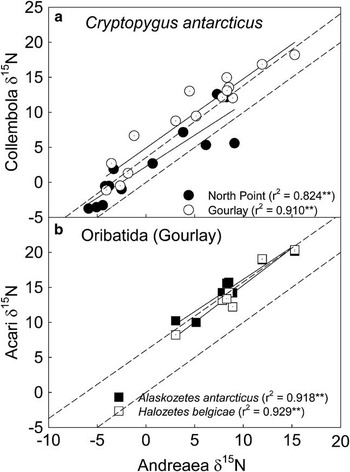
Micro-arthropod communities were positively correlated with nitrogen concentrations of the cryptogam species but not with that of Prasiola (Fig. 4). Acari abundance was significantly correlated with the nitrogen concentrations of all cryptogam species while Collembola abundance was significantly correlated with the nitrogen concentrations of Andreaea only (Fig. 4a). There were positive correlations between micro-arthropod diversity (H’) and the nitrogen concentrations of the cryptogams (but not that of Prasiola), and of species richness and nitrogen concentrations of the two lichens (Fig. 4). Δ15N for the collembolan Cryptopygus antarcticus was positively correlated with the δ15N values of Andreaea (Fig. 5a), and on average 3.6‰ (± 0.47) higher than the δ15N of the moss they were extracted from. Positive correlations were also found for δ15N of the mites Alaskozetes antarcticus and Halozetes belgicae with that of Andreaea (Fig. 5b), and δ15N was 5.8‰ (± 0.3) higher compared to the moss they were extracted from. There was no correlation between micro-arthropods (total abundance, Acari and Collembola) and tissue water content within cryptogam species. However, when compared across all samples (n=166), total micro-arthropod and Collembola abundance were positively correlated (r 2=0.15 and 0.24, respectively, P<0.05) with cryptogam water content, reflecting the potential impact of the different cryptogam growth forms and water holding capacity.
Regressions between micro-arthropod abundance, diversity (H’), richness with the nitrogen (%) concentration of Andreaea depressinervis, Prasiola crispa, Usnea antarctica and Umbilicaria antarctica. Datapoints are individual moss, alga and lichen samples collected along transects away from penguin colonies. Significant r 2 are indicated by: *P<0.05, **P<0.01 and ***P<0.001. S=springtails, m=mites.

Regressions between δ15N of Andreaea depressinervis and δ15N of micro-arthropods. a. δ15N of Cryptopygus antarcticus from the North Point and Gourlay transects. The upper dashed regression line through the springtail datapoints was 3.5‰ higher (Y=1.028X+3.54) than that of the moss (Y=X). b. δ15N of Alaskozetes antarcticus and Halozetes belgicae from the Gourlay transects. The upper dashed regression line through the mite datapoints was 5.8‰ higher (Y=0.974X+6.0) than that of the moss (Y=X). Significant r 2 are indicated by: *P<0.05, **P<0.01 and ***P<0.001.

Micro-arthropod communities across Signy Island and in relation to altitude
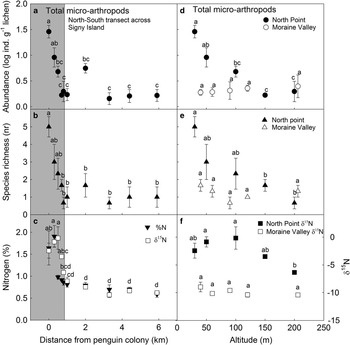
There were no differences in micro-arthropod abundance, diversity (H’) or species richness along the north–south transect across the island (Fig. 6). Nitrogen concentrations and δ15N did not differ along the north–south transect and the penguin impact on Usnea nitrogen concentrations was limited to c.300–500 m distance (Fig. 6c). There were no correlations between Usnea nitrogen concentrations and the micro-arthropod community along the north–south transect (data not shown). The penguin colony impact on micro-arthropod abundance, diversity (H’) and species richness in Usnea appears limited to c. 300–500 m distance as all more distant sampling sites showed no further differences (Fig. 6a & b). There was no difference in the micro-arthropod abundance or species richness across transects from Moraine Valley to Green Gable (Fig. 6d & e) indicating that there was no effect of altitude on the micro-arthropod community along the study transects. δ15N of Usnea did not change with altitude along the Moraine Valley transects (Fig. 6f) and there was no correlation with the micro-arthropod abundance or species richness. In comparison with the penguin colony-associated transects the micro-arthropod abundance, diversity (H’) and richness were consistently lower (Tukey HSD P<0.05) along the Moraine Valley transect (Table II, Fig. 6).
Micro-arthropod abundance and richness in Usnea antarctica across Signy Island and in relation to altitude. a. Abundance, b. species richness, and c. nitrogen (%N) and δ15N of Usnea along the North Point transects away from the penguin colony (grey shaded area) and the north–south transect across Signy Island. d. Abundance, e. species richness, and f. δ15N of Usnea in relation to altitude along transects with and without penguins. %N of Usnea follows the δ15N patterns but is not shown. Different letters indicate significant differences (Tukey HSD P<0.05) between sites. Datapoints are means of n=3 with standard error.

Micro-arthropod communities across cryptogam species
Species richness was highest (Tukey HSD P<0.01) in Andreaea (four species on average) compared to the other cryptogams (two to three species) (Table II). The lowest micro-arthropod diversity (H’) was found among Prasiola (mean H’ of 0.3 across all samples) while the other cryptogam species had higher (Tukey HSD P<0.05) mean values ranging from 0.5–0.7. In contrast, total micro-arthropod abundance was highest (Tukey HSD P<0.05) in Prasiola followed by Andreaea, Umbilicaria and Usnea (data not shown). Acari abundance did not differ between cryptogam species. Collembola abundance was consistently higher (Tukey HSD P<0.001) in Prasiola compared to the other cryptogam species, and Andreaea supported more Collembola than the two lichen species.
The predatory mite Gamasellus racovitzai (Trouessart) was found across all cryptogams but abundances were higher in Andreaea and Prasiola (data not shown). Abundance of the predatory mite G. racovitzai was positively correlated with Collembola (prey) abundance across all (n=126) cryptogam samples along transects (r 2=0.113, P<0.05) but this correlation improved (r 2=0.585, P<0.01) when only the Usnea data (n=42) were used, as no significant correlations were present among the other cryptogams individually (data not shown).
Discussion
This is one of the first studies to examine the role of cryptogam nutrient traits in relation to micro-arthropod communities, and the first to do this in the Antarctic. Our data provide clear support for the role of primary producers, as distinct from abiotic interactions, as a factor contributing to ecosystem development in terrestrial ecosystems of the Maritime Antarctic region (Hogg et al. Reference Hogg, Craig, Convey, Newsham, O’Donnell, Adams, Aislabie, Frati, Stevens and Wall2006, Caruso et al. Reference Caruso, Trokhymets, Bargagli and Convey2013). Although the spatial distribution of Antarctic terrestrial biodiversity is heavily influenced by temperature and water availability (Convey et al. Reference Convey, Chown, Clarke, Barnes, Bokhorst, Cummings, Ducklow, Frati, Green, Gordon, Griffiths, Howard-Williams, Huiskes, Laybourn-Parry, Lyons, McMinn, Morley, Peck, Quesada, Robinson, Schiaparelli and Wall2014), marine vertebrates clearly have a strong impact at local scales (Erskine et al. Reference Erskine, Bergstrom, Schmidt, Stewart, Tweedie and Shaw1998, Ellis Reference Ellis2005). Our findings are consistent with general patterns observed for vascular plants in more temperate regions (Loranger et al. Reference Loranger, Meyer, Shipley, Kattge, Loranger, Roscher and Weisser2012), and therefore, extend general understanding of the drivers of invertebrate abundance and diversity through traits of other important primary producers such as cryptogams (Bokhorst et al. Reference Bokhorst, Asplund, Kardol and Wardle2015).
Hypothesis i) was supported by the decrease in nitrogen concentrations and δ15N of cryptogams with increasing distance from penguin colonies. These findings are consistent with other studies from polar regions, where plant productivity increased closer to penguin colonies (Lindeboom Reference Lindeboom1984) and the stable isotope nitrogen signature of the primary producers was directly linked to the trophic level of the animals producing the faecal matter (Erskine et al. Reference Erskine, Bergstrom, Schmidt, Stewart, Tweedie and Shaw1998, Crittenden et al. Reference Crittenden, Scrimgeour, Minnullina, Sutton, Tang and Theobald2015). Similar to many plants in Arctic and temperate regions, Antarctic primary producers also tend to be nitrogen-limited in their growth (Davey & Rothery Reference Davey and Rothery1992, Wasley et al. Reference Wasley, Robinson, Lovelock and Popp2006), and penguin colonies greatly increase the availability of nitrogen for cryptogams. The direct impact of penguin colonies here on the nitrogen content (%N and δ15N) of cryptogams varied greatly between species and sites, ranging from 300–1500 m distance, which is within the range of observations from Marion Island (Erskine et al. Reference Erskine, Bergstrom, Schmidt, Stewart, Tweedie and Shaw1998), although Crittenden et al. (Reference Crittenden, Scrimgeour, Minnullina, Sutton, Tang and Theobald2015) reported detectable impacts of penguin-derived ammonia on lichen physiological activity at distances of up to 10 km. The lichen δ15N values with distance to the penguin colony reported at Cape Hallet (Crittenden et al. Reference Crittenden, Scrimgeour, Minnullina, Sutton, Tang and Theobald2015) are similar to the ones reported here and indicate that such patterns may also be found at other ecosystems affected by penguins.
The variation in nitrogen concentrations between species and sites with distance to penguin colonies was most probably caused by site specific factors. For example, nitrogen concentrations of Andreaea and Prasiola both declined along North Point transects but along the Gourlay transects this pattern was only found for Andreaea. This lack of response by Prasiola to the obvious nitrogen gradients that exist along the Gourlay transects, as shown by nitrogen concentration in Andreaea and Umbilicaria, may be caused by the decaying moss bank that underlies these transects (Smith Reference Smith1988) from which Prasiola may receive additional nitrogen, while Andreaea and Umbilicaria were sampled from rock and therefore not open to influence by nitrogen sources from below. However, there is no good explanation available for the differences in nitrogen content changes between Usnea and Umbilicaria along the Cummings Cove transects. Despite Signy Island being a relatively small island and nutrient inputs from sea spray and marine vertebrates generally being assumed to reach across the island (Allen et al. Reference Allen, Grimshaw and Holdgate1967) there were clear changes and limits (c.300–1500 m horizontal distance) detected here to the impact of penguin colonies on the nitrogen concentrations or δ15N of cryptogams. Additional factors that may have affected cryptogam δ15N values include the penguin population size, dominant penguin species within the colony and overall wind direction that carries the nitrogen towards the vegetation. A larger comparative study than that presented here would be required to take these factors into account.
The decreases in micro-arthropod abundance, diversity (H’) and species richness as distance to the penguin colonies increased provide support for Hypothesis ii). The micro-arthropod community values also showed strong correlations with cryptogam nitrogen concentrations indicating that this may be a driving force for community assembly at higher trophic levels in these Antarctic ecosystems. Water availability and temperature are typically considered as strong drivers of biological patterns in the Antarctic (Kennedy Reference Kennedy1993, Convey et al. Reference Convey, Chown, Clarke, Barnes, Bokhorst, Cummings, Ducklow, Frati, Green, Gordon, Griffiths, Howard-Williams, Huiskes, Laybourn-Parry, Lyons, McMinn, Morley, Peck, Quesada, Robinson, Schiaparelli and Wall2014), but we did not observe any effect of intra-specific cryptogam water content or site temperature (as altitude proxy) on the micro-arthropod community along the sampling transects. Although site temperature was only studied for Usnea, the Gourlay transects (including other cryptogams) showed strong declines in Acari abundance while only reaching a third of the altitude of other transects, indicating that altitude/temperature differences along these transects play a minor role for the studied species. The current data indicate that water and temperature are of less importance than nutrient availability at closer proximity (c. 500 m) to penguin colonies for Antarctic micro-arthropods at this Maritime Antarctic island. This suggests that, at relatively small geographical scales, different drivers of community assembly exist in Maritime Antarctic terrestrial ecosystems. The existence of such smaller scale gradients in driving forces behind community development allows for further detailed unravelling of these factors by manipulations of nutrient availability (Wasley et al. Reference Wasley, Robinson, Lovelock and Popp2006) and micro-climate (Bokhorst et al. Reference Bokhorst, Huiskes, Convey, Sinclair, Lebouvier, van de Vijver and Wall2011). Further work should ideally include other physiological variables such as phosphorus and defence compounds (Bokhorst et al. Reference Bokhorst, Asplund, Kardol and Wardle2015, Crittenden et al. Reference Crittenden, Scrimgeour, Minnullina, Sutton, Tang and Theobald2015).
The strong correlation between the δ15N of the micro-arthropods and that of the moss Andreaea (Fig. 5) indicates that the penguin-derived nitrogen is taken up by the moss and transferred to the micro-arthropods. The mean increase from moss to springtails was 3.6‰ and is consistent with changes generally associated between trophic levels (Peterson & Fry Reference Peterson and Fry1987). However, with the current data it is not possible to determine if the springtails feed on the live moss, the epiphytic micro-flora living among the moss shoots, or on decaying moss shoots. The 5.8‰ increase found for the mites compared to the moss (Fig. 5b) is higher than a single trophic level step, suggesting that the mites also feed from other food sources with higher δ15N values such as penguin faecal matter and dead animals (Goddard Reference Goddard1982, Schneider et al. Reference Schneider, Migge, Norton, Scheu, Langel, Reineking and Maraun2004). Despite these uncertainties the δ15N values showed a clear pattern along transects away from penguin colonies in both primary producers and consumers, with consistent declines in nitrogen concentrations and abundance, diversity and species richness of micro-arthropods. These results provide strong support for the existence of biotic interactions between primary producers and higher trophic levels in Antarctic terrestrial ecosystems.
The abundance of micro-arthropods, notably Collembola, was not always related to the nitrogen concentrations of the primary producers and, particularly, the Prasiola communities showed very poor correlations despite the large range in nitrogen concentrations measured (N: 1.6–6.2%). This indicates that other characteristics of cryptogams, such as phosphorus, defence compounds against herbivory and growth form affecting the micro-habitat conditions, may also have played a role (Asplund & Wardle Reference Asplund and Wardle2013, Bokhorst et al. Reference Bokhorst, Asplund, Kardol and Wardle2015). Overall, the highest micro-arthropod abundance and diversity were found among Andreaea and Prasiola compared to the lichens. These differences most probably reflect the differences in nitrogen concentrations, growth form and water content (there were significant correlations with water content when compared across all sampled cryptogams, as opposed to the low variation within species). The compact growth of moss shoots provides a more stable micro-environment than the open structure of the lichen thallus, and moss has been shown to have a strong positive effect on the abundance of micro-arthropods in other parts of the world (Salmane & Brumelis Reference Salmane and Brumelis2008, Bokhorst et al. Reference Bokhorst, Wardle, Nilsson and Gundale2014). The collembolan Cryptopygus antarcticus is known to have poor control over its body water content (Block & Harrisson Reference Block and Harrisson1995, Convey et al. Reference Convey, Block and Peat2003), and therefore, would be less prone to desiccation when within the moss profile. Similarly, the foliose alga Prasiola, whose 3D structure is typified by much folding and many small protected cavities, provides a continuous moist environment optimal for these micro-arthropods. The high abundance of micro-arthropods among Prasiola compared to the cryptogams was most probably driven by the preference for algae as a food source by at least some of these micro-arthropods (Worland & Lukešová Reference Worland and Lukešová2000, Bokhorst et al. Reference Bokhorst, Ronfort, Huiskes, Convey and Aerts2007b) and the availability of optimal moisture conditions. The main driving forces underlying the distribution of consumers within Antarctic terrestrial ecosystems may therefore depend on the specific requirements for growth and avoidance of adverse abiotic conditions of individual species of micro-arthropod. Further work comparing a larger range of cryptogam growth forms than used in this study would be required to determine the role of these for the invertebrate communities in the Antarctic.
The current findings indicate a strong link between the nitrogen concentrations of Antarctic primary producers, such as mosses and lichens, and the community composition of associated micro-arthropods. These data extend the general understanding of the influence of nutrient concentrations in cryptogams on community assembly of invertebrates. Although the data indicate that the impact of marine vertebrates on cryptogam nutrients and micro-arthropod community development is important, it also declines at relatively short distances (c.300–1500 m) from the source. Micro-arthropod biodiversity patterns in the Maritime Antarctic are driven by availability of water and temperature when considered across large geographical scales, but biotic interactions can clearly become more important at the local scale.
Acknowledgements
This work would not have been possible without the logistical support of the British Antarctic Survey. Fieldwork for SB was supported by an Antarctic Science Bursary. PC is supported by core funding from NERC to the BAS ‘Biodiversity, Adaptation and Evolution’ programme. The paper was improved by the constructive comments of two anonymous reviewers. This paper also contributes to the SCAR ‘Antarctic Thresholds – Ecosystem Resilience and Adaptation’ (AnT-ERA) and ‘State of the Antarctic Ecosystem’ (AntEco) programmes.
Author contribution
SB and PC designed the experiment and wrote the paper. SB was responsible for the fieldwork, lab and data analyses.
Supplementary Material
A supplemental figure will be found at http://dx.doi.org/10.1017/S0954102015000607.