1. Introduction
If we are to understand how the evolving climate of Asia has impacted the tectonic development of the Himalaya and Tibetan Plateau, or vice versa, we must use the sedimentary records in basins adjacent to these mountain ranges in order to reconstruct the long-term history of exhumation caused by erosion. Thermochronology measurements on bedrock currently exposed at the surface only provide constraints on the most recent stages of the cooling history of those particular units. By definition, older bedrock has been removed, so the older erosional history can only be reconstructed through study of the sedimentary record. However, interpreting the sedimentary record can be complicated if burial of sediment resets sensitive low-temperature thermochronometers, eliminating the cooling history of the source bedrocks (Carter, Reference Carter1999). Although higher temperature methods (e.g. muscovite Ar–Ar dating) (White et al. Reference White, Pringle, Garzanti, Bickle, Najman, Chapman and Friend2002; Szulc et al. Reference Szulc, Najman, Sinclair, Pringle, Bickle, Chapman, Garzanti, Ando, Huyghe, Mugnier, Ojha and DeCelles2006) can be useful in examining past erosion and are resistant to resetting, these have the disadvantage of being less sensitive to changes in the rates of exhumation by erosion, because they require a greater amount of exhumation between isotopic closure and exposure at the surface. Nonetheless, detrital apatite fission track (AFT) thermochronology can also have resolution problems, because single grain ages are often imprecise, especially for young grains with very low track counts.
A number of studies have examined the history of erosion in the Himalaya using the foreland basin sediment record, in particular sedimentary rocks belonging to the Miocene–Pliocene Siwalik Group (Cerveny et al. Reference Cerveny, Johnson, Tahirkheli, Bonis, Malinconico and Lillie1989; Ghosh & Kumar, Reference Ghosh and Kumar2000; Bernet et al. Reference Bernet, van der Beek, Pik, Huyghe, Mugnier, Labrin and Szulc2006; Najman, Reference Najman2006; van der Beek et al. Reference van der Beek, Robert, Mugnier, Bernet, Huyghe and Labrin2006; Chirouze et al. Reference Chirouze, Huyghe, van der Beek, Chauvel, Chakraborty, Dupont-Nivet and Bernet2013; Baral et al. Reference Baral, Lin and Chamlagain2016; Chirouze et al. Reference Chirouze, Huyghe, Chauvel, van der Beek, Bernet and Mugnier2015). Although this stratigraphic unit has provided useful information about past patterns and rates of erosion, the quality of information from AFT thermochronology has been limited due to resetting caused by post-deposition burial, especially in the lower parts of the section (van der Beek et al. Reference van der Beek, Robert, Mugnier, Bernet, Huyghe and Labrin2006). In addition, the foreland basin sequence at any one particular location will typically reflect the rivers that are flowing from the Himalaya at that point, providing a localized record. Although this may be very useful for examining single rivers, it is often hard to judge how effective each sequence might be in reconstructing erosion at the regional scale. For example, because the trunk Indus River lies on the western edge of the drainage, Siwalik Group rocks in the eastern parts of the catchment provide no information about how its sediment load may have evolved.
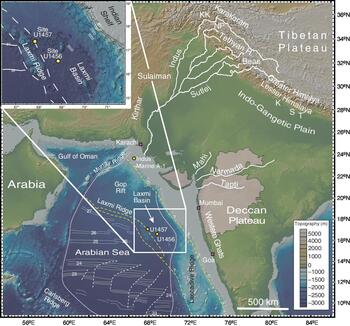
In this study, we present AFT data from new scientific boreholes in the western Indian Ocean in order to derive a regional image of changing erosion rates within the western Himalaya since c. 15.5 Ma, and in particular after 9 Ma. Use of the International Ocean Discovery Program (IODP) boreholes in the Laxmi Basin (Fig. 1) (Pandey et al. Reference Pandey, Clift, Kulhanek, Andò, Bendle, Bratenkov, Griffith, Gurumurthy, Hahn, Iwai, Khim, Kumar, Kumar, Liddy, Lu, Lyle, Mishra, Radhakrishna, Routledge, Saraswat, Saxena, Scardia, Sharma, Singh, Steinke, Suzuki, Tauxe, Tiwari, Xu, Yu, Pandey, Clift and Kulhanek2016b) has the advantage that the sediment thickness is low (<1.1 km) and the geothermal gradient is 53 °C km−1 and 57 °C km−1 at sites U1456 and U1457, respectively (Pandey et al. Reference Pandey, Clift, Kulhanek, Andò, Bendle, Bratenkov, Griffith, Gurumurthy, Hahn, Iwai, Khim, Kumar, Kumar, Liddy, Lu, Lyle, Mishra, Radhakrishna, Routledge, Saraswat, Saxena, Scardia, Sharma, Singh, Steinke, Suzuki, Tauxe, Tiwari, Xu, Yu, Pandey, Clift and Kulhanek2016b). Although these are high values, the low thickness means that even the base of the section will fall below temperatures required to cause significant annealing or resetting of fission tracks in apatite, i.e. ∼60–110 °C (Green, Reference Green1989), and therefore the original cooling history of the bedrock sources will be preserved. All but one of the samples were recovered from depths shallower than 722 metres below seafloor (mbsf), implying no more than 38 °C burial temperature at the present maximum burial depth. The deepest sample (U1456E-19R-3, 10–20 cm) was recovered from a depth of 1103 mbsf, but the fission track ages are older than the depositional age, indicating that this too is not reset.
Shaded bathymetric and topographic map of the Arabian Sea area showing the location of the drilling sites within the Laxmi Basin. Map also shows the primary source ranges and the major tributary systems of the Indus River, as well as smaller peninsular Indian rivers that may have provided material to the drill sites. Magnetic anomalies are from Miles & Roest (Reference Miles and Roest1993). KK – Karakoram; NP – Nanga Parbat; K – Karnali; S – Surai Khola; T – Tinau Khola.

Constraining rates of bedrock source cooling caused by erosion driven by rock uplift can help identify locations of active tectonics and the rates and patterns of mountain growth. However, climate change may also play a role in relation to variations in precipitation rate that are linked to the intensity of the South Asian monsoon. This is known to have varied significantly throughout the Cenozoic (Quade et al. Reference Quade, Cerling and Bowman1989; Kroon et al. Reference Kroon, Steens, Troelstra, Prell and Niitsuma1991; Prell et al. Reference Prell, Murray, Clemens, Anderson, Duncan, Rea, Kidd, von Rad and Weissel1992; Gupta et al. Reference Gupta, Yuvaraja, Prakasam, Clemens and Velu2015; Betzler et al. Reference Betzler, Eberli, Kroon, Wright, Swart, Nath, Alvarez-Zarikian, Alonso-García, Bialik, Blättler, Guo, Haffen, Horozai, Inoue, Jovane, Lanci, Laya, Mee, Lüdmann, Nakakuni, Niino, Petruny, Pratiwi, Reijmer, Reolid, Slagle, Sloss, Su, Yao and Young2016). Debate continues concerning the history of strengthening of the South Asian monsoon, but increasingly there is a consensus that the climate began to dry after 8 Ma (Behrensmeyer et al. Reference Behrensmeyer, Quade, Cerling, Kappelman, Khan, Copeland, Roe, Hicks, Stubblefield, Willis and Latorre2007; Singh et al. Reference Singh, Parkash, Awasthi and Kumar2011; Clift, Reference Clift2017), following a period of maximum intensity in Middle Miocene time (Clift et al. Reference Clift, Hodges, Heslop, Hannigan, Hoang and Calves2008). It has been suggested that it was the strength of the summer monsoon rains during Middle Miocene time that resulted in rapid exhumation of the Greater Himalaya at that time driven by strong erosion (Clift et al. Reference Clift, Hodges, Heslop, Hannigan, Hoang and Calves2008). If that is true, one might predict that the rate of erosion since that time was also coupled with monsoon intensity. However, work within the foreland sedimentary rocks of the Siwalik Group in Nepal shows that the rate of exhumation in the central Nepalese Himalaya remained essentially constant after 8 Ma (van der Beek et al. Reference van der Beek, Robert, Mugnier, Bernet, Huyghe and Labrin2006). In contrast, the same study argued that rates of erosion had increased between 8 and 3 Ma in western Nepal, despite the fact that both sections lie within the Ganges drainage system, which is wetter than the Indus Basin considered here (Bookhagen & Burbank, Reference Bookhagen and Burbank2006). In contrast, AFT data from Ocean Drilling Program (ODP) sites 717 and 718 on the Bengal Fan showed that rapid rates of exhumation of the bedrock sediment sources to the Ganges–Brahmaputra basin have been ongoing since Middle Miocene time (Corrigan & Crowley, Reference Corrigan, Crowley, Cochran and Stow1990). Reappraisal of this data by van der Beek et al. (Reference van der Beek, Robert, Mugnier, Bernet, Huyghe and Labrin2006) indicated relatively constant lag times (i.e. the difference between the depositional age and the AFT cooling) since 9 Ma, suggestive of uniform erosion rates.
There are few constraints over how erosion rates might have changed during the Pleistocene Epoch. While some have argued that the onset of northern hemisphere glaciation (NHG) has intensified rates of erosion during the last couple of million years (Métivier et al. Reference Métivier, Gaudemer, Tapponnier and Klein1999; Zhang et al. Reference Zhang, Molnar and Downs2001; Clift, Reference Clift2006), other workers, drawing on cosmogenic isotope data (Willenbring & von Blanckenburg, Reference Willenbring and von Blanckenburg2010), suggested that continental weathering rates have remained essentially steady-state during the Neogene and especially the Plio-Pleistocene periods. Such an observation does not require faster sediment delivery to the ocean, although this was proposed from a global data compilation implying a steady-state supply of sediment spanning tens of millions of years (Sadler & Jerolmack, Reference Sadler, Jerolmack, Smith, Bailey, Burgess and Fraser2014). Here we provide the first detailed AFT constraints on erosion rates in the western Himalaya, within the Indus Basin, in order to see whether the temporal evolution in that region mirrors that found in Nepal and in the Ganges–Brahmaputra drainage basin.
Over the period since 15.5 Ma considered by this study, the western Himalaya have experienced significant tectonic changes. The Lesser Himalaya were brought to the surface because of duplexing above the Main Boundary Thrust (MBT) (Mugnier et al. Reference Mugnier, Huyghe, Chalaron and Mascle1994; Huyghe et al. Reference Huyghe, Galy, Mugnier and France-Lanord2001), coupled with focused erosion since Late Miocene time. There is continued debate about when unroofing of the Lesser Himalaya might have occurred. Early studies suggested that the MBT initiated c. 10–11 Ma (Meigs et al. Reference Meigs, Burbank and Beck1995) allowing the Lesser Himalayan Duplex to form and be uplifted and then eroded. Work from the Siwalik Group in NW India points to an initial exposure of the Lesser Himalaya at c. 9 Ma followed by more widespread exposure after 6 Ma (Najman et al. Reference Najman, Bickle, Garzanti, Pringle, Barfod, Brozovic, Burbank and Ando2009), although this may be only applicable to the Beas River area (Fig. 1). Nd and zircon U–Pb data from IODP sites U1456 and U1457 now suggest initial exposure after 8.3 Ma and widespread unroofing after 1.9 Ma (Clift et al. Reference Clift, Zhou, Stockli and Blusztajn2019b). Other potentially important sources of sediment to the submarine fan include the Nanga Parbat Massif that is located next to the Indus River in the western syntaxis (Fig. 1). Provenance studies from the Indus River downstream of Nanga Parbat indicate that this massif has only limited sediment-generating potential at the present time (Clift et al. Reference Clift, Lee, Hildebrand, Shimizu, Layne, Blusztajn, Blum, Garzanti and Khan2002b; Lee et al. Reference Lee, Clift, Layne, Blum and Khan2003; Garzanti et al. Reference Garzanti, Vezzoli, Ando, Paparella and Clift2005), despite the start of uplift c. 6 Ma (Chirouze et al. Reference Chirouze, Huyghe, Chauvel, van der Beek, Bernet and Mugnier2015). In contrast, its eastern equivalent (Namche Barwe) is believed to be a major source of sediment to the Brahmaputra (Garzanti et al. Reference Garzanti, Vezzoli, Ando, France-Lanord, Singh and Foster2004; Stewart et al. Reference Stewart, Hallet, Zeitler, Malloy, Allen and Trippett2008). Bedrock thermochronology measurements testify to Nanga Parbat being very rapidly exhumed in the recent geologic past (Zeitler et al. Reference Zeitler, Chamberlain and Smith1993), but this does not seem to generate much of the sediment in the river downstream of that point (Alizai et al. Reference Alizai, Carter, Clift, VanLaningham, Williams and Kumar2011). Zircon fission track (ZFT) and Nd isotope data in the western part of the Siwalik ranges in Pakistan indicate that this massif and other Himalayan units in the western syntaxis may have become more important as a sediment source after c. 6 Ma (Chirouze et al. Reference Chirouze, Huyghe, Chauvel, van der Beek, Bernet and Mugnier2015). The sedimentary record in the Indus Fan may have also been affected by large-scale drainage capture. Nd isotope measurements on samples from an industrial drill site on the Indus shelf, as well as limited ODP samples from the upper fan, were used to argue that the eastern tributaries of the Indus River were only captured into the modern system after 5 Ma (Clift & Blusztajn, Reference Clift and Blusztajn2005). However, this is contradicted by combined ZFT and Nd isotope data that support relative stability in drainage patterns but changing rates of erosion in the Himalaya and Karakoram since Miocene time (Chirouze et al. Reference Chirouze, Huyghe, Chauvel, van der Beek, Bernet and Mugnier2015).
2. Regional setting
IODP Expedition 355 sampled sediments from the Indus Fan deposited within the Laxmi Basin offshore western India (Fig. 1). Although the Laxmi Basin is separated from the main Arabian Basin by the Laxmi Ridge, the bathymetry of the basin and the orientation of active channels (Mishra et al. Reference Mishra, Pandey, Ramesh and Clift2016) indicate that the primary source of sediment to the coring locations would be the Indus River, with lesser input from peninsular rivers such as the Tapti and Narmada. Initial petrographic-based interpretations of the sediments made shipboard during the expedition suggested that there were limited amounts of sediment delivery from western India, and it tended to be found only in the youngest parts of the section (Pandey et al. Reference Pandey, Clift, Kulhanek, Andò, Bendle, Bratenkov, Griffith, Gurumurthy, Hahn, Iwai, Khim, Kumar, Kumar, Liddy, Lu, Lyle, Mishra, Radhakrishna, Routledge, Saraswat, Saxena, Scardia, Sharma, Singh, Steinke, Suzuki, Tauxe, Tiwari, Xu, Yu, Pandey, Clift and Kulhanek2016a).
The Laxmi Basin itself dates from the latest Cretaceous period when India began to separate from the Seychelles (Bhattacharya et al. Reference Bhattacharya, Chaubey, Murty, Srinivas, Sarma, Subrahmanyam and Krishna1994; Pandey et al. Reference Pandey, Agrawal and Negi1995). Following the onset of India–Asia collision, c. 50–60 Ma (Najman et al. Reference Najman, Appel, Boudagher-Fadel, Bown, Carter, Garzanti, Godin, Han, Liebke, Oliver, Parrish and Vezzoli2010; DeCelles et al. Reference DeCelles, Kapp, Gehrels and Ding2014), the uplift and erosion of the Himalaya have resulted in a huge flux of sediment into the Arabian Sea. Although the Indus Fan is much smaller than the Bengal Fan, it is nonetheless the second largest sediment body on Earth and is believed to have accumulated sediment eroded from the mountains at least since 45 Ma (Clift et al. Reference Clift, Shimizu, Layne, Gaedicke, Schlüter, Clark and Amjad2001).
Drilling during Expedition 355 recovered a section that penetrated to basement at Site U1457 (Fig. 2), but because of large-scale mass wasting (Dailey et al. Reference Dailey, Clift, Kulhanek, Blusztajn, Routledge, Calvès, O’Sullivan, Jonell, Pandey, Andò, Coletti, Zhou, Li, Neubeck, Bendle, Bratenkov, Griffith, Gurumurthy, Hahn, Iwai, Khim, Kumar, Kumar, Liddy, Lu, Lyle, Mishra, Radhakrishna, Saraswat, Saxena, Scardia, Sharma, Singh, Steinke, Suzuki, Tauxe, Tiwari, Xu and Yu2019), the most complete erosional record only spans the last 10.8 Myr, with much of the older sediment either missing, owing to erosion or non-deposition, or not sampled. Coring was undertaken at two sites, Site U1456 in the central part of the Laxmi Basin, as well as at Site U1457 located on the flanks of the Laxmi Ridge (Fig. 1). In general, the sediment at Site U1456 tended to be coarser grained (Fig. 2). The entire sedimentary cover is also more complete at Site U1456 than at Site U1457. The coarse-grained, sandy sediment that forms the focus of this study was taken from both sites and is the product of turbidity current flows. Nonetheless, significant parts of the section are fine-grained muddy facies together with carbonate-rich intervals, and these are interbedded with sandy turbidite material caused by sedimentation on depositional lobes within the middle fan (Fig. 2). There are also interbeds of calcareous-rich pelagic material that reflect times when the main Indus-sourced depocentre was located to the west of the Laxmi Ridge, so that the primary clastic flux from the Indus River was not reaching the drilling area. Because the drilling sites are located above the carbonate compensation depth (CCD), it was possible to date the age of sedimentation using a combination of nannofossil and foraminifera biostratigraphy coupled with magnetostratigraphy that provides a relatively robust age model (Pandey et al. Reference Pandey, Clift, Kulhanek, Andò, Bendle, Bratenkov, Griffith, Gurumurthy, Hahn, Iwai, Khim, Kumar, Kumar, Liddy, Lu, Lyle, Mishra, Radhakrishna, Routledge, Saraswat, Saxena, Scardia, Sharma, Singh, Steinke, Suzuki, Tauxe, Tiwari, Xu, Yu, Pandey, Clift and Kulhanek2016b). Drilling was able to penetrate a thick mass transport deposit (MTD) deposited just before 10.8 Ma (Calvès et al. Reference Calvès, Huuse, Clift and Brusset2015), but at Site U1456 coring was able to recover a short interval below the MTD, providing a single sample that is substantially older than any of the other sediments recovered and which has been approximately dated at 15.5 Ma (Pandey et al. Reference Pandey, Clift, Kulhanek, Andò, Bendle, Bratenkov, Griffith, Gurumurthy, Hahn, Iwai, Khim, Kumar, Kumar, Liddy, Lu, Lyle, Mishra, Radhakrishna, Routledge, Saraswat, Saxena, Scardia, Sharma, Singh, Steinke, Suzuki, Tauxe, Tiwari, Xu, Yu, Pandey, Clift and Kulhanek2016a). At Site U1457 all fan sediment pre-dating the mass wasting event had been removed, so our studies are restricted to the section younger than 10.8 Ma at that location.
Simplified lithologic logs of the two drill sites considered in this study. Black arrows show the location of the samples analysed. MTD – Mass Transport Deposit.

We apply the AFT thermochronology dating method to this sediment in order to understand how the source rocks that provided material to the Arabian Sea evolved in their cooling and exhumation history since Middle Miocene time. Fission track studies are a well-established method for looking at bedrock unroofing and potentially also sediment provenance if the source regions themselves are sufficiently well defined and if cooling ages are relatively constant in a source area (Laslett et al. Reference Laslett, Green, Duddy and Gleadow1987; Green et al. Reference Green, Duddy, Laslett, Hegarty, Gleadow and Lovering1989; Carter, Reference Carter1999). In a complex area like the western Himalaya, cooling ages vary across tectonic blocks and through time, so the interpretation of the AFT ages is contingent on supporting provenance data and cannot be used to constrain provenance by themselves. In this study we draw on zircon U–Pb age data from these same boreholes (Clift et al. Reference Clift, Zhou, Stockli and Blusztajn2019b). Simple comparison of modern bedrock AFT ages and detrital AFT ages in sediments more than around a million years old is not justifiable, because the cooling rates of the bedrock will change on such timescales.
3. Methodology
Low-temperature AFT central ages reflect cooling through 60–110 °C over time scales of 1–10 Myr (Green et al. Reference Green, Duddy, Laslett, Hegarty, Gleadow and Lovering1989). Fission tracks form continuously through time at an abundance determined by the concentration of 238U in the host apatite grain (Haack, Reference Haack1977). The method has been widely used and is effective for studying the exhumation history and provenance of shallow-buried sediment (Gallagher et al. Reference Gallagher, Hawkesworth and Mantovani1995; Carter, Reference Carter2007). Samples were taken where suitable sandy material was available at both IODP sites, as shown in Figure 2 and Table 1. Some of the apatites were extracted from the same samples analysed for detrital zircon U–Pb dating by Clift et al. (Reference Clift, Zhou, Stockli and Blusztajn2019b).
List of the samples with their depths and calculated depositional ages. Samples also analysed for detrital U–Pb zircon dating by Clift et al. (Reference Clift, Zhou, Stockli and Blusztajn2019b) are highlighted

Following mineral separation, AFT analysis was performed at the London Geochronology Centre based at University College London, UK. Polished grain mounts of apatite were etched with 5N HNO3 at 20 °C for 20 seconds to reveal the spontaneous fission tracks. Subsequently, the uranium content of each crystal was determined by irradiation, which induced fission in a proportion of the 235U. The induced tracks were registered in mica external detectors. The samples for this study were irradiated in the FRM 11 thermal neutron facility at the University of Munich, Germany. The neutron flux was monitored by including Corning glass dosimeter CN-5, with a known uranium content of 11 ppm, at either end of the sample stack. After irradiation, sample and dosimeter mica detectors were etched in 40 % HF at 20 °C for 25 minutes. Only crystals with sections parallel to the c-crystallographic axis were counted, as these crystals have the lowest bulk etch rate. To avoid biased results through preferred selection of apatite crystals, the samples were systematically scanned and each crystal encountered with the correct orientation was analysed, irrespective of track density. The results of the fission track analysis are presented in Table 2 and online Supplementary Material Table S1. The chi test, used to detect extra Poisson variation, does not show how much over-dispersion is present in the dataset. Therefore, we include the central age and its percentage relative error, because this provides a measure of the extent of age dispersion. It is also useful when there are low track counts (young ages), as the chi test is unreliable under these conditions.
Summary of apatite fission track analytical data

Track densities are (×106 tr cm−2) numbers of tracks counted (N) shown in brackets. Analyses by external detector method using 0.5 for the 4π/2 π geometry correction factor. Ages calculated using dosimeter glass CN-5; (apatite) ζCN5 = 338 ± 5; calibrated by multiple analyses of IUGS apatite and zircon age standards (Hurford, Reference Hurford1990). Pχ2 is probability for obtaining χ2 value for v degrees of freedom, where v = no. crystals – 1. Central age is a modal age, weighted for different precisions of individual crystals (see Galbraith, Reference Galbraith1990). Minimum age model after Galbraith (Reference Galbraith2005). P2 used the peak fitting algorithm of Galbraith & Green (Reference Galbraith and Green1990) where there are >10 grains.
4. Results
Because all samples showed evidence of over-dispersion, we examined the range of single grain AFT ages in each sample using a combination of kernel density estimate (KDE) plots following the method of Vermeesch (Reference Vermeesch2012) and the radial diagrams of Galbraith (Reference Galbraith1990) (Fig. 3). Plots that combine both types of data presentation are known as abanico plots (Dietze et al. Reference Dietze, Kreutzer, Burow, Fuchs, Fischer and Schmidt2016). In the radial plots, the single grain ages are plotted away from a central point on the left side of each diagram, with higher accuracy measurements plotted closer to the right-hand curved y-axis against which the ages are measured. This approach allows populations of grains with similar ages but varying degrees of uncertainty to be identified as arrays. In this particular study, we focus on the identification of a minimum age population extracted using the algorithm of Galbraith (Reference Galbraith2005) that clusters in an array and trends towards the y-axis on the right-hand side of each diagram. This avoids problems associated with a general purpose, multi-component mixture model that can give a biased estimate of the minimum age towards younger values with increasing sample size. The radial plots show if there is a single source (single array) or multiple sources, if there is more than one array. Figure 3 and Table 2 show samples that have a second age component (P2) as defined by ten or more grains. In all cases the majority of analysed grains defines the minimum age and represents the time at which the dominant bedrock sources cooled through the AFT partial annealing zone (PAZ).
(a–f) Radial plots and associated KDE spectra (abanico plots) showing the range of apatite fission track ages for each of the samples considered within the study (Galbraith, Reference Galbraith1990). Ns – number of spontaneous fission tracks; Ni – number of induced tracks. Single ages are plotted with standard errors according to their precision (1/σ on the x-axis). The error attached to each plotted point is standardized on the y scale. The value of the age and the 2σ uncertainty can be read off the radial axis by extrapolating lines from point 0,0 through the plotted age. (g–l) Radial plots and associated KDE spectra (abanico plots) showing the range of apatite fission track ages for each of the samples considered within the study (Galbraith, Reference Galbraith1990). (m–r) Radial plots and associated KDE spectra (abanico plots) showing the range of apatite fission track ages for each of the samples considered within the study (Galbraith, Reference Galbraith1990). (s–x) Radial plots and associated KDE spectra (abanico plots) showing the range of apatite fission track ages for each of the samples considered within the study (Galbraith, Reference Galbraith1990).

In each case, we also show the calculated depositional age derived from the shipboard biostratigraphy and magnetic stratigraphy (Fig. 3). The minimum ages are older than or concordant with the depositional age, as might be expected in a relatively shallow borehole in which the temperatures are not elevated above those known to reset fission tracks in apatite crystals. All samples have minimum ages less than 20 Ma, and P2 AFT ages are all less than 40 Ma (apart from the youngest sample), post-dating the initial collision of India and Asia. There are particularly noteworthy concentrations of grain ages between 3 and 20 Ma. Fifty per cent of samples have a minimum age younger than 10 Ma. The minimum age gets younger with decreasing depositional age, but not in a systematic way. The age difference between the minimum age and depositional age is <5 Myr for most samples, i.e. short lag times, but increases for samples deposited between 7.84 and 8.2 Ma, as well as 7.07 and 7.28 Ma. The youngest sample (U1456A-11H-6, 60–69 cm) is unlike many of the others in showing significantly older AFT ages (Fig. 3).
The youngest deposited sample is anomalous in having a minimum age population of 20.7 Ma, despite only having been deposited around 930 ka (Fig. 3a). This may be due to the sample containing fewer apatites, with only 24 grains being countable, which is the smallest number out of all samples analysed. This is in strong contrast with the much younger minimum ages of the directly underlying samples. It is only the very oldest sample (∼15 Ma, U1456E-19R-3, 10–20 cm) that also has a minimum age of that value, but that sample has a short lag time (Fig. 3x). We can assess the possible impact of low grain numbers on the critical minimum age result in Figure 4. This plot shows that there is no correlation between the number of grains and the minimum age, only reinforcing the fact that samples with low numbers of grains have larger uncertainty in the result, but not causing short lag times.
Cross-plot of numbers of grains compared to minimum ages with 2σ uncertainties displayed. There is no correspondence between the numbers of grains and the minimum age that might bias the result of the lag time analysis.

The core is not altered or veined, and the modern maximum burial temperature of the samples with lag times close to zero is far too cool to have affected the AFT ages. The ages are within error of the depositional age, not resolvably younger, especially considering uncertainties in the depositional age too, although sample U1456D-12R-1 30–36 cm (Fig. 3m) has a minimum age population slightly younger (6.6 ± 1.5 Ma) than the calculated depositional age (7.0 Ma) but within error of that value and need not be reset. Moreover, the young ages are also accompanied by older age populations that are also consistent with the sediment not being thermally reset, as well as with the modern borehole temperatures being well below the apatite PAZ (556 mbsf (29.4 °C) at Site U1456; 572–590 mbsf (32.6–33.6 °C) at Site U1457).
5. Discussion
The fact that all of our AFT ages are relatively young and mostly postdate the widely accepted times of India–Asia collision is a clear indication that they are derived from Himalayan/Karakoram sources supplied by the Indus River and, with the exception of the youngest sample, not from Peninsular India. Ancient rocks of the Indian peninsula have not been substantially deformed and uplifted during Cenozoic time, and basement AFT ages are mostly Jurassic–Cretaceous. Although they range as young as 54 Ma (Kalaswad et al. Reference Kalaswad, Roden, Miller and Morisawa1993; Gunnell et al. Reference Gunnell, Gallagher, Carter, Widdowson and Hurford2003), 95 % of the ages measured are older than 100 Ma, averaging 228 Ma (Fig. 5h). This is somewhat older than most of the grain ages in Sample U1456A-11H-6, 60–69 cm (Fig. 3a), but does match the P2 older population in that sample (Table 2). Nonetheless, the minimum age population of 20.7 ± 3.8 Ma requires a Himalaya–Karakoram provenance for 14 of the 24 grains measured. U–Pb zircon ages from this same sample (Clift et al. Reference Clift, Zhou, Stockli and Blusztajn2019b) show that 8 % of the grains date to <200 Ma, requiring derivation from the Indus River, because such zircon ages can only be generated by erosion from Kohistan or Karakoram sources. Zircon grains older than 300 Ma could be from the peninsula or the Tethyan/Greater Himalaya. This youngest sample seems likely to be of mixed provenance, with material from both the Indus and the peninsula. For the other samples, the AFT data argue strongly for the sand at these drilling sites being entirely derived from the Indus River, because they are generally much younger than AFT ages from the western margin of Peninsular India and broadly consistent with the AFT ages derived from sands that are definitely of Indus derivation (Clift et al. Reference Clift, Campbell, Pringle, Carter, Zhang, Hodges, Khan and Allen2004, Reference Clift, Giosan, Carter, Garzanti, Galy, Tabrez, Pringle, Campbell, France-Lanord, Blusztajn, Allen, Alizai, Lückge, Danish, Rabbani, Clift, Tada and Zheng2010).
KDE plots for the apatite fission track central ages of potential bedrock sources within the headwaters of the Indus Basin. Nanga Parbat data are from Warner (Reference Warner1993) and Zeitler (Reference Zeitler1985). Greater Himalaya data are from Kumar et al. (Reference Kumar, Lal, Jain and Sorkhabi1995), Jain et al. (Reference Jain, Kumar, Singh, Kumar and Lal2000) and Thiede et al. (Reference Thiede, Bookhagen, Arrowsmith, Sobel and Strecker2004). Lesser Himalaya data are from Thiede et al. (Reference Thiede, Bookhagen, Arrowsmith, Sobel and Strecker2004) and Vannay et al. (Reference Vannay, Grasemann, Rahn, Frank, Carter, Baudraz and Cosca2004). Karakoram data are from Foster et al. (Reference Foster, Gleadow and Mortimer1994), Zeitler (Reference Zeitler1985), Wallis et al. (Reference Wallis, Carter, Phillips, Parsons and Searle2016) and Poupeau et al. (Reference Poupeau, Pecher, Benharbit and Noyan1991). Kohistan data are from Zeitler (Reference Zeitler1985) and Zeilinger et al. (Reference Zeilinger, Burg, Schaltegger and Seward2001). Transhimalaya data are from Kirstein et al. (Reference Kirstein, Foeken, van der Beek, Stuart and Phillips2009, Reference Kirstein, Sinclair, Stuart and Dobson2006) and Clift et al. (Reference Clift, Carter, Krol, Kirby, Clift, Kroon, Gaedicke and Craig2002a). Tethyan Himalaya data are from Li et al. (Reference Li, Tian, Kohn, Sandiford, Xu and Cai2015) and A. Carter (unpub. data, UCL, 2017). Indian Peninsula data are from Gunnell et al. (Reference Gunnell, Gallagher, Carter, Widdowson and Hurford2003) and Kalaswad et al. (Reference Kalaswad, Roden, Miller and Morisawa1993).

Some information can also be derived about where the sediments may be coming from within the possible source ranges if we refer to the bedrock data that has been measured onshore, as summarized in Figure 5. Comparison of these sources and detrital data is only valid for the youngest sediments because young bedrock AFT ages do not inform us about the cooling of these sources in the older geologic past, only the cooling of the rocks now exposed. We note that the different ranges within the Indus Basin have a number of distinctive peaks and that some of these are distinct in terms of their AFT age spectra. We note that the Greater and Lesser Himalaya have relatively similar fission track ages, clustering around 3–4 Ma, but with some ranging to c. 1 Ma, at least in the Sutlej Valley (Thiede et al. Reference Thiede, Bookhagen, Arrowsmith, Sobel and Strecker2004), and that these also overlap with ages known from the Karakoram, especially the eastern Karakoram (Wallis et al. Reference Wallis, Carter, Phillips, Parsons and Searle2016) and the Yasil Dome lying in the Karakoram immediately north of the Nanga Parbat Massif (Poupeau et al. Reference Poupeau, Pecher, Benharbit and Noyan1991). The Karakoram, however, also has bedrock AFT ages that range to older values, suggestive of earlier exhumation in at least parts of that block, most notably in the west and their continuation into the Hindu Kush (Zhuang et al. Reference Zhuang, Najman, Tian, Carter, Gemignani, Wijbrans, Jan and Khan2018). The very youngest grains are measured around the Nanga Parbat Massif (Zeitler, Reference Zeitler1985), while the oldest are found in the Transhimalayan Ladakh Batholith (Kirstein et al. Reference Kirstein, Foeken, van der Beek, Stuart and Phillips2009) and Deosai Plateau (van der Beek et al. Reference van der Beek, Van Melle, Guillot, Pêcher, Reiners, Nicolescu and Latif2009). The Tethyan Himalaya has also yielded older AFT ages in the central Himalaya (Li et al. Reference Li, Tian, Kohn, Sandiford, Xu and Cai2015) but has not been dated within the Indus catchment. Uplift and erosion in the mountains around the Indus Suture and to the north of the Greater Himalaya is widely accepted to have initiated earlier and then mostly slowed as the exhumation shifted into the Greater and Lesser Himalayan ranges (Searle, Reference Searle, Yin and Harrison1996).
Although many of the measured fission tracks at Nanga Parbat have ages of less than 1 Ma (Zeitler et al. Reference Zeitler, Sutter, Williams, Zartman, Tahirkheli, Malinconico and Lillie1989), clearly this could not have been the case before 1 Ma, when the fastest cooled grains must have had ages within error of or older than 1 Ma. Lag times could, however, have been short prior to 1 Ma. Consequently, direct comparison of the modern bedrock with the detrital ages in old sediments is not appropriate for most of our samples. Because the cooling rates of bedrock sources change on timescale of >106 yr, source lag times need not have been constant in the geologic past. Different, higher temperature thermochronometers can constrain exhumation rates during those earlier times and provide clues about lag times. We can, however, deduce that because many of the grains’ AFT ages are relatively young (<15 Ma) and their lag times are short, they were probably derived from fast-exhuming sources in the Himalaya, Nanga Parbat or Karakoram (Zeitler et al. Reference Zeitler, Chamberlain and Smith1993; Zhuang et al. Reference Zhuang, Najman, Tian, Carter, Gemignani, Wijbrans, Jan and Khan2018), rather than in Kohistan, the Transhimalaya or Tethyan Himalaya where uplift and exhumation were mostly older. The cooling histories of these latter sources imply that their AFT lag times would be mostly long during Late Miocene–Present times (Fig. 5) (Krol et al. Reference Krol, Zeitler and Copeland1996; Searle, Reference Searle, Yin and Harrison1996; Kirstein et al. Reference Kirstein, Foeken, van der Beek, Stuart and Phillips2009). Although some young AFT ages <6.3 Ma have been recorded in the Ladakh Transhimalayan Batholith along the Shyok Suture (Kirstein et al. Reference Kirstein, Foeken, van der Beek, Stuart and Phillips2009), these represent quite a small part of that tectonic block. Zircon U–Pb ages from the same IODP sites imply that the Transhimalaya has not been a dominant source during the period targeted by this study (maximum of 28 % at 15.5 Ma, and this is likely a large overestimate because the Karakoram and Transhimlaya overlap in zircon U–Pb ages) (Clift et al. Reference Clift, Zhou, Stockli and Blusztajn2019b).
The prevalence of short AFT lag times implies rapid exhumation in the dominant sediment-producing sources close to the time of sedimentation. The AFT data require that little sediment was stored for significant periods of geologic time between erosion in the mountain sources and sedimentation on the Indus submarine fan because the difference/lag between minimum ages and deposition is typically <4 Myr (75 % of samples), representing an upper limit to the storage time. The lag time of a grain largely represents the time between cooling and erosion. While the lag time also includes time spent during sediment transport, study of the Quaternary Indus system indicates transport times of no more than ∼105 yr for the bulk of the sediment delivered to the deep basin (Clift & Giosan, Reference Clift and Giosan2014). Some of the sediment may be recycled from foreland basin sedimentary rocks of the Siwalik Group, and this would introduce an additional lag into the sediment transport history. Secondary AFT age populations between 15 and 38 Ma (Table 2) would fit with this type of recycling. We can discount that these older ages are coming from direct erosion of the slower cooled Ladakh Batholith or Tethyan Himalaya because heavy mineral studies (Garzanti et al. Reference Garzanti, Vezzoli, Ando, Paparella and Clift2005), trace-element characteristics of detrital amphiboles (Lee et al. Reference Lee, Clift, Layne, Blum and Khan2003) and zircon U–Pb ages (Alizai et al. Reference Alizai, Carter, Clift, VanLaningham, Williams and Kumar2011) from the trunk Indus River close to the Himalayan front show dominance by the Karakoram (especially the Southern Karakoram Metamorphic Belt) over other sources in the modern upstream basin. That the AFT ages in Siwalik Group sedimentary rocks themselves have not been entirely reset during burial is known from studies in central Nepal (van der Beek et al. Reference van der Beek, Robert, Mugnier, Bernet, Huyghe and Labrin2006), and these ranges could thus be a source of the older AFT ages measured. Quantifying the amount of recycling out of the Siwalik Ranges is impossible for our data, because older grains could come from slow cooling sources or the Siwalik Group. However, the high abundance of short lag time grains suggests that the degree of this recycling cannot be too large. Rates of incision in modern gorges cutting the Siwalik Group in Nepal have been used to estimate that they account for no more than 15 % of the total flux (Laveé & Avouac, Reference Lavé and Avouac2001), while an isotope-based mass balance for the Ganges basin indicates <10 % of the mass flux in that drainage is from the Siwalik Group (Wasson, Reference Wasson2003). A contribution of that order to the Indus Basin would be consistent with the AFT data presented here. The AFT data by themselves cannot resolve erosion from the Siwaliks, as they share older AFT ages with sources in the Tethyan Himalaya, Kohistan and Transhimalaya.
On shorter timescales if sediment was being buffered on the floodplains, in the delta or on the continental shelf, then this is expected to have occurred only for a short amount of time, essentially tens of thousands of years (Li et al. Reference Li, Clift and O’Sullivan2019). Storage and recycling on million-year timescales would have resulted in longer lag times. When the lag times of our samples are 3–4 Myr some of this time must have been spent during transport. With the exception of the storage and recycling via Siwalik Group foreland sequences discussed above, the assumption is that most of this time would have been spent undergoing rock uplift prior to exposure and erosion, because estimates of transport time in the Quaternary Indus are just 105 yr for the bulk of the sediment delivered to the deep basin (Clift & Giosan, Reference Clift and Giosan2014). Modern bedrock AFT data from the Greater and Lesser Himalaya and Karakoram indicate this order of lag time at the present day (Fig. 5), without factoring in much additional transport time. Our data are broadly consistent with the idea of rapidly uplifting mountains being strongly eroded and so supplying most of the sediment into the Indus River during the period of study since 15.5 Ma.
Combined Nd isotope and detrital zircon U–Pb age data from bulk sediment samples from sites U1456 and U1457 show that there was a change in provenance starting at c. 5.7 Ma (Clift et al. Reference Clift, Zhou, Stockli and Blusztajn2019b). This analysis indicates more material coming from the Greater and Lesser Himalaya and relatively less from the Karakoram after this time. The range of lag times in sediments younger than 7.0 Ma is similar to that found in the Indus delta during the phase of strong summer monsoon in early Holocene time, i.e. 2–5 Myr (Fig. 6), when the provenance constraints indicate that these sediments were preferentially derived from Greater and Lesser Himalayan sources (Clift et al. Reference Clift, Zhou, Stockli and Blusztajn2019b). In contrast, sediments older than 7.0 Ma have longer lag times (3.5–8.8 Myr, average 6.0 Myr) and are inferred to be more derived from the Karakoram, based on their zircon U–Pb age spectra (Fig. 6) (Clift et al. Reference Clift, Zhou, Stockli and Blusztajn2019b). The fact that lag times of pre-7.0 Ma samples are longer, such as Indus delta Last Glacial Maximum (LGM) sediments that have an AFT central age of 9 ± 1 Ma (Clift et al. Reference Clift, Giosan, Carter, Garzanti, Galy, Tabrez, Pringle, Campbell, France-Lanord, Blusztajn, Allen, Alizai, Lückge, Danish, Rabbani, Clift, Tada and Zheng2010), is consistent with a dominant Karakoram source.
Lag time plot of detrital apatite fission track minimum ages showing the lag time between the cooling and depositional ages. Note the minimum lag time achieved between 9 and 6 Ma. Siwalik data from Nepal are from van der Beek et al. (Reference van der Beek, Robert, Mugnier, Bernet, Huyghe and Labrin2006); Bengal Fan data are from Corrigan & Crowley (Reference Corrigan, Crowley, Cochran and Stow1990). Monsoon records of G. bulloides are from Huang et al. (Reference Huang, Clemens, Liu, Wang and Prell2007); foreland basin δ14C record is from Quade et al. (Reference Quade, Cerling and Bowman1989). Sediment budget for the Indus Fan is from Clift (Reference Clift2006). Evolution in the age spectra of zircon U–Pb ages and ϵNd values are from Clift et al. (Reference Clift, Zhou, Stockli and Blusztajn2019b). Stippled area shows the time of the climatic transition to drier conditions in the foreland basin.

That the Nd isotope provenance data change at around the same time as the AFT lag times (after 5.7 Ma; Fig. 6) supports the idea that a change in provenance may account for at least part of the changing AFT lag times at that time. The absence of the very short lag time samples does mean that after 5.7 Ma there are no longer any significant fast-eroding ranges in the catchment. As noted above, the Crystalline Inner Lesser Himalaya is known to be experiencing unroofing after ∼6 Ma, at least in the vicinity of the Beas River catchment (Najman et al. Reference Najman, Bickle, Garzanti, Pringle, Barfod, Brozovic, Burbank and Ando2009), and the shift in the general character of the AFT age populations after 5.7 Ma may in large part simply reflect more sediment delivery from the Greater and Lesser Himalaya, potentially related to tectonic imbrication and rock uplift (Bollinger et al. Reference Bollinger, Avouac, Beyssac, Catlos, Harrison, Grove, Goffe and Sapkota2004; Huyghe et al. Reference Huyghe, Galy, Mugnier and France-Lanord2001; Webb, Reference Webb2013). Such a shift is consistent with the evolving provenance data in the Laxmi Basin (Clift et al. Reference Clift, Zhou, Stockli and Blusztajn2019b). The structural reconstructions of Webb (Reference Webb2013) for the western Himalaya propose that both the Greater and Lesser Himalaya remained buried under the Tethyan Himalaya until after 5.4 Ma. This would imply that the source of rapidly cooled grains before that time would be from the Karakoram and Tethyan Himalaya.
The AFT ages can be used to constrain changing rates of exhumation in the bedrock sources. Comparing depositional age against the AFT minimum age populations allows us to assess the lag time between cooling of bedrock sources as they passed through the 60–110 °C PAZ and their final deposition in the deep water of the Indian Ocean (Fig. 6). In our analysis we further compare our results with those similar-aged fluvial sedimentary rocks from the Siwalik Group in western and central Nepal (van der Beek et al. Reference van der Beek, Robert, Mugnier, Bernet, Huyghe and Labrin2006), as well as from the Bengal Fan collected by ODP Leg 116 (Corrigan & Crowley, Reference Corrigan, Crowley, Cochran and Stow1990). It is clear that many of these minimum age groups have relatively short lag times, which indicates fast cooling and exhumation of bedrock sources. We note that both the oldest (15.5 Ma) sample from the Laxmi Basin and a slightly younger sample from the Bengal Fan show lag times close to 4 Myr in Middle Miocene time. This would imply exhumation rates of 1.1–1.4 km Myr−1 assuming 25–35 °C km−1 geothermal gradients.
Unfortunately, we have little information between that time and ∼8.5 Ma when the next youngest dateable sandy sediment was deposited and preserved at the drilling sites. Although one of the minimum age groups still lags by ∼4.2 Myr, we note that there is some scatter to longer lag times of up to 8.8 Myr between 8.5 and 7.0 Ma and with large uncertainties. Combined zircon U–Pb (40–70 and 70–120 Ma grains) and bulk sediment Nd isotope (ϵNd values > −10) provenance data indicate that much of the sediment at that time was derived from the Karakoram (Clift et al. Reference Clift, Zhou, Stockli and Blusztajn2019b). The zircon U–Pb budget over-represents the net flux from the Himalaya because these bedrocks are >2.2 times more fertile with regard to zircon than the Karakoram and Transhimalaya.
After 7.0 Ma, lag times shortened significantly. Three samples from the Laxmi Basin drilling sites are within error of the depositional age between 7.0 and 5.7 Ma, requiring exhumation rates that were so rapid that we are unable to constrain the duration between cooling through the PAZ (60–110 °C) and sedimentation, i.e. lag times close to zero. This implies a maximum rate of cooling in the sources at that time. All three of the fast-cooling samples have accompanying zircon U–Pb ages that show that they continue a trend towards more Himalayan erosion but that there is not a sharp contrast with the sediment deposited before 7.0 Ma. After 5.7 Ma, the change in Nd isotopes is especially marked and implies that a change in provenance may be responsible for the slowing of exhumation rates. Nonetheless, one sample, U1457C-43R-1 55–63 cm, deposited at 5.87 Ma, has a minimum age lag time of 3.13 Myr, longer than the others. This implies that not all sources were supplying large volumes of sediment at all times and that not all bedrock sources were exhuming so quickly.
Although provenance data indicate mostly Karakoram sources, these rapidly cooled grains could also be derived from the Himalayan tectonic units. Zircon U–Pb ages allow us to discriminate between erosion of Karakoram (40–120 Ma) and Himalayan (>300 Ma) sources, the largest sources at that time. However, the zircon ages only apply to these minerals and the provenance cannot be transferred to the apatites. Therefore, we only know that there were rapidly cooling areas between 7.0 and 5.7 Ma, but not which range they are located in. However, because there are large numbers of grains in the minimum age group, it might reasonably be expected that these are derived from bedrock sources that also supply large volumes of other mineral types. Between 7.0 and 5.7 Ma the longest lag time was 3.13 Myr in the sediment deposited at 5.87 Ma. This indicates an average cooling rate of at least 35.1 ± 9.7 °C Myr−1, faster than the cooling rates of 12.5 to 26.1 °C Myr−1 between 8.2 and 7.0 Ma. These are faster rates than those recorded in the Siwalik Group from Nepal (van der Beek et al. Reference van der Beek, Robert, Mugnier, Bernet, Huyghe and Labrin2006), as well as sparse data from the Bengal Fan (Corrigan & Crowley, Reference Corrigan, Crowley, Cochran and Stow1990), although they are within the uncertainties of the peak rates in Nepal at that time. However, in Nepal the sources must have been Himalayan, not Karakoram. In the youngest part of the section (<4 Ma), which is more dominated by Himalaya erosion (Clift et al. Reference Clift, Zhou, Stockli and Blusztajn2019b), these very short lag times are not visible and are always more than 1.93 Myr, equivalent to approximate exhumation rates of ∼2.3–1.6 km Myr−1. The moderate exhumation rates after 4 Ma compare with data from both the Bengal Fan and from the Nepalese part of the Himalayan foreland. Both these sediment sequences are dominated by Himalayan erosion (Bouquillon et al. Reference Bouquillon, France-Lanord, Michard, Tiercelin, Cochran, Stow and Auroux1990). Slowing of exhumation in the Indus Basin after 5.7 Ma is consistent with data from western Nepal (Karnali), but the slowing from peak rates at 7.0 to 5.7 Ma is in contrast to conclusions of work from central Nepal (Surai and Tinau Khola) that argued for relatively steady-state cooling in that part of the mountain range (van der Beek et al. Reference van der Beek, Robert, Mugnier, Bernet, Huyghe and Labrin2006). The very youngest sample deposited at 930 ka stands out as having by far the largest lag time and is inferred to have a unique source, likely a mixture of sediment from the Indus River and Peninsular India.
We can compare this pattern of accelerating exhumation before 7.0 Ma and then slowing after 5.7 Ma with the climatic history (Fig. 6), while recognizing the shift in provenance that is occurring at the same time. One of the most popular long-term proxies for monsoon intensity in the Arabian Sea is the relative abundance of Globigerina bulloides offshore the margin of Arabia. The abundance of G. bulloides is largely a function of the availability of nutrients derived from upwelling caused by the summer monsoon rains (Curry et al. Reference Curry, Ostermann, Guptha, Itekkot, Summerhayes, Prell and Emeis1992). There is little evidence for such strong upwelling prior to c. 13 Ma (Betzler et al. Reference Betzler, Eberli, Kroon, Wright, Swart, Nath, Alvarez-Zarikian, Alonso-García, Bialik, Blättler, Guo, Haffen, Horozai, Inoue, Jovane, Lanci, Laya, Mee, Lüdmann, Nakakuni, Niino, Petruny, Pratiwi, Reijmer, Reolid, Slagle, Sloss, Su, Yao and Young2016). A general intensification of upwelling is noted after 5.3 and 3.0 Ma (Gupta et al. Reference Gupta, Yuvaraja, Prakasam, Clemens and Velu2015; Huang et al. Reference Huang, Clemens, Liu, Wang and Prell2007) (Fig. 6). However, upwelling is not a direct proxy of rainfall, and this apparent intensification does not reflect the delivery of summer rains to the mountain front, because this proxy does not correlate with other climatically sensitive indicators (Clift, Reference Clift2017).
Stable oxygen isotope data from the foreland basin instead agree with chemical weathering data from the South China and Arabian Seas in arguing for relatively wet conditions in Middle Miocene time between 10 and 12 Ma (Dettman et al. Reference Dettman, Kohn, Quade, Ryerson, Ojha and Hamidullah2001) followed by a decrease in humidity, particularly after c. 6–8 Ma (Clift, Reference Clift2017; Singh et al. Reference Singh, Parkash, Awasthi and Kumar2011). Moisture delivery to this area from the winter Westerlies is also reconstructed to reduce c. 7 Ma (Vögeli et al. Reference Vögeli, Najman, Beek, Huyghe, Wynn, Govin, Veen and Sachse2017). The increasing lag time seen in the minimum age populations after 5.7 Ma would be consistent with slower erosion and could be linked to weaker monsoon rainfall. Weaker monsoon and Westerly rains would also reduce discharge and potentially slow the transport of sediment across the flood plains. Increased aridity is consistent with decreasing strength of chemical weathering seen in Indus Marine A-1 located on the Indus shelf (Clift et al. Reference Clift, Hodges, Heslop, Hannigan, Hoang and Calves2008), as well as Site U1456 (Clift et al. Reference Clift, Kulhanek, Zhou, Bowen, Vincent, Lyle and Hahn2019a), but largely postdates the carbon isotope transition from 8 to 6 Ma in the foreland basin (Quade et al. Reference Quade, Cerling and Bowman1989).
The acceleration in exhumation rates from 7.8 to 7.0 Ma generally coincides with the climatic drying, which may seem counterintuitive. However, this also assumes that stronger rains, sometimes modulated through glaciation, always increase erosion. There is evidence that drier conditions, especially when this involves heightened seasonality, can increase erosion provided the drying is not too extreme but sufficient to reduce vegetation cover that reduces soil erosion (Giosan et al. Reference Giosan, Ponton, Usman, Blusztajn, Fuller, Galy, Haghipour, Johnson, McIntyre, Wacker and Eglinton2017). There is no evidence that the period of fast erosion at 5.7–7.0 Ma was caused by faster India and Asia convergence. Indeed, convergence rates appear to have slowed gradually during the Cenozoic period (Clark, Reference Clark2012).
6. Conclusions
Apatite fission track ages derived from turbidite sediments from IODP sites U1456 and U1457 in the Laxmi Basin, eastern Arabian Sea, provide an opportunity to reconstruct changing exhumation rates in the western Himalaya and Karakoram since 15.5 Ma, and especially since 9 Ma. AFT ages are mostly <50 Ma and demonstrate that the sediment is derived from the Indus River, not Peninsular India, except in the case of the youngest sample, deposited at 0.93 Ma. Moreover, most samples show minimum age populations that are only slightly older than the depositional age, implying fast rates of exhumation in the sources and rapid transport through this time. Lag times of ∼4 Myr in Middle Miocene time imply exhumation rates of 1.1–1.4 km Myr−1. After a period of longer lag times (∼6 Myr) between 8.5 and 7.8 Ma, these reach a minimum from 7.0 to 5.7 Ma, when lag times were within error of zero. Provenance U–Pb zircon and Nd isotope data indicate erosion dominantly in the Karakoram, but the AFT ages could have also come from Himalayan sources, which were also important contributors at this time. The AFT data alone do not allow us to discriminate which of the two ranges contained the fast-exhuming sources. After 5.7 Ma, lag times lengthened to ∼4.5 Ma, and exhumation rates slowed to 2.3–1.6 km Myr−1 at the same time that sediment supply came progressively more from the Himalaya and relatively less from the Karakoram.
The time of peak exhumation correlates with the transition to a drier climate in the foreland basin and of a weakening Westerly Jet. Erosion rates since 5.7 Ma are comparable or slightly faster than those seen in the Nepalese parts of the Himalaya and the Bengal Fan. Slowing exhumation rates after 5.7 Ma correlate with a drying climate and weaker summer monsoon rains in Late Miocene time. There is a general shift in the AFT age populations from longer lag times, more similar to the glacial era Indus River and associated with dominant erosion in the Karakoram prior to 7 Ma, to shorter lag times and more erosion of the Himalaya, similar to the Holocene Indus River after 5.7 Ma. The acceleration of exhumation as the climate dried between 7.8 and 7.0 Ma seems to imply a dominant tectonic control of erosion. The AFT data support models that imply a non-linear relationship between summer monsoon rain strength and the erosion of the western Himalaya.
Supplementary material
To view supplementary material for this article, please visit https://doi.org/10.1017/S001675681900092X
Acknowledgements
This research used samples and/or data provided by the International Ocean Discovery Program (IODP). Funding for this research was provided by USSSP and the Charles T. McCord Jr Chair in Petroleum Geology at LSU. We thank GeoSep Services and especially Paul O’Sullivan for separation of our apatite grains. The paper was improved by reviews from Peter van der Beek and an anonymous reviewer.