Introduction
Multiple natural mortality factors regulate insect population dynamics in agroecosystems. Among these factors, the most important are natural enemies, climatic elements, and host plants. Studying the spatial distribution, timing, and the magnitude of these mortality factors is essential to understand the population dynamics of a species. It is also important to predict pest outbreaks and to develop better pest management strategies in order to use and improve the natural mortality factors (Naranjo & Ellsworth, Reference Naranjo and Ellsworth2005).
Each one of these factors acts differently on the insect. Some act directly and others indirectly by interfering with the insect and their relationship with host plants and natural enemies. Natural enemies such as predators, parasitoids, and entomopathogens are very important in pest population regulation in agroecosystems, and they can cause mortality in different ways. Predators kill their prey immediately on contact, and for this reason, their action is not overlapped by other natural enemies. On the other hand, the action of parasitoids and entomopathogens is overlapped by the action of predators because they cause pest mortality sometime after contact (Hajek, Reference Hajek2004; Semeão et al., Reference Semeão, Martins, Picanço, Bruckner, Bacci and Rosado2012).
Among predators, predatory bugs, thrips, and Vespidae are the most common natural enemies of the pest. Parasitoids include egg parasitoids (Hymenoptera: Trichogrammatidae), larval parasitoids (families Hymenoptera: Braconidae and Diptera: Tachinidae), and a pupal parasitoid (Copidosoma sp. Hymenoptera: Encyrtidae) (Burleigh, Reference Burleigh1972; Daigle et al., Reference Daigle, Boethel and Fuxa1990). A complex of fungi are reported as entomopathogens of Chrysodeixis includens. An example is the fungus Nomuraea rileyi, which is highly affected by chemical control (Sosa-Gómez et al., Reference Sosa-Gómez, Delpin, Moscardi and Nozaki2003; Spechta et al., Reference Spechta, Paula-Moraes and Sosa-Gómez2015).
Climatic elements, in turn, can affect the pest population dynamics directly or indirectly mainly through air temperature, rainfall, and photoperiod. Directly, temperature and photoperiod affect the development and reproduction of insects (Mellanby, Reference Mellanby1939; Régnière et al., Reference Régnière, Powell, Bentz and Nealis2012), and rainfall causes mortality by mechanical impact of rain drops. The indirect action of climate occurs because of its influence on natural enemy survivorship and establishment (Norris et al., Reference Norris, Memmott and Lovell2002), and because of its effect on host plant quality.
Host plant characteristics such as morphology, nutritional status, and allelochemicals can cause pest mortality as well. These factors may cause egg viability reduction and affect physiological processes during molting, which can lead to insect mortality (Awmack & Leather, Reference Awmack and Leather2002).
Ecological life tables are an important research tool for studying population regulation and have provided important insights into the dynamics and regulation of insect populations in agroecosystems (Carey, Reference Carey1989). This is a robust method of description and quantification of natural mortality factors throughout the insect life cycle due to variations in its natural environment (Harcourt, Reference Harcourt1969; Naranjo & Ellsworth, Reference Naranjo and Ellsworth2005). Ecological life tables also describe the critical stage and key mortality factors of the insect. The critical mortality stage determines the size of the pest population and the key mortality factor has greater relative importance during the critical stage, that is, the factor that is the most responsible for the changes in a population density in successive generations (Varley & Gradwell, Reference Varley and Gradwell1960; Morris, Reference Morris1963; Harcourt, Reference Harcourt1969; Podoler & Rogers, Reference Podoler and Rogers1975).
Soybean looper, C. includens (Walker) (Lepidoptera: Noctuidae), is an important agricultural pest that occurs in the Western Hemisphere from the northern United States (US) to southern South America (Eichlin & Cunningham, Reference Eichlin and Cunningham1978; Alford & Hammond Junior, Reference Alford and Hammond Junior1982). This species is polyphagous and feeds on 73 plant species belonging to 29 different families (CAB International, 2016). Its losses are caused through the larvae feeding on the leaves, especially between the veins, displaying a lacy appearance, which is the pest's fingerprint (Bueno et al., Reference Bueno, Bueno, Moscardi, Parra and Hoffmann-Campo2011). C hrysodeixis includens is an important pest of crops such as soybeans, beans, cotton, sunflower, tomato, and potato (Eichlin & Cunningham, Reference Eichlin and Cunningham1978).
In the US, C. includens is reported as a key soybean pest in several regions (Kogan & Turnpseed, Reference Kogan and Turnpseed1987). In Brazil, only in recent years has this pest become a serious problem when population outbreaks were recorded in different crops (Baldin et al., Reference Baldin, Lourenção and Schlick-Souza2014; Bortolotto et al., Reference Bortolotto, Pomari-Fernandes, Bueno, Bueno, Kruz, Queiroz, Sanzovo and Ferreira2015). Despite the importance of C. includens as a pest of different crops, the stages and factors that regulate its infestation intensity are unknown. This information is very important for the establishment of integrated pest management programs on a sustainable basis. Therefore, our objectives were to determine the natural mortality factors, stages, and key factors that regulate C. includens populations.
Materials and methods
Experimental conditions
This study was conducted on dry bean (Phaseolus vulgaris L.) cultivar Madrepérola in the experimental area of the Universidade Federal de Viçosa, Viçosa, Minas Gerais State, Brazil (20°48′45″S, 42°56′15″W, 600 m a.s.l., tropical climate) in 2014 and 2015. During those 2 years, seven experiments were conducted in the same experimental field. The experiments were conducted in different periods and the crops were planted on 1-14-2014, 4-14-2014, 9-8-2014, 12-3-2014, 2-23-2015, 6-2-2015, and 9-22-2015. These dates were selected in order to enable the study of C. includens mortality factors throughout the year. The experiments were conducted in an area of 3250 m2 (65 × 50 m), with plants 10 cm apart in rows 50 cm apart. The fields were grown as recommended by EMBRAPA (2005) and pesticides were not used.
Chrysodeixis includens colony
Individuals of C. includens used in the experiments were obtained from a laboratory colony which was reared at 25 ± 0.5°C, 70 ± 5% relative humidity, and photoperiod 12:12 (light:dark). For colony establishment, we collected C. includens larvae in commercial dry bean fields in Viçosa. The collected larvae were taken to the laboratory where they were reared until pupation in dry bean leaves. These pupae were used to start the colony. In the colony, we used three cages (45 × 45 × 45 cm). The first cage was used for oviposition, the second for egg incubation, and the third for larvae feeding.
The pupae from individuals collected in the field were transferred to the oviposition cage. When the adults emerged, a 30-day-old potted dry bean plant (3 l) was placed inside the cages for oviposition. Honey was provided on a piece of white cloth (9 × 3 cm) for adult feeding. The moths were allowed to oviposit for 2 days, and after this period, the plant was transferred to the egg incubation cage. A new plant was placed inside the adult cage until the death of all adults.
The bean plant with eggs remained in the egg incubation cage until larvae hatching (about 3 days). After this period, this plant was transferred to the larvae-feeding cage. The larvae-feeding cage was monitored daily. When the larvae defoliated the entire plant, a new dry bean plant was placed into the cage. The larvae remained in the feeding cage until pupation. The pupae were then transferred to the oviposition cage.
Determination of mortality factors
The experimental design was completely randomized with ten experimental plots (replication). Each plot consisted of ten bean plants 30 days after planting in the field. The plots were isolated from each other by 1 m in all directions. The isolation area had no plants, and it was used to prevent larval migration between plots. For the assessment of C. includens mortality factors, we have established cohorts in the field containing eggs, larvae, and pupae.
Evaluation of egg mortality factors
Around each set of ten plants (plot) in the field, we built a wood and organza fabric cage (100 × 50 × 50 cm). Within this structure, we released 20 3-day-old unsexed adults for oviposition. After 24 h, the adults and the cage around the plants were removed. Chrysodeixis includens lays its eggs singly and mostly on the bottom side of the leaves. Thus, for each plot, the eggs were recorded, and about 50 eggs were preserved per plot. In this way, we started the egg cohort in the field. The end of the incubation period of eggs was determined when the first larvae hatched.
During the incubation period, we evaluated the number of eggs and their mortality causes in the field (e.g. predator, parasitoids, and abiotic factors such as rainfall). The evaluations were performed three times a day, (i) in the beginning of the morning, (ii) after noon, and (iii) at night. To identify mortality caused by rainfall – removing eggs from the leaves due to the mechanical impact of the raindrops – additional evaluations were performed in rainy days. These evaluations were performed right after the rainfall ceased. Therefore, eggs that disappeared between two subsequent evaluations in the absence of rain, or only had the corium present were considered dead by predation (Jervis, Reference Jervis2007; Pereira et al., Reference Pereira, Picanço, Bacci, Della Lucia, Silva and Fernandes2007a, Reference Pereira, Picanço, Bacci and Guedesb).
Each egg that had not hatched after the field evaluation period was placed in a glass tube (10 cm long × 2 cm diameter). The tubes were sealed with cotton, transported to the laboratory, and monitored daily. In the tubes that egg parasitoids emerged, we recorded the parasitism and identified the parasitoid to family level. The eggs that were not parasitized and did not hatch were considered dead by inviability.
The hatched larvae were transferred to plastic containers (120 ml) with dry bean leaves. These insects were reared until the emergence of adults for evaluation of Copidosoma sp., an egg-pupae parasitoid. We evaluated the numbers of parasitized pupae and C. includens emerged adults.
Evaluation of larval mortality factors
For C. includens larval cohort establishment, a group of individuals of the same species and age, we transferred 200 larvae of newly hatched first instar for each field plot. We evaluated the instar and the mortality numbers and causes twice a day, early in the morning and in the end of the afternoon.
Evaluations of larval mortality by predation and rainfall were performed similarly to evaluations of these factors at the egg stage. Larvae that died attached to their exuviae were assigned as ‘physiological disturbance during molting mortality’ (Pereira et al., Reference Pereira, Picanço, Bacci, Della Lucia, Silva and Fernandes2007a, Reference Pereira, Picanço, Bacci and Guedesb).
To evaluate parasitism, at the end of the larval stage, the remaining larvae were removed from the plants and transported to the laboratory. In the laboratory, the larvae were placed in plastic containers (120 ml) with dry bean leaves for feeding, and they were reared until the pupae stage. We evaluated the number of larvae that died by physiological disturbance during molting, and the number of normal pupae and the parasitoids that emerged from the larvae.
Evaluation of pupal mortality factors
For C. includens pupae cohort establishment, we transferred 15 larvae at the end of the fifth instar for each plot to allow pupation on the plants in the field. At this stage, we evaluated the mortality numbers and causes. Pupal mortality by predation and rainfall were performed similarly to evaluations of these factors in the egg stage.
Near to the end of the pupal stage, the leaves of plants containing the remaining pupae were removed and transported to the laboratory. In the laboratory, they were placed in cages and monitored until adult emergence. We evaluated the number of pupae that died by physiological disturbance during molting, and the number of adults and the parasitoids that emerged from the pupae.
Natural enemies identification
Natural enemy evaluations were recorded during all stages. We collected natural enemies from other plants of the crop and took them to the laboratory. In the laboratory, they were killed, assembled, and separated into morphospecies for further specialists identification.
Life table construction and analysis
The life table was constructed using the classical models presented by Varley et al. (Reference Varley, Gradwell and Hassell1973) and Southwood & Henderson (Reference Southwood and Henderson2000). They were composed of the following variables: life cycle stage (x), mortality factor, L x (number of living insects at the beginning of each stage), d x (number of dead insects in each stage), 100qx (apparent mortality rate), 100rx (real mortality rate), MM (marginal mortality rate), and k (partial mortality). These variables were calculated using the following equations:
 $$L_{x + 1} = L_x - d_x $$
where L x and L x+1 are the numbers of living insects at the beginning of each stage (x) and in the beginning of the next stage (x + 1); x = 0, 1, 2, 3, 4, 5, and 6 correspond to the egg, first, second, third, fourth, fifth instars, and pupa.
 $$100rx = 100.\; \left( {\displaystyle{{dx} \over {L_0}}} \right)$$
 $$100qx = 100.\; \left( {\displaystyle{{dx} \over {L_x}}} \right)$$
Real mortality rate is the percentage of mortality with respect to the number of insects that started their life cycle (i.e. the initial number of eggs). This mortality parameter determines the factors that caused more or less absolute mortality to the insect. However, the magnitude of the real mortality occurring in the last stages of the insect's life cycle is highly influenced by mortality occurred in the early stages. To remove this influence in later stages, we calculated apparent mortality rate (Southwood, Reference Southwood1978).
Another difficulty in the life table construction is that, in the field, the mortality factors act simultaneously. So, one mortality factor can obscure the performance of another. To prevent the action of a factor to obscure another action, we use MM (Elkinton et al., Reference Elkinton, Buonaccorsi, Bellows and Van Driesche1992). The MM estimates the mortality of a factor as if it were the only one. These estimates are based on the concepts proposed by Royama (Reference Royama1981) and adapted by Elkinton et al. (Reference Elkinton, Buonaccorsi, Bellows and Van Driesche1992).
 $$MM_{\rm f} {\rm = \;} 100qx_{\rm f} {\rm /(1} - To_{\rm f} )$$
 $$To_{\rm f} {\rm \; = \;} \mathop \sum \nolimits^ 100qxo/100$$
where MM f is the MM caused by factor f; f is a factor of mortality (predation, parasitism, rainfall, or egg inviability); To f is the factor obscuration rate. For rainfall, To = 0 since its action is not obscured by any other factor. Predation is obscured by rainfall. Parasitism is obscured by the action of rainfall and predation. Eggs inviability is obscured by the action of rainfall, predation, and parasitism (Semeão et al., Reference Semeão, Martins, Picanço, Bruckner, Bacci and Rosado2012).
For critical stages and key factors of mortality determination, partial (k) and total mortalities (K) were calculated using equations (6) and (7) (Southwood & Henderson, Reference Southwood and Henderson2000).
 $$k = - {\rm log}10\left( {1 - \left( {\displaystyle{{MM_{\rm f}} \over {100}}} \right)} \right)$$
 $$K = \mathop \sum \nolimits {(k)}$$
Correlation and linear regression analysis were conducted between partial and total mortality. Critical stages or mortality key factors were those in which the partial mortalities showed significant correlations with total mortality by t test at P < 0.05. When more than one mortality stage or factor correlated significantly, we performed linear regression analysis between partial and total mortalities at P < 0.05. The critical stage or key factor of mortality was the one whose regression line showed the greatest slope to P < 0.05. The difference between the slopes was verified by comparing their confidence intervals to 95% probability (Podoler & Rogers, Reference Podoler and Rogers1975; Royama, Reference Royama1996; Pereira et al., Reference Pereira, Picanço, Bacci, Della Lucia, Silva and Fernandes2007a, Reference Pereira, Picanço, Bacci and Guedesb).
Indispensable mortality is the mortality that would not occur if a mortality factor was eliminated (Southwood & Henderson, Reference Southwood and Henderson2000) and was calculated according to Naranjo & Ellsworth (Reference Naranjo and Ellsworth2005):
 $${MI_{\rm i} = \left\{{\left[ {1 - \prod\limits_{\rm i}^j {(1 - MMf/100)}} \right] - \left[ {1 - \prod\limits_{\rm i}^{\,j - 1} {(1 - MMf/100)}} \right]} \right\}.100}$$
Results
Natural mortality factors of C. includens
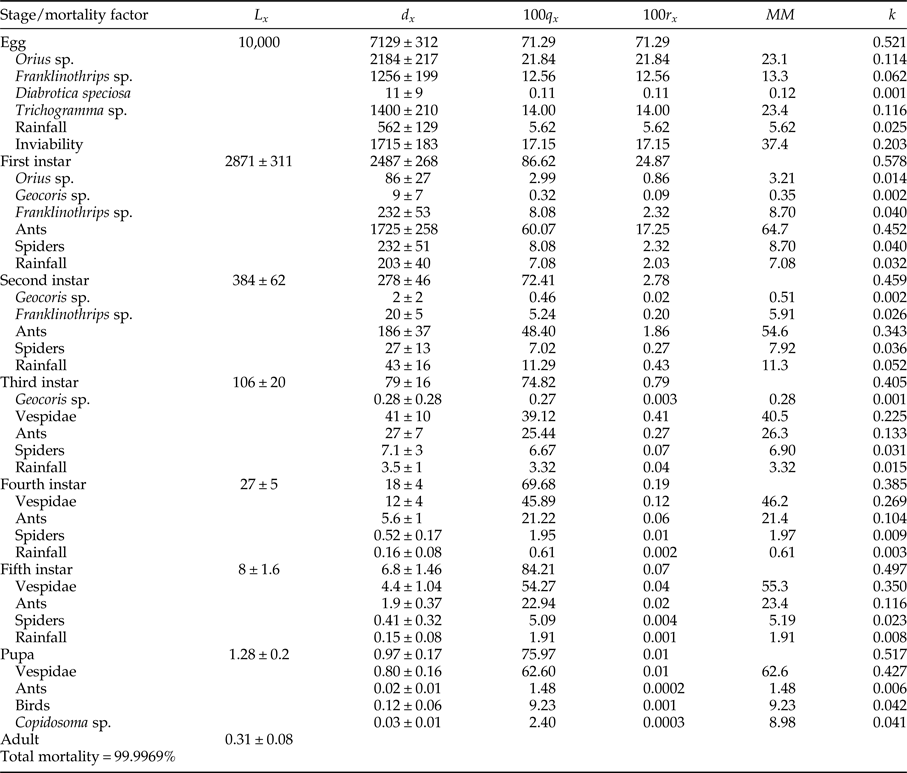
The average total mortality of immature stages of C. includens was 99.99%. The mortalities for each stage were: 71.29, 24.87, 2.78, 0.79, 0.19, 0.06, and 0.0097% for the egg, first, second, third, fourth, fifth instars, and pupa, respectively. Thus, for every one million eggs of C. includens that initiated its life cycle, approximately 31 reached its adulthood (table 1).
Ecological life table of Chrysodeixis includens on dry beans.
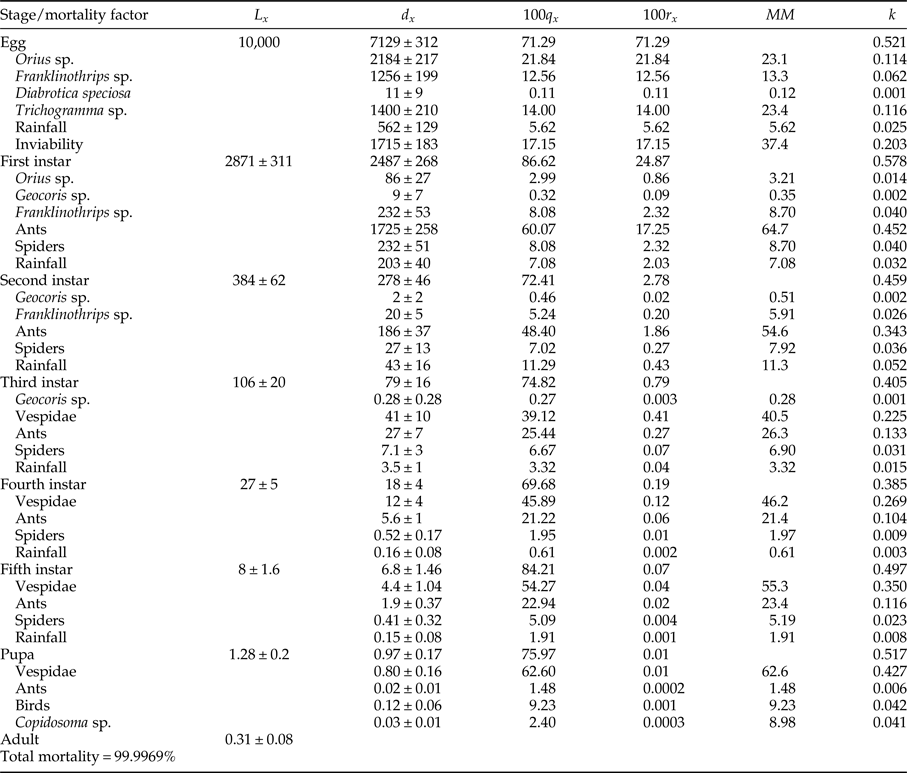
L x is the number of insects alive (±SE) at the beginning of each stage, d x is the number of insects killed (±SE) in a stage or killed by a factor in a stage, 100q x is the apparent mortality (%), 100r x is the real mortality (%), MM is the marginal mortality (%) and k is the partial mortality = log (MM). This life table represents the mean of 70 cohorts.
Mortality of C. includens was caused by multiple biotic and abiotic factors. Egg mortality was caused by predation, parasitism, rainfall, and inviability. The predators were Orius sp. (Hemiptera: Anthocoridae), Franklinothrips sp. (Thysanoptera: Aeolothripidae), and Diabrotica speciosa (Germar) (Coleoptera: Chrysomelidae). Predation by D. speciosa occurred when the adults of this beetle ate leaves containing C. includens eggs. Parasitism of C. includens eggs was made by Trichogramma sp. (Hymenoptera: Trichogrammatidae) (table 1).
Larval mortality factors were rainfall and predation. These two factors caused mortality in all C. includens instars. The predators observed were spiders, ants (Hymenoptera: Formicidae), Orius sp., Geocoris sp. (Hemiptera: Lygaeidae), Franklinothrips sp., and Vespidae (Hymenoptera). Spiders and ants preyed on larvae in all instars. Geocoris sp. and Franklinothrips sp. were found preying on larvae of first, second, and third instars and Vespidae on third, fourth, and fifth instars (table 1). We did not observe C. includens mortality caused by physiological disturbance. This also occurred in previous experiments evaluating host plant effects on larvae (personal observation).
Pupal mortality was caused by predation by Vespidae, ants, and birds and parasitism by Copidosoma sp. (table 1).
The main species of ants observed preying on C. includens larvae were: Camponotus crassus (Mayr), Crematogaster evallans (Forel), Pseudomyrmex gracilis (Fabr.), Pseudomyrmex termitarius (Smith), Solenopsis geminata (Fabr.), and Solenopsis saevissima (Smith). The main species of Vespidae predators of C. includens were: Polistes simillimus (Zikan), Polistes versicolor (Olivier), Polybia ignobilis (Haliday), and Polybia occidentalis (Olivier).
The major causes of egg mortality egg were: inviability (MM = 37.4%), parasitism by Trichogramma sp. (MM = 23.4%), and predation by Orius sp. (MM = 23.1%). The major causes of larval mortality were predation by ants in first and second instars (MM = 64.7 and 54.6%, respectively) and Vespidae in third, fourth, and fifth instars (MM = 40.5, 46.2, and 55.3%, respectively). The major cause of pupal mortality was Vespidae (MM = 62.6%) (table 1).
Critical mortality stages of C. includens
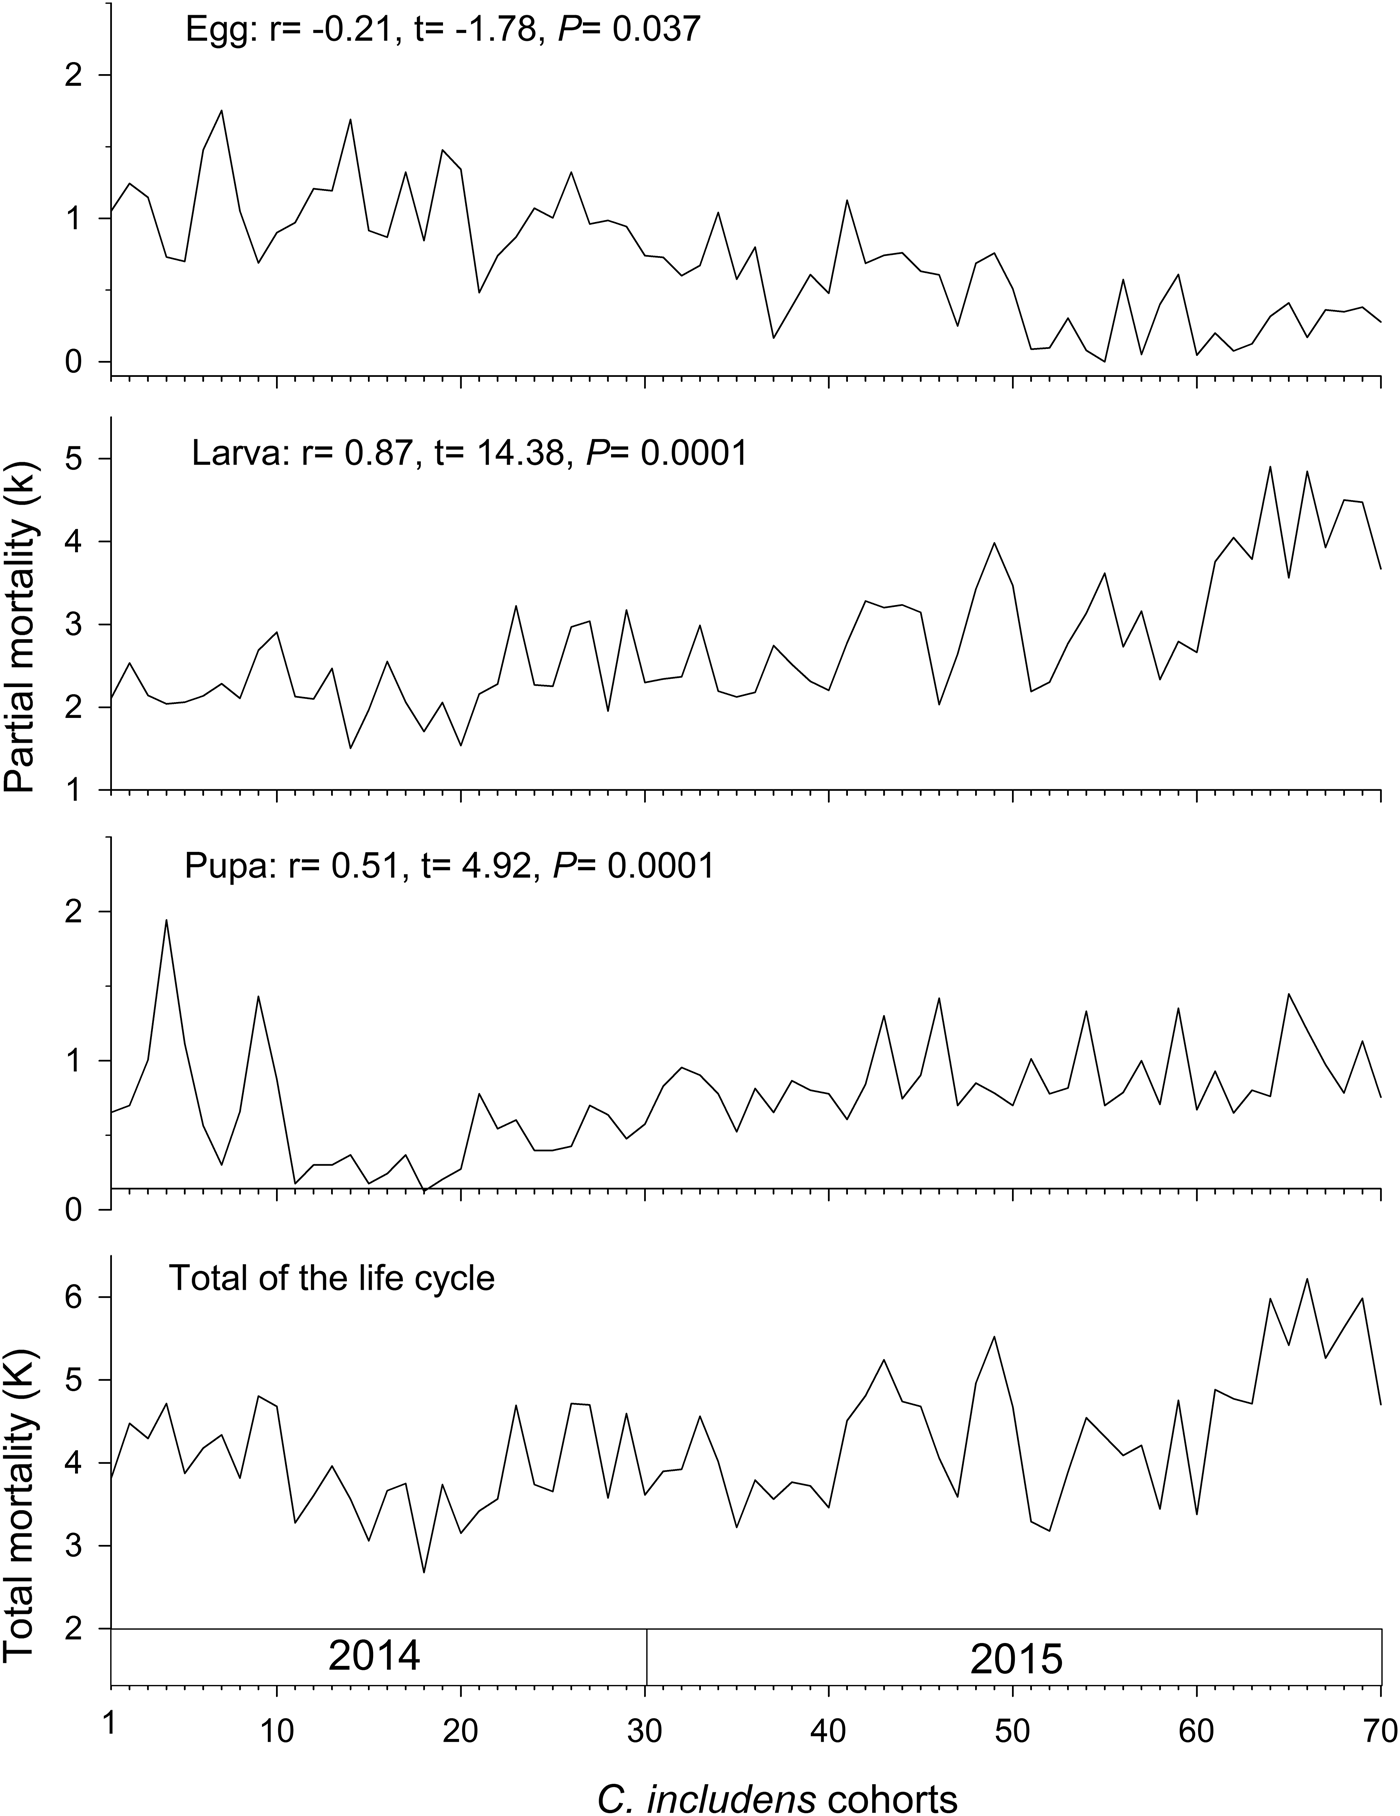
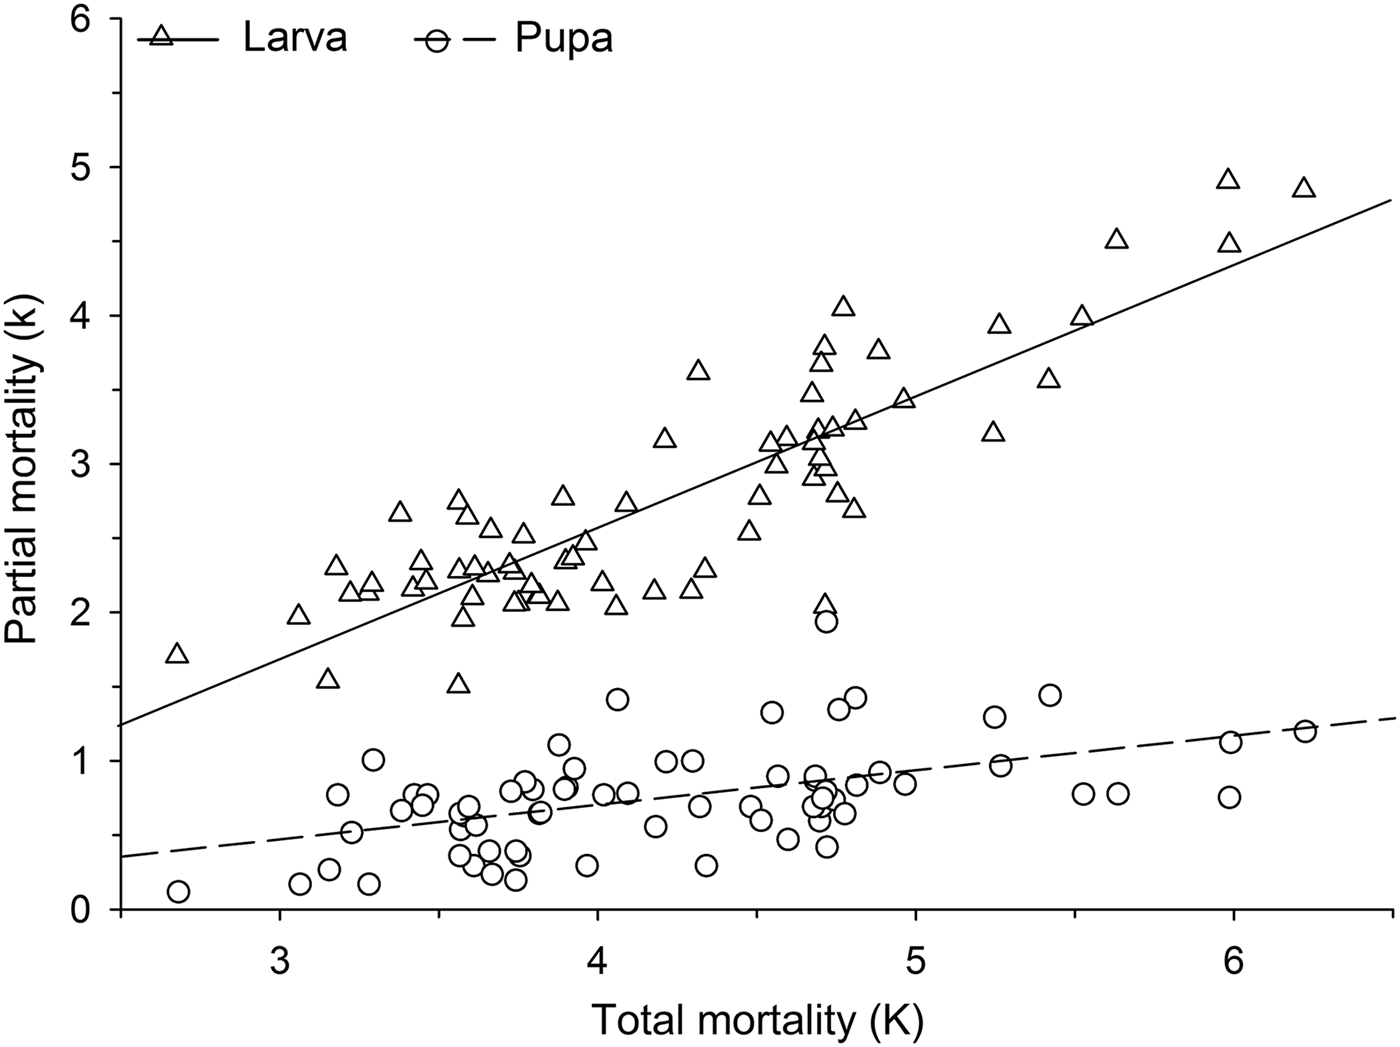
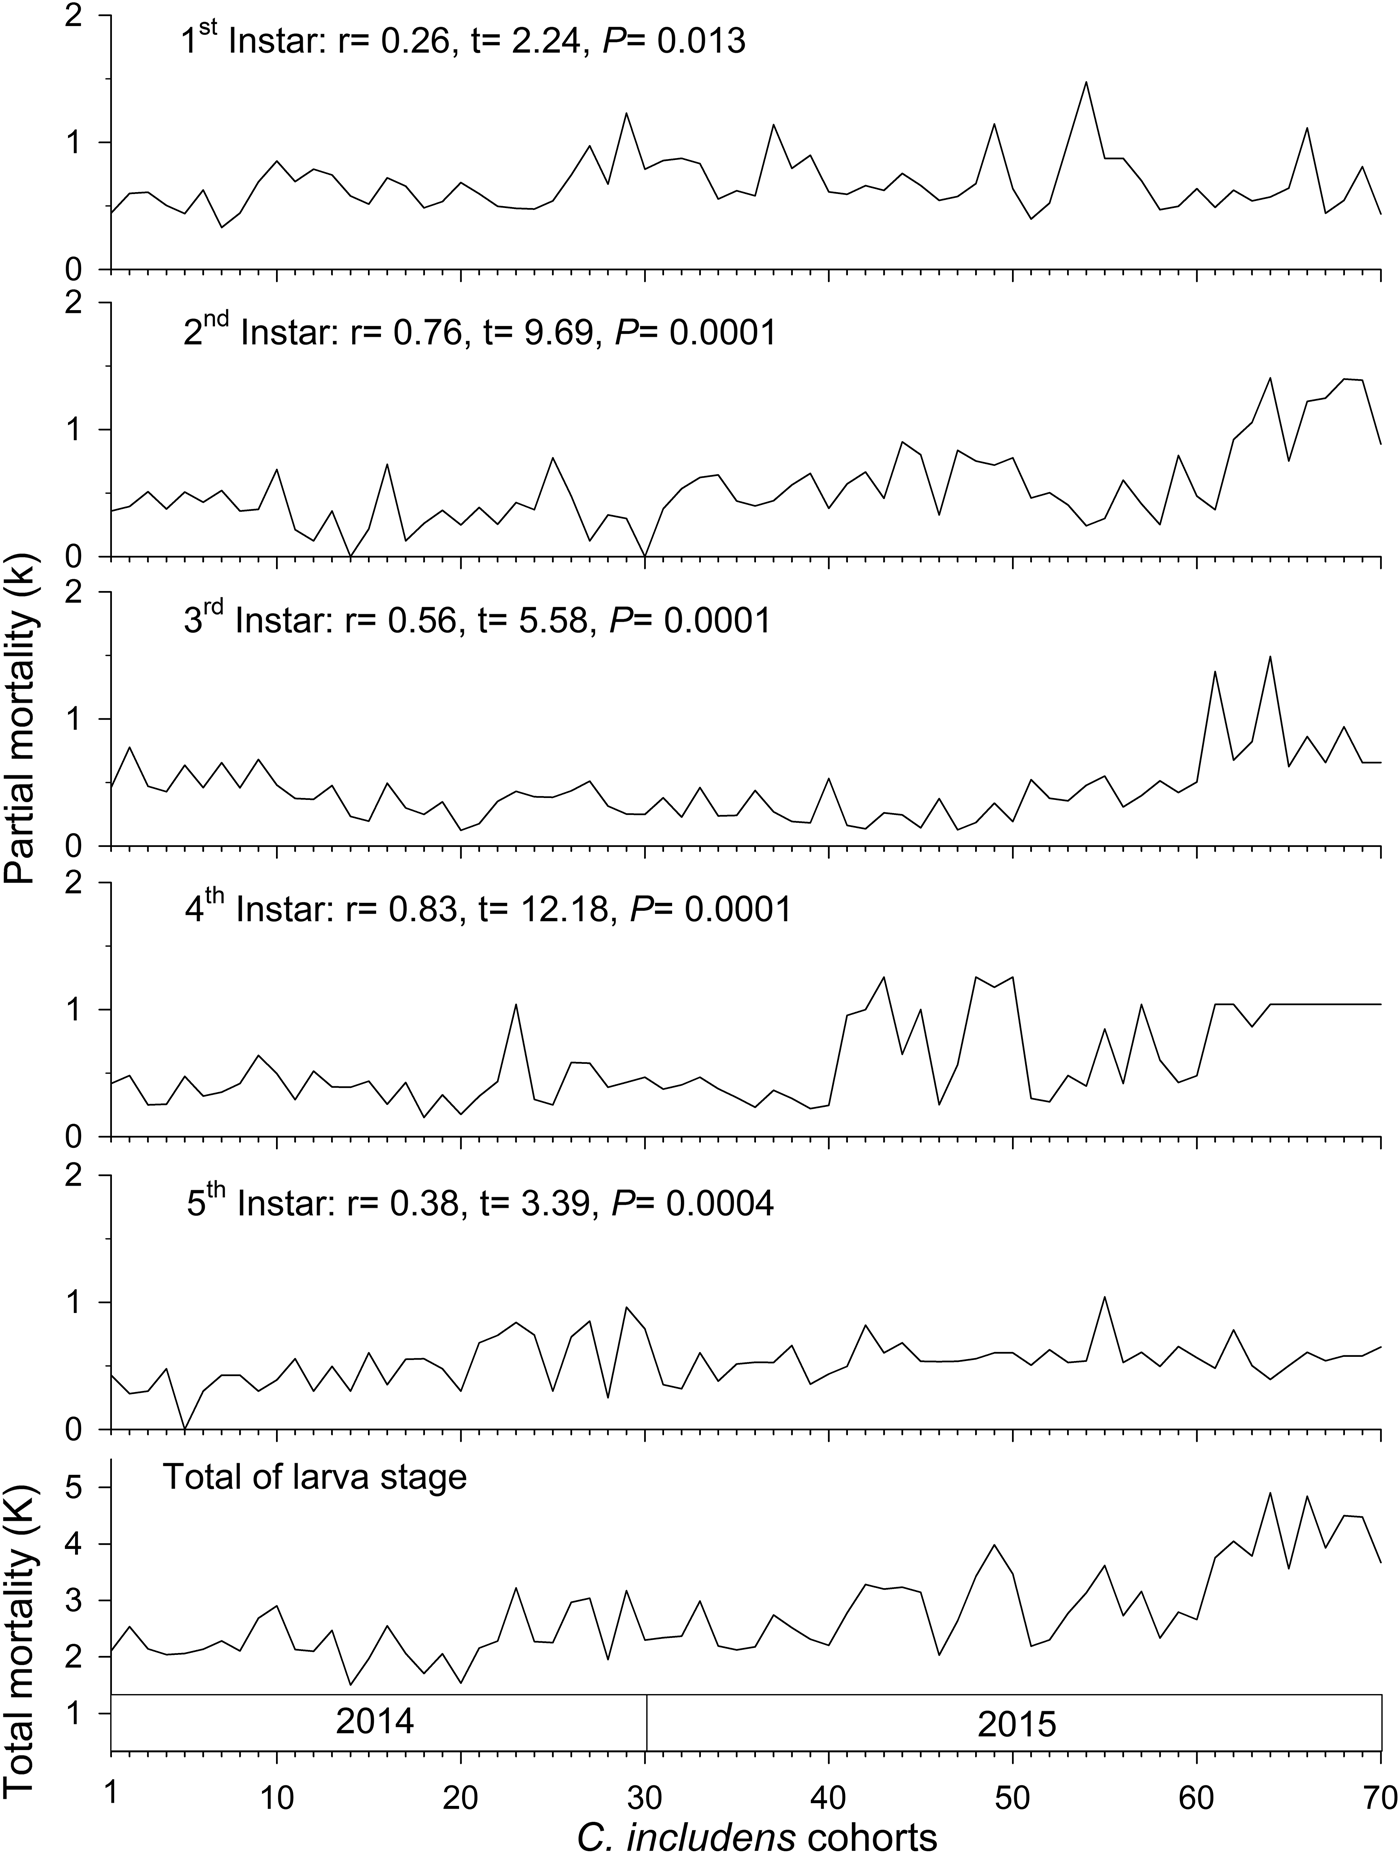
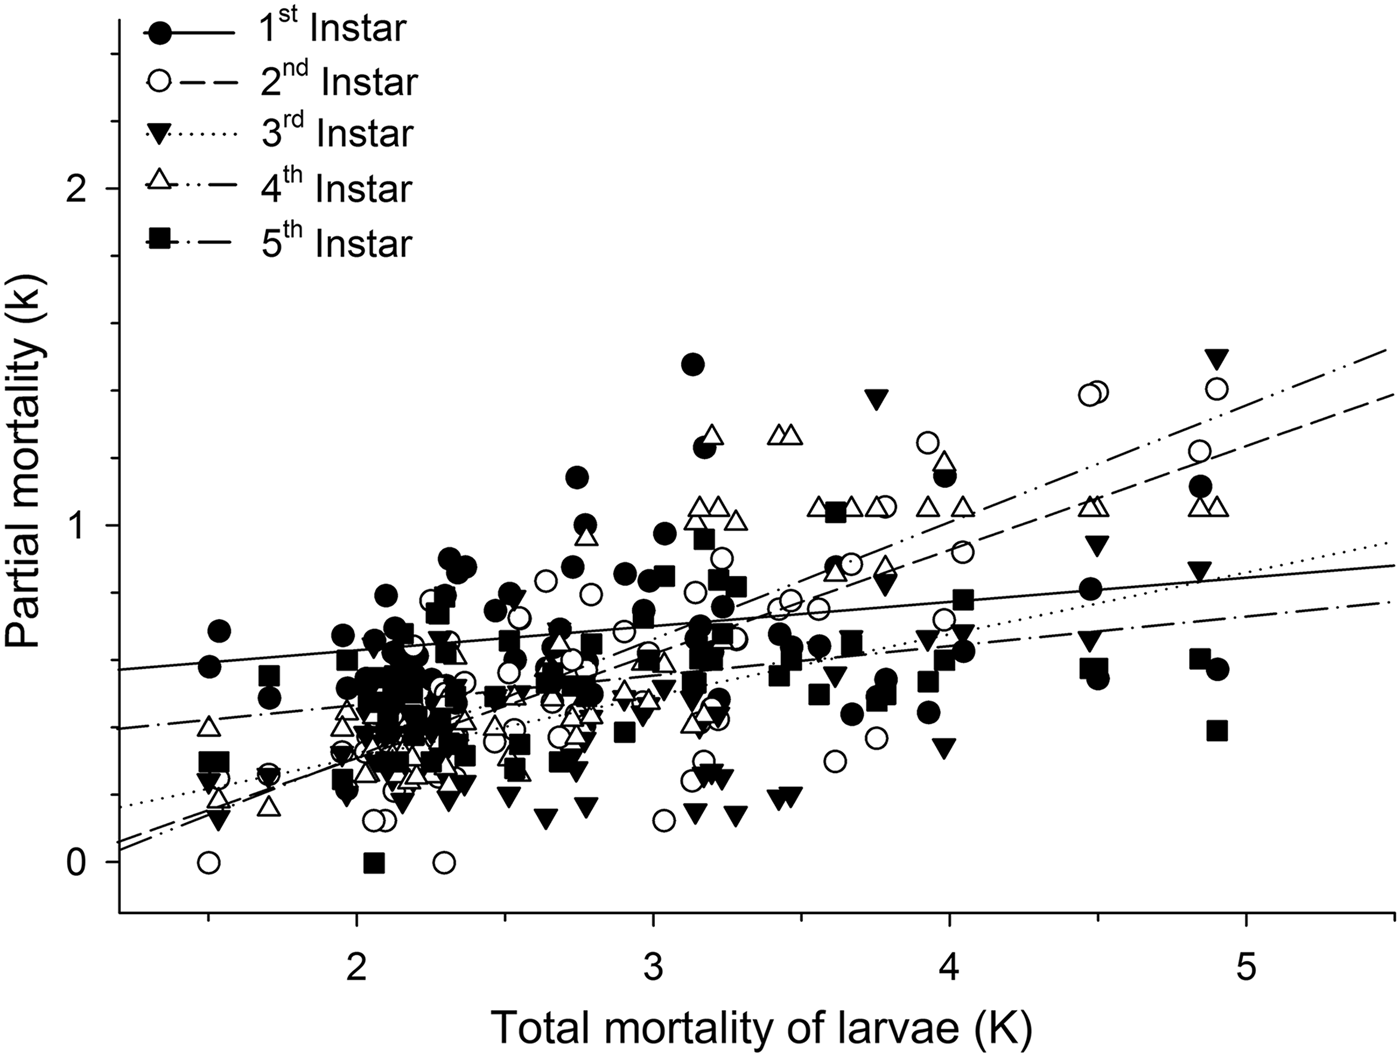
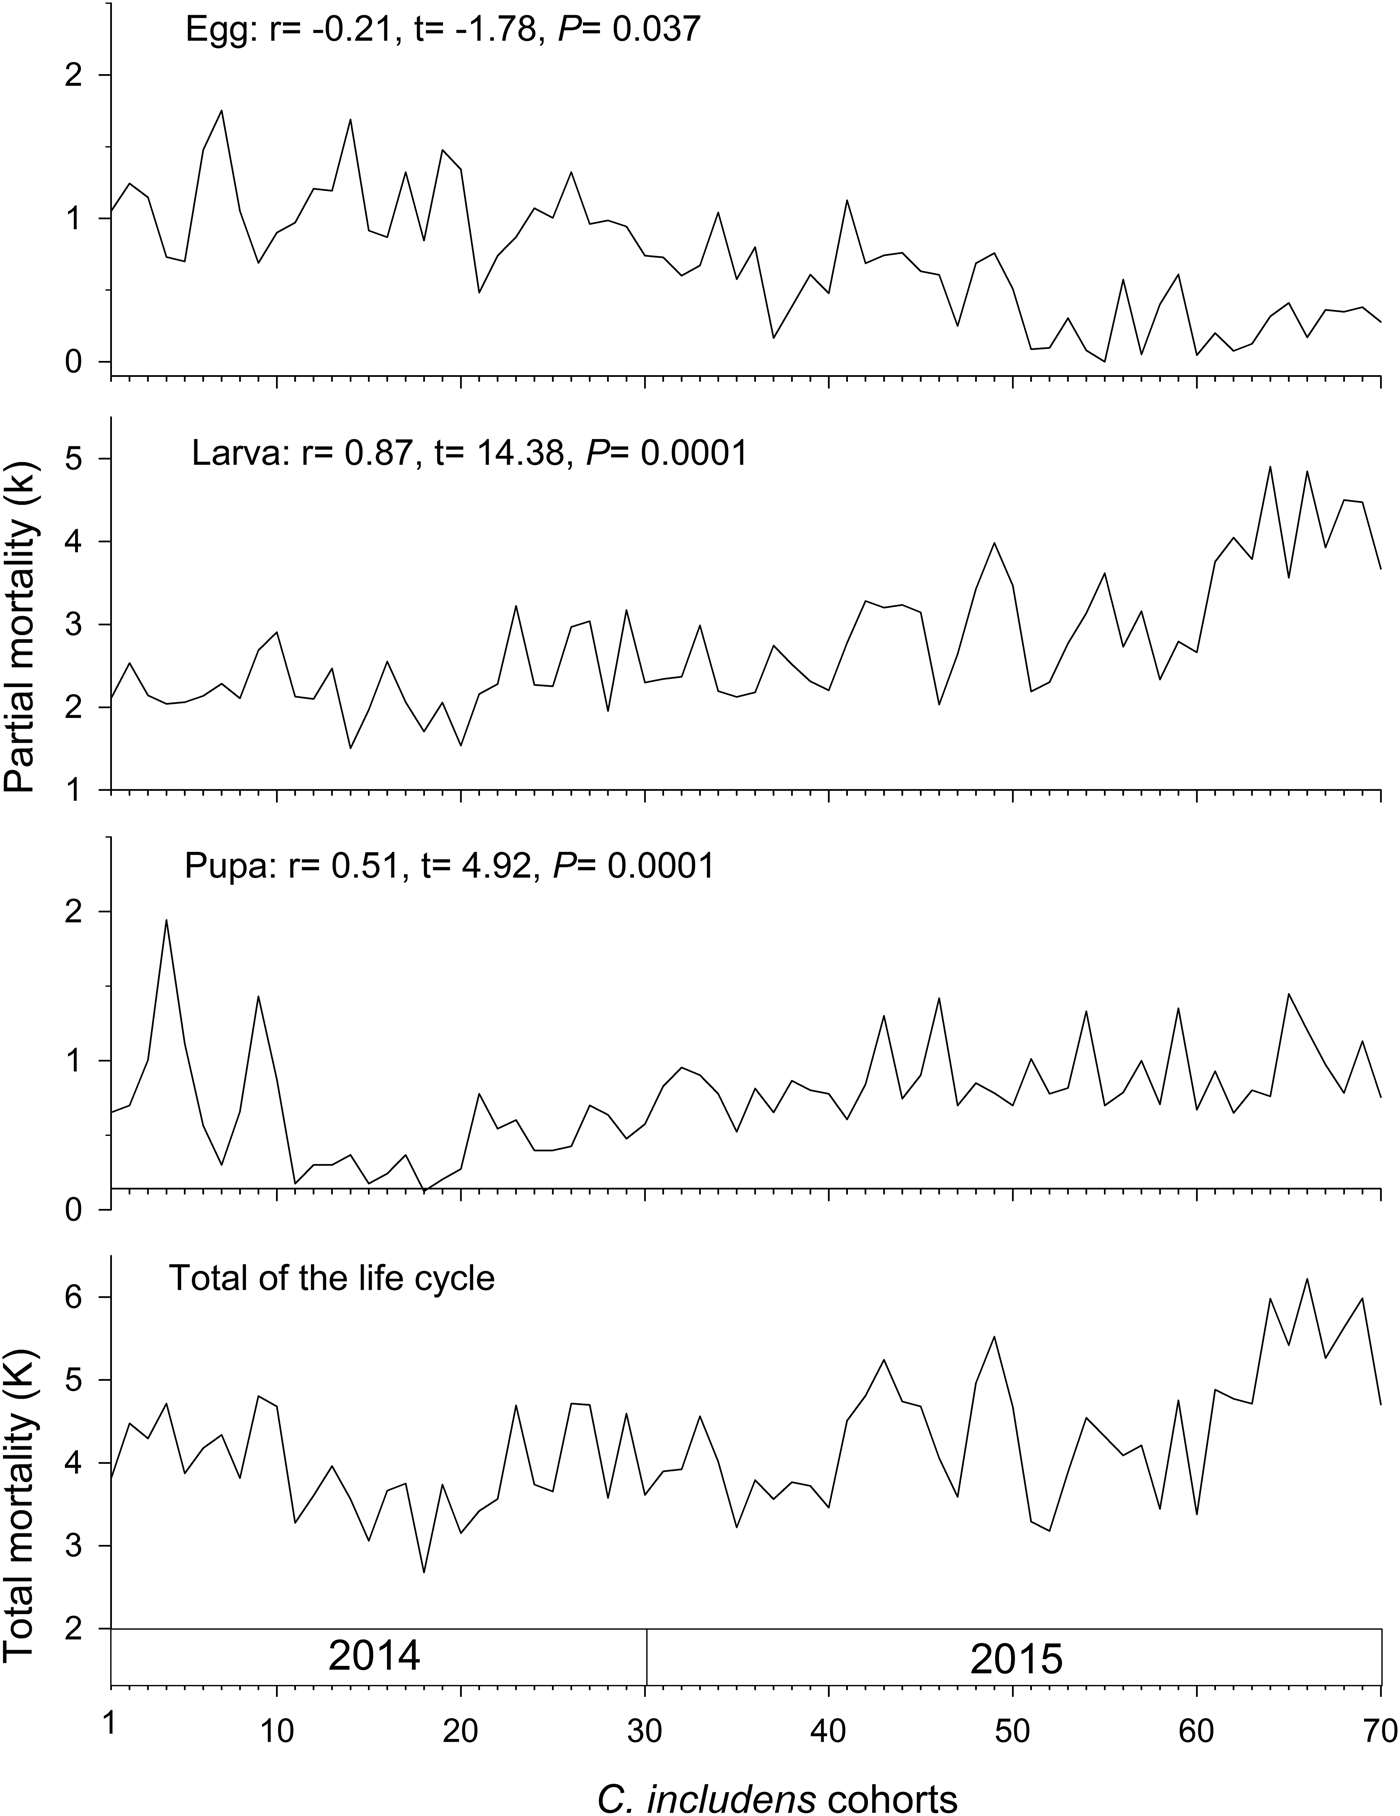
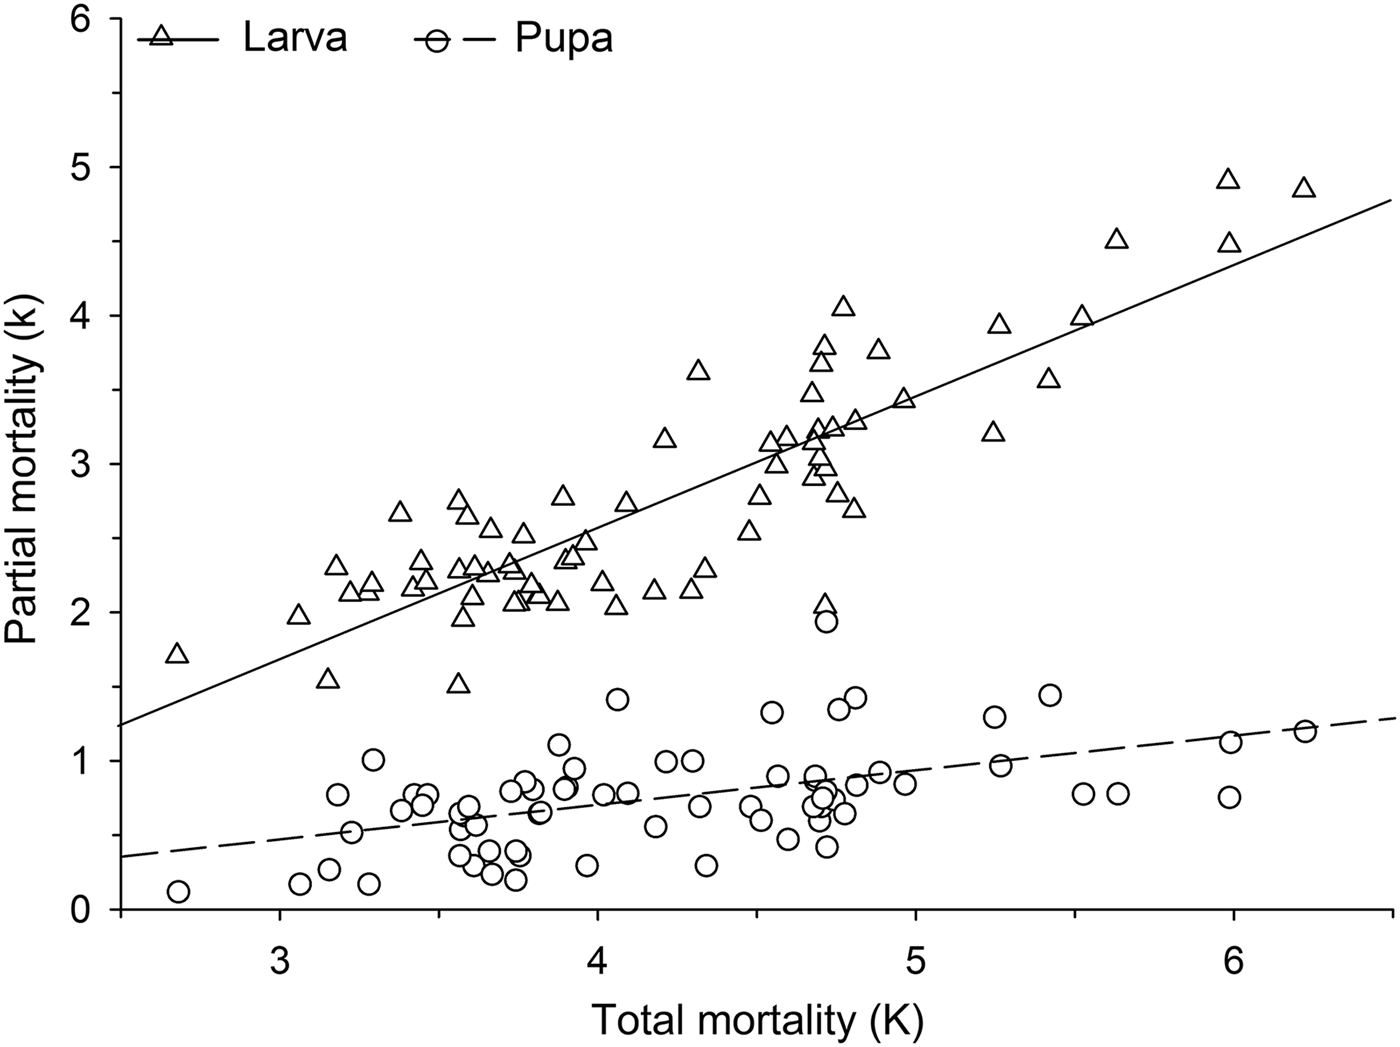
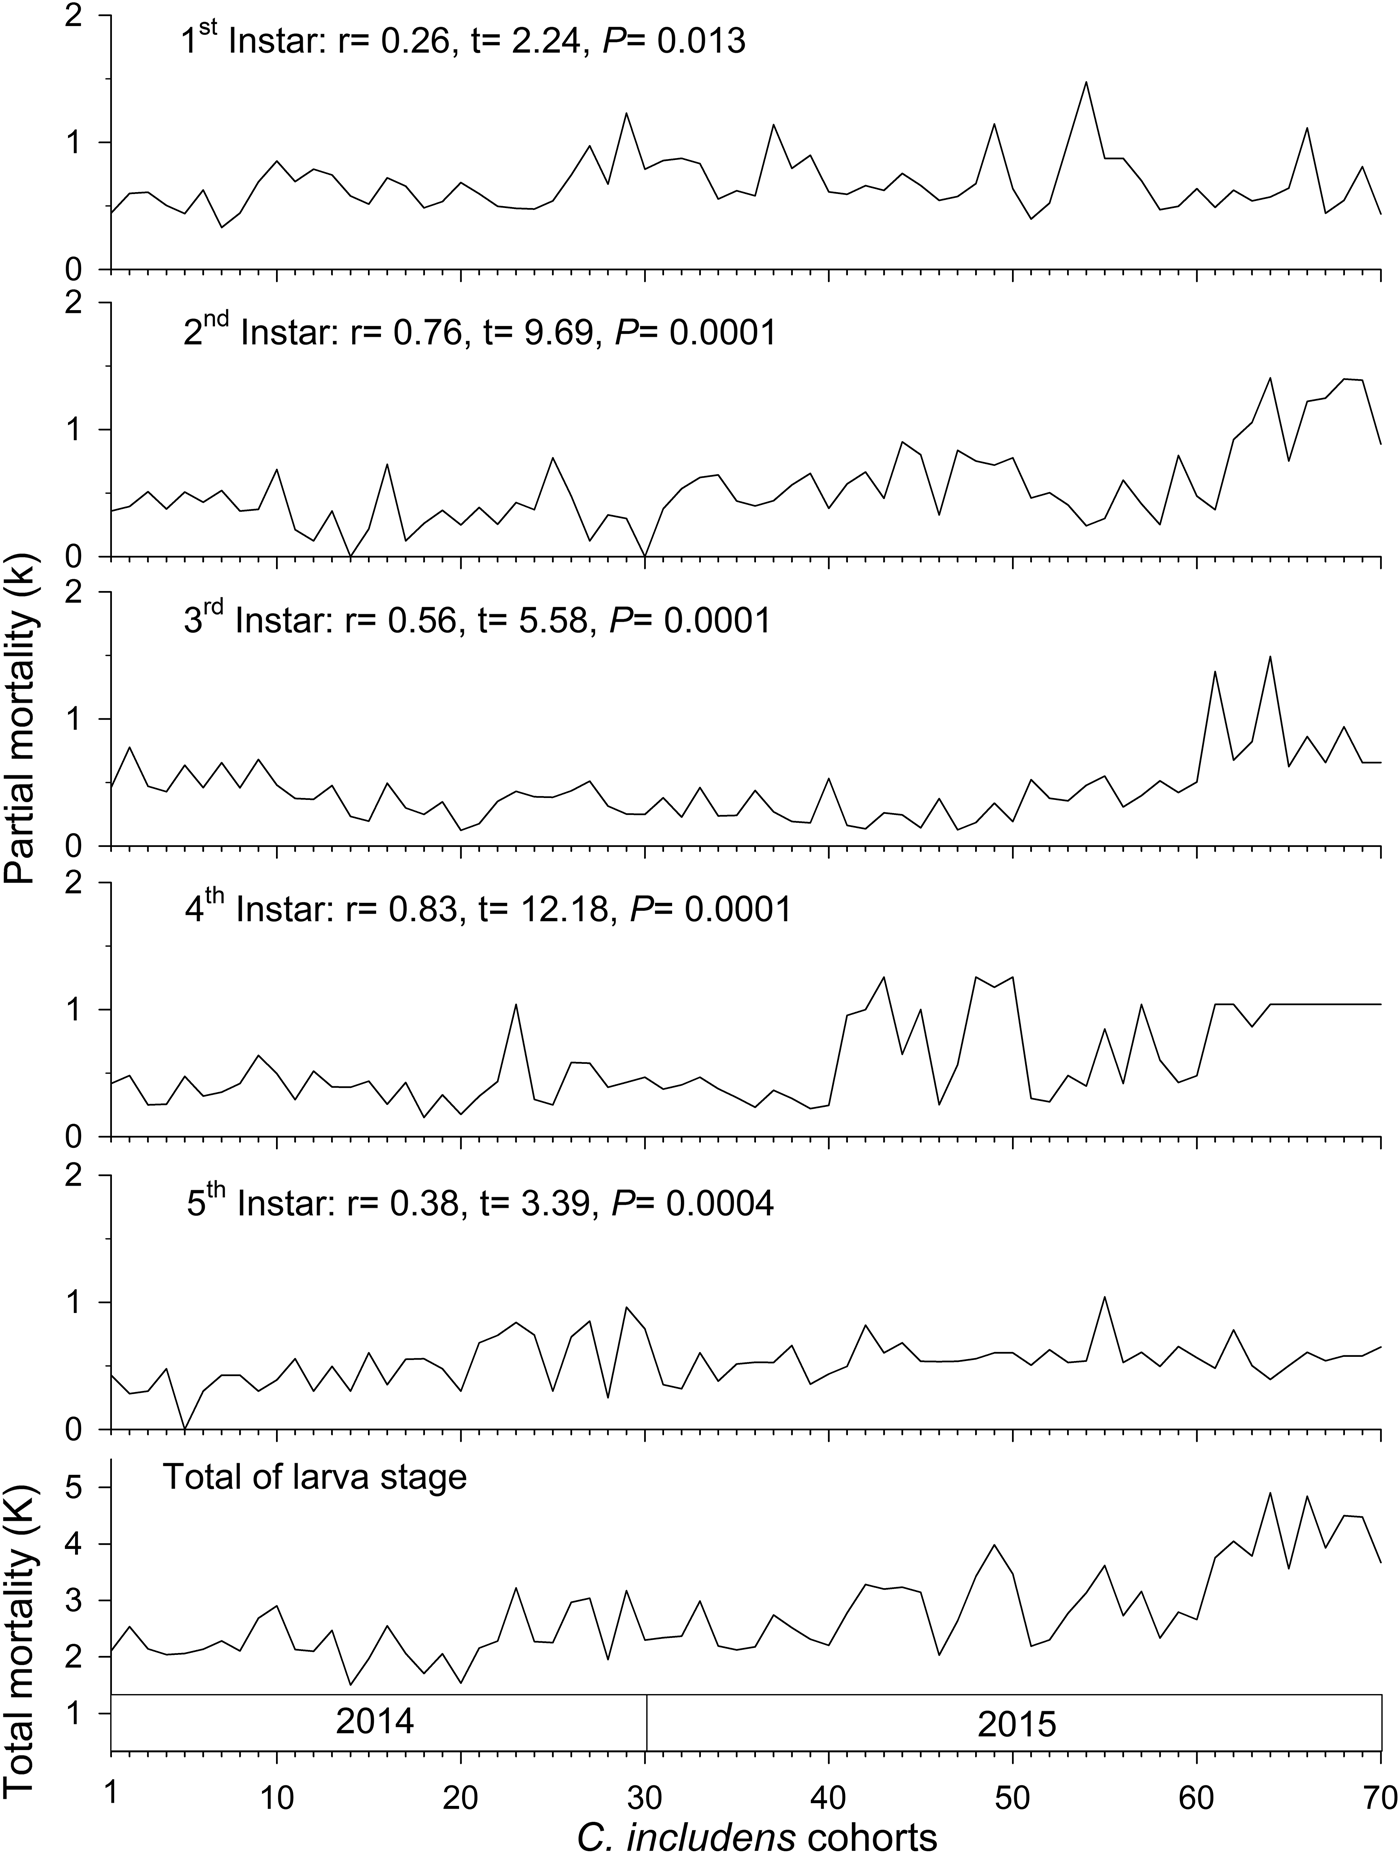
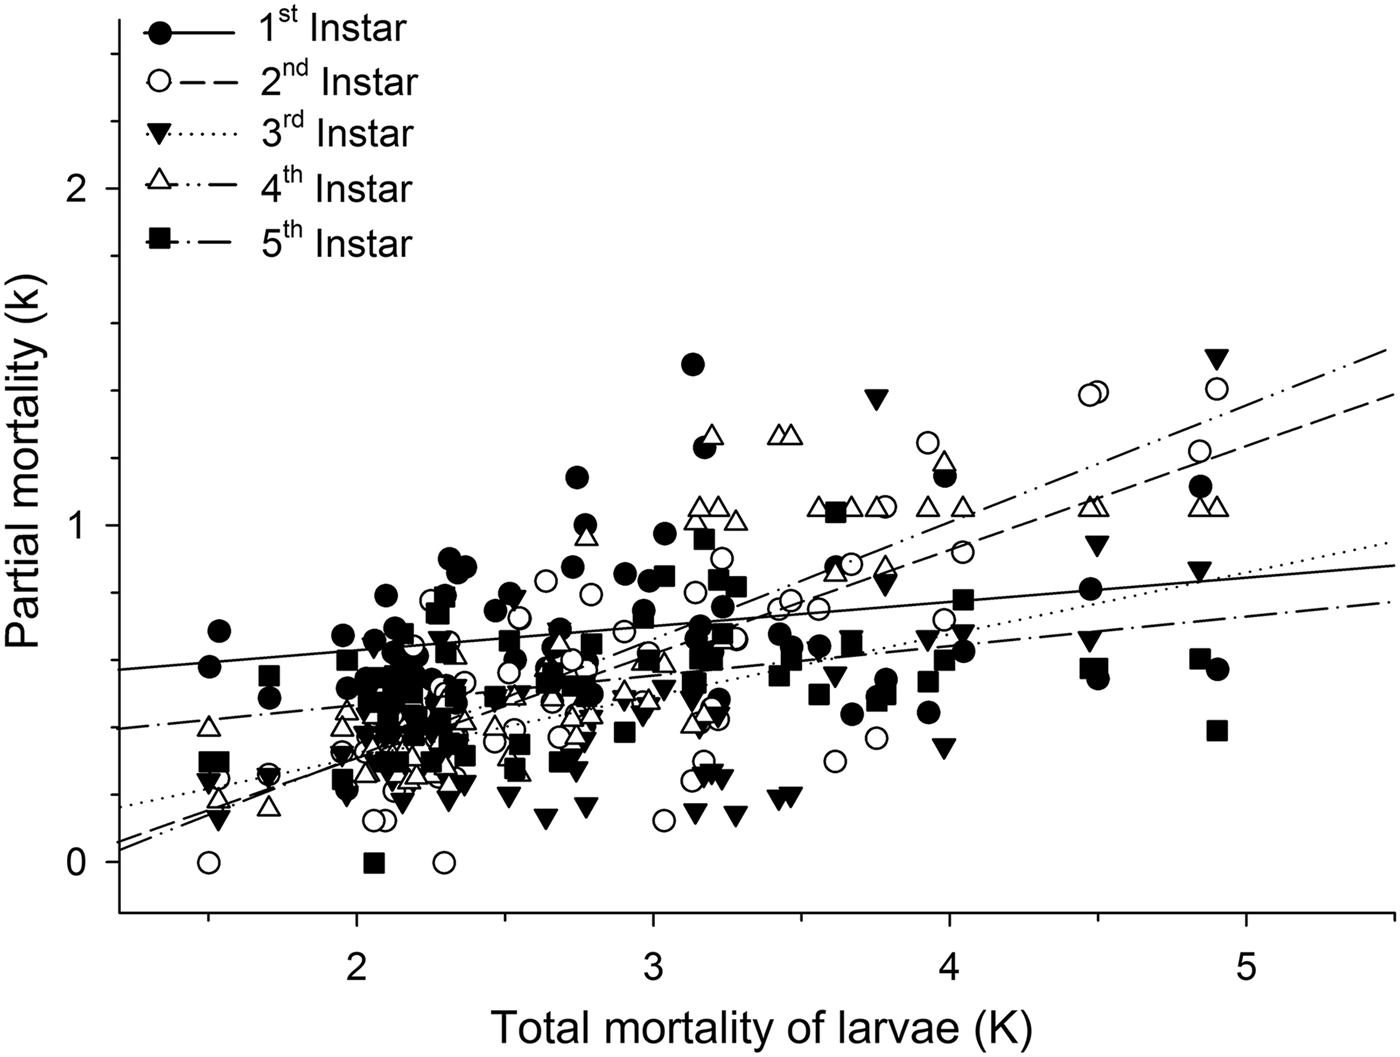
Mortalities in larval and pupal stages have positive and significant correlations (P < 0.05) with the total mortality of C. includens (fig. 1). Between these two stages, the larvae mortality curve showed higher inclination than the pupae (fig. 2). Mortalities in the first, second, third, fourth, and fifth instars showed positive and significant correlations (P < 0.05) with the larval total mortality (fig. 3). Among the instars, mortality curves of the second and fourth instars showed the highest inclinations (fig. 4). Therefore, the critical stages of C. includens mortality were second and fourth instars.
Determination of Chrysodeixis includens critical mortality stage using the mortality of egg, larva and pupa correlations with the total mortality of all immature stages combined.
Determination of Chrysodeixis includens critical mortality stage using simple linear regression analysis between larva and pupa mortalities with the total mortality of all immature stages combined. Linear regression curves of Larva: k = −0.97 + 0.88K(0.76 − 1.01), R 2 = 0.75, P < 0.001 and pupa: k = −0.23 + 0.23K(0.14 − 0.33), R 2 = 0.26, P < 0.001. Numbers in parentheses represent 95% confidence interval for the slope of the curves.
Determination of Chrysodeixis includens critical mortality stage using correlations between partial mortality of each instar with the total mortality of larvae.
Determination of Chrysodeixis includens critical mortality stage using simple linear regression analysis between the mortality of each instar with the total mortality of larvae. Linear regression curves of first instar: k = 0.48 + 0.07K(0.01 − 0.14), R 2 = 0.07, P = 0.0285; second instar: k = −0.32 + 0.31K(0.25 − 0.37), R 2 = 0.58, P < 0.001, third instar: k = −0.67 + 0.18K(0.12 − 0.25),R 2 = 0.31, P < 0.001; fourth instar: k = −0.38 + 0.35K(0.29 − 0.41),R 2 = 0.69, P < 0.001; fifth instar: k = 0.29 + 0.09K(0.04 − 0.14),R 2 = 0.14, P = 0.0012. Numbers in parentheses represent 95% confidence interval for the slope of the curves.
Key mortality factor of C. includens
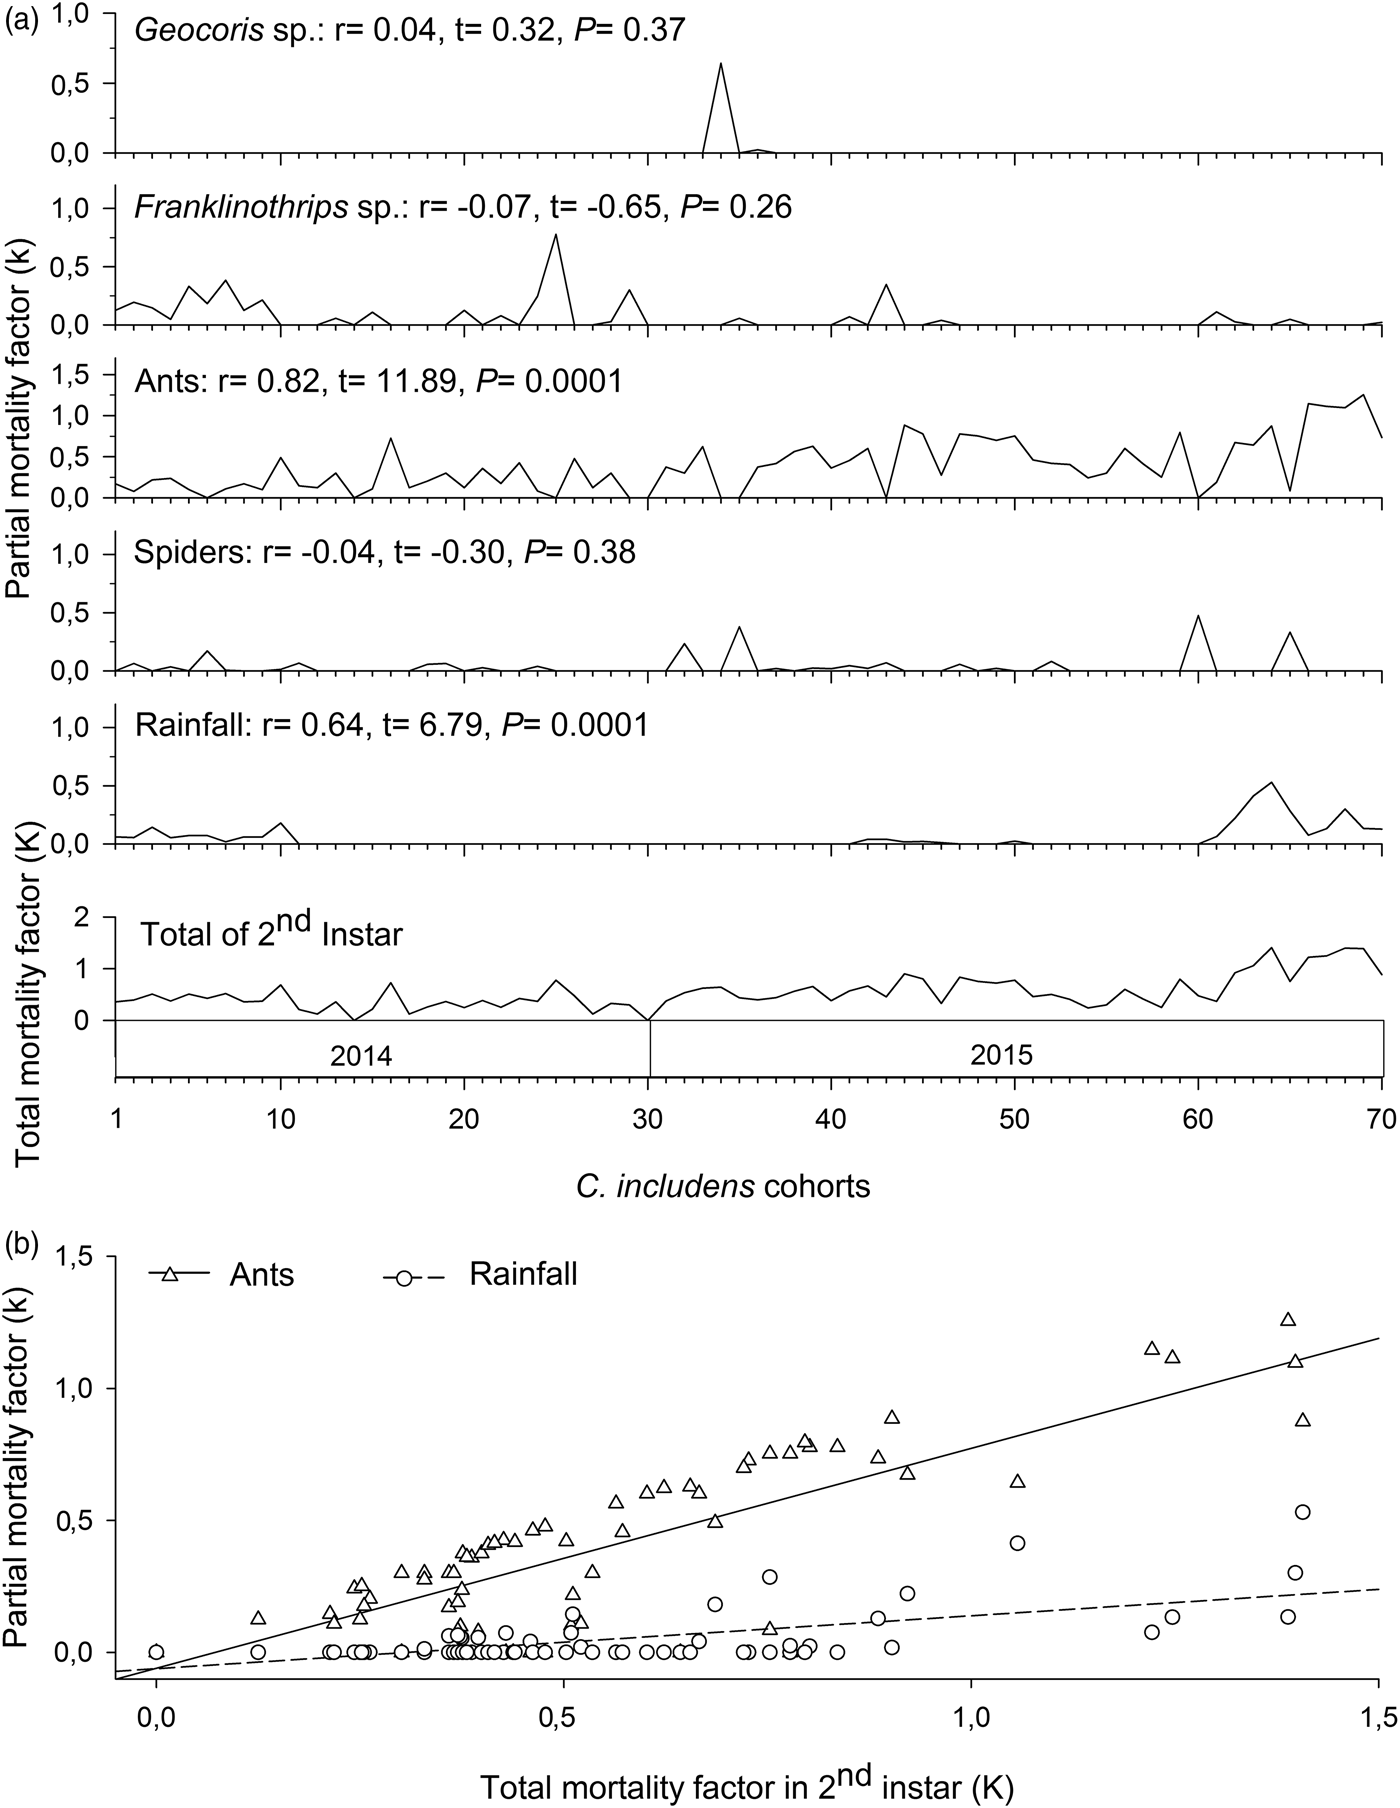
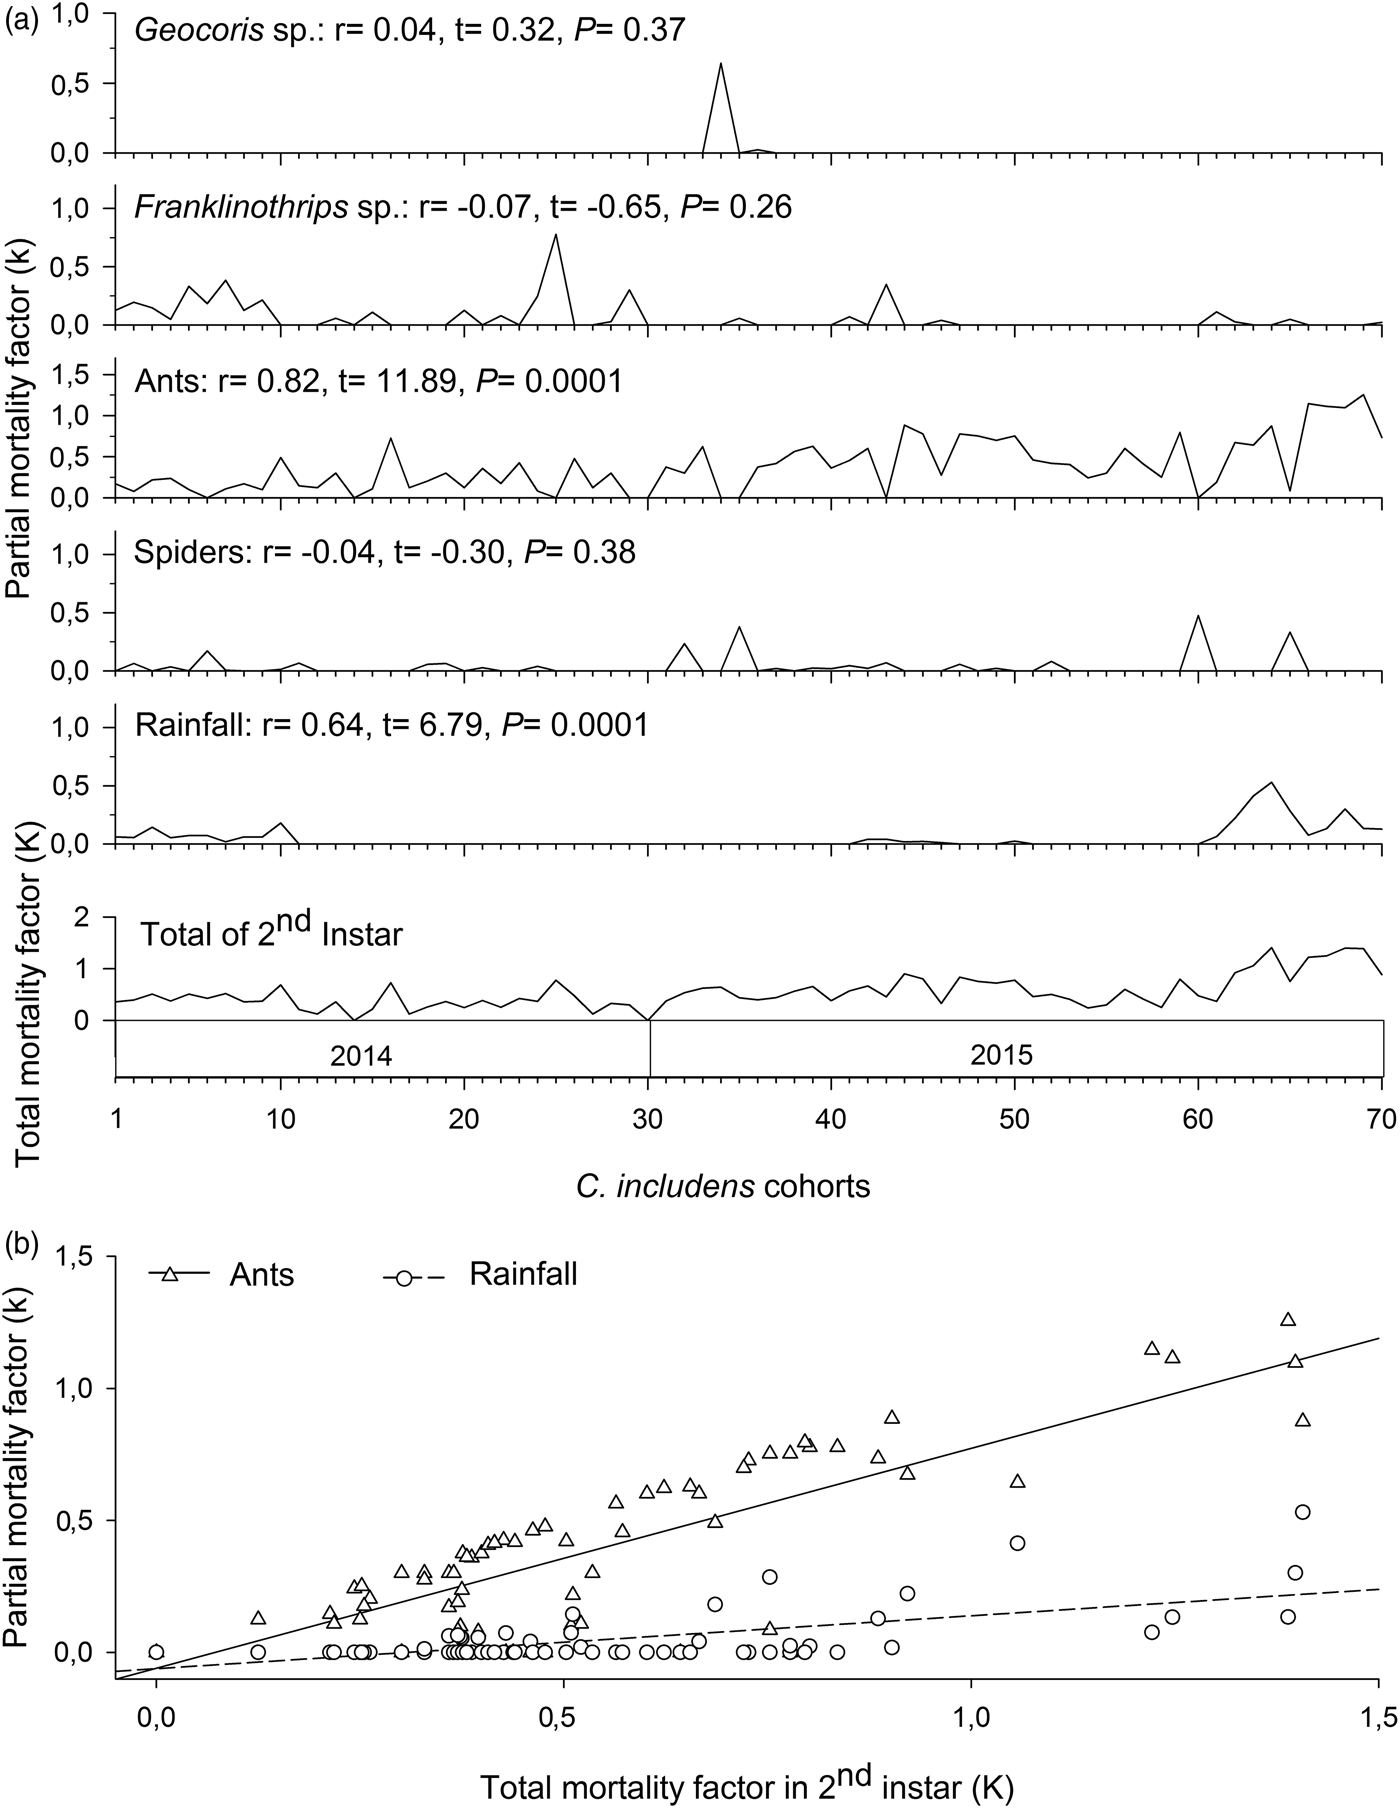
In the second instar, mortalities caused by ants and rainfall had positive and significant correlations (P < 0.05) with total mortality in this instar (fig. 5a). Between these two factors, the mortality curve caused by ants showed higher inclination than the mortality curve caused by the rainfall (fig. 5b).
Determination of Chrysodeixis includens key mortality factors of second instar using correlations between partial mortality of each factor with the total mortality (A). Simple linear regression analysis between the mortality of each factor with the total mortality (B). Linear regression curves of ants: k = −0.59 + 0.83K(0.69 − 0.97), R 2 = 0.68, P < 0.001 and rainfall: k = −0.61 + 0.20K(0.14 − 0.26), R 2 = 0.40, P < 0.001. Numbers in parentheses represent 95% confidence interval for the slope of the curves.
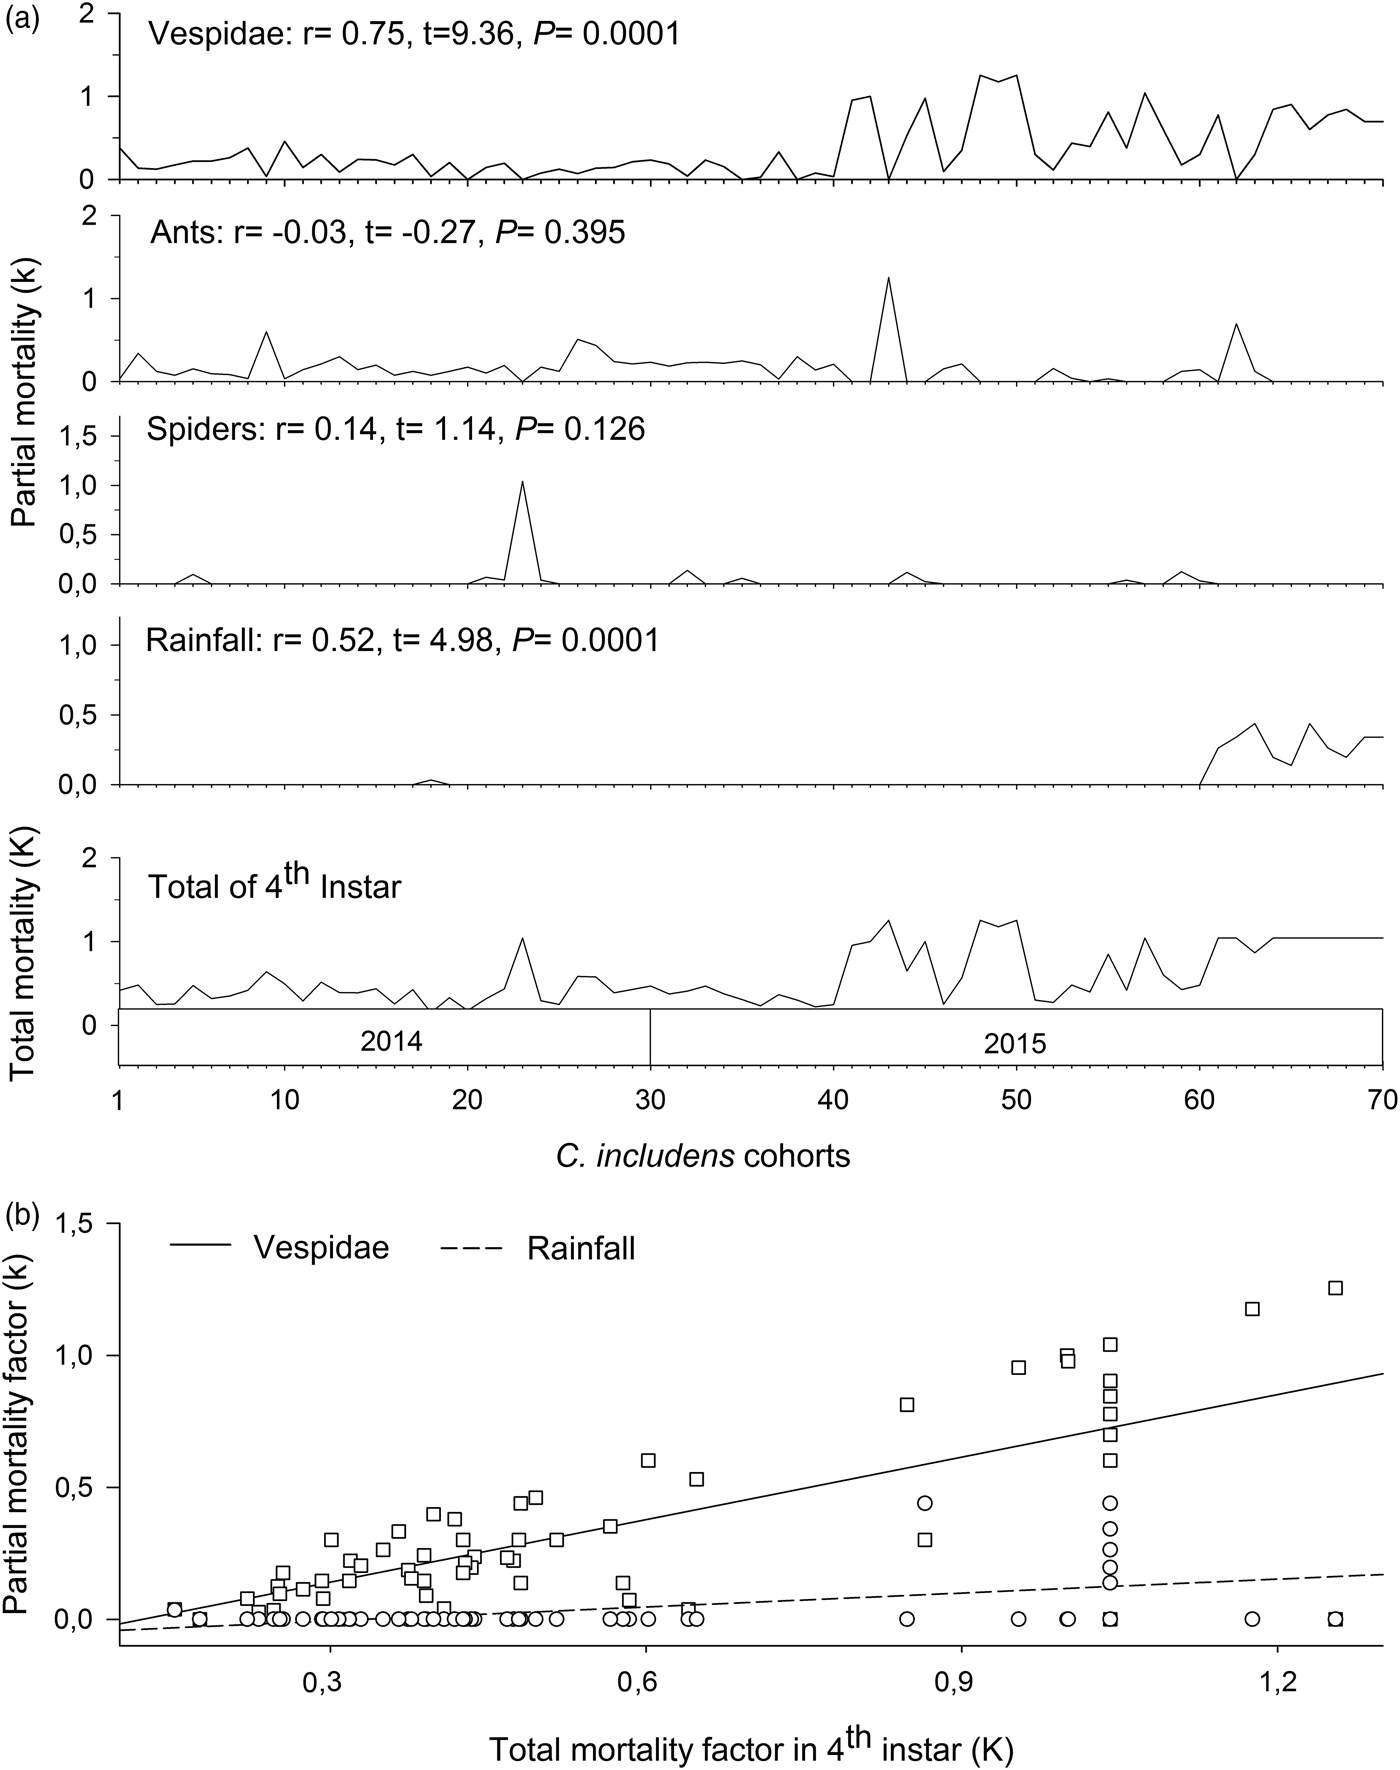
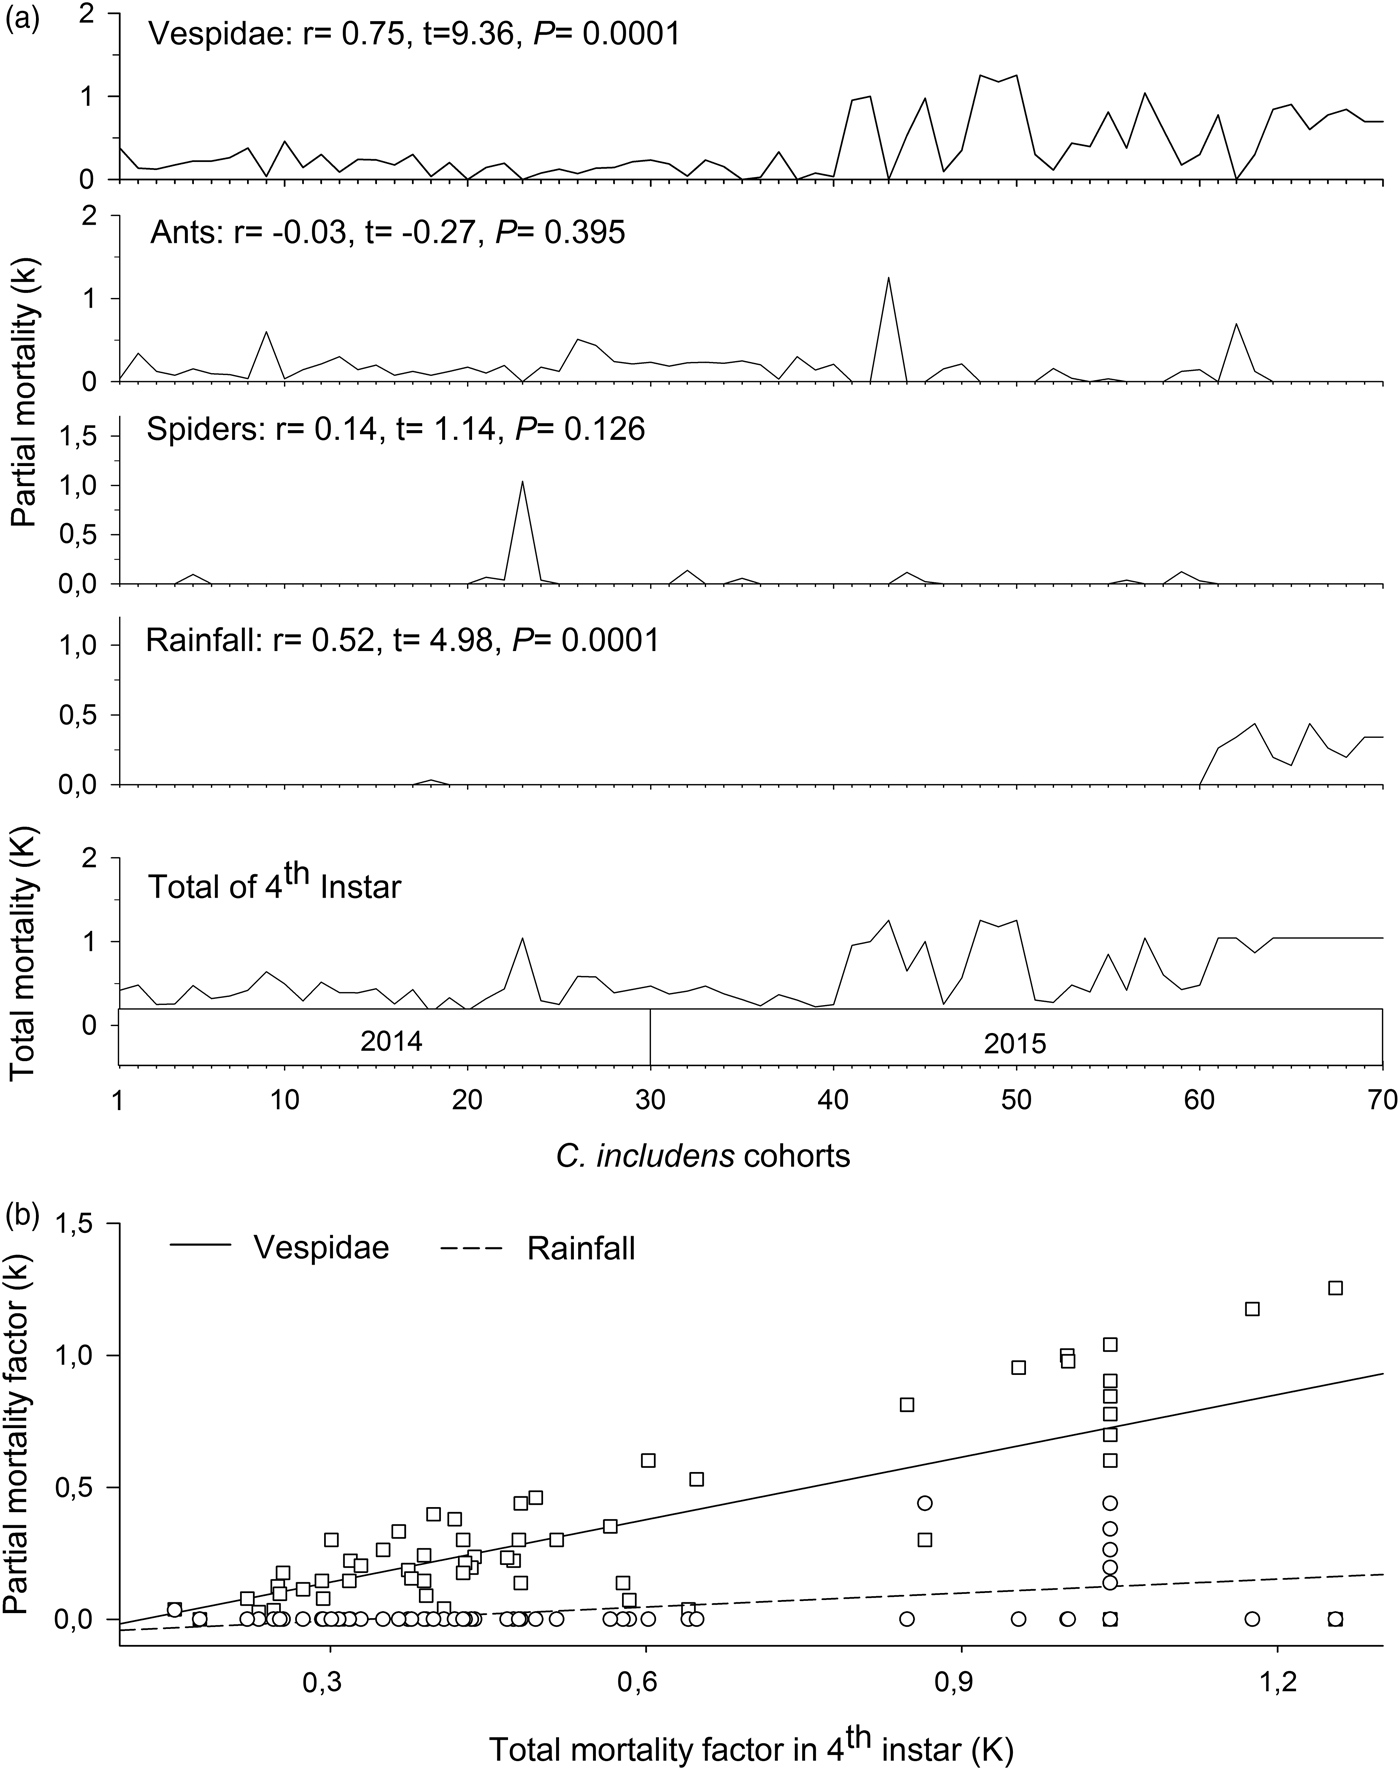
In the fourth instar, mortalities caused by Vespidae and rainfall had positive and significant correlations (P < 0.05) with total mortality in this instar (fig. 6a). Between these two factors, the mortality curve caused by Vespidae showed higher inclination than the mortality curve caused by the rains (fig. 6b).
Determination of Chrysodeixis includens key mortality factors of fourth instar using correlations between partial mortality of each factor with the total mortality (A). Simple linear regression analysis between the mortality of each factor with the total mortality (B). Linear regression curves of Vespidae: k = −0.96 + 0.79K(0.62 − 0.96), R 2 = 0.56, P < 0.001 and rainfall: k = −0.59 + 0.18K(0.11 − 0.25), R 2 = 0.27, P < 0.001. Numbers in parentheses represent 95% confidence interval for the slope of the curves.
Therefore, the key mortality factors of C. includens were predation by ants in the second instar and predation by Vespidae in the fourth instar. Based on the indispensable mortalities caused by predation by ants and by Vespidae, the suppression of these predators action would increase C. includens populations at 77.52 and 85.16%, respectively.
Discussion
For the development of efficient pest management systems for C. includes, it is essential to identify and quantify the factors affecting its population dynamics. The results of this study show that C. includens populations were regulated by the mortalities caused by biotic and abiotic factors that varied in the magnitude over its life cycle.
Chrysodeixis includens total mortality was very high (99.99%), indicating that natural mortality factors are sufficient to regulate its population density. Therefore, while managing the crops, we should adopt practices that allow the preservation of natural mortality agents for this pest.
The critical stage of C. includens mortality was the larval stage (second and fourth instars) because in these instars the natural mortality is very high. The high mortality can be due to the longer period of insect exposure to natural mortality factors during the larval stage comparing to the others stages (Gonring et al., Reference Gonring, Picanço, Zanuncio, Puiatti and Semeão2002, Reference Gonring, Picanço, Guedes and Silva2003). Chrysodeixis includens larval period is longer (14–20 days) than the egg (3 days) and pupal (7 days) stages (Mitchell, Reference Mitchell1967; Reid & Greene, Reference Reid and Greene1973).
Predation by ants was the C. includens mortality key factor in the second instar. Ants have important attributes that are responsible for their success as predators. For example, they: (a) respond to the prey density; (b) remain plentiful even when the prey is scarce because they can cannibalize their offspring and feed from alternative sources such as honeydew and flower nectar; (c) store food and continue capturing prey even when they are not immediately consumed; (d) prey on different sizes; and (e) they can be managed to increase their abundance, distribution, and contact with their prey (Risch & Carrol, Reference Risch and Carrol1982).
Predatory ants can be generalists or specialists. The generalist species are important biological control agents, but the specialists do not seem to play a significant role in agroecosystems (Way & Khoo, Reference Way and Khoo1992). They are abundant and successful in different environments (Hajek, Reference Hajek2004). As their nests are usually built on the ground, soil preparation and soil application of pesticide can cause significant negative impact on these predators (Ramos et al., Reference Ramos, Picanço, Santana Junior, Silva, Bacci, Gonring and Silva2012).
As foraging strategy, ants can perform individual or in-group search. The first is the most common strategy and includes the species with mass recruitment behavior (Carroll & Janzen, Reference Carroll and Janzen1973). During foraging, the workers seek prey, so each worker is responsible for a small search area. When prey is located, the worker returns to the nest by visual guidance and establishes an odor trail wherever it goes (Carroll & Janzen, Reference Carroll and Janzen1973). Depending on the species, the size of the ant, the density, and quality of the prey, the foraging workers send information to their partners about their location, and thereby recruit additional foragers (Traniello, Reference Traniello1989). The other forager follows the trail to the prey and locates the food. Predation occurs until the food source is exhausted or until the food is sufficient to feed the colony (Carroll & Janzen, Reference Carroll and Janzen1973).
During this research, we observed ants preying on larvae during the day and at night. Ramos et al. (Reference Ramos, Picanço, Santana Junior, Silva, Bacci, Gonring and Silva2012) had a similar result and found predation of Tuta absoluta (Meyrick) (Lepidoptera: Gelechiidae) by ants during the periods of morning, afternoon, and evening. Foraging characteristics, the large number of species and individuals in the field, and its high predation capacity make predatory ants important natural enemies for C. includens control. Further evidence of the importance of ants as C. includens predators is that the suppression of these predators’ action would increase C. includens populations by 77.52%.
Chrysodeixis includens mortality key factor in the fourth instar was predation by Vespidae. This was because this predator feeds preferably on Lepidoptera larvae (Rabb, Reference Rabb1960) in advanced instars (Picanço et al., Reference Picanço, Bacci, Queiroz, Silva, Miranda, Leite and Suinaga2011; Santana Junior et al., Reference Santana Junior, Gonring, Picanço, Ramos, Martins and Ferreira2012). The reason for this is the larger body size of the late instar larvae. The larger body size makes these larvae a good source of protein and facilitates its location by predators (Picanço et al., Reference Picanço, Oliveira, Rosado, Silva, Gontijo and Silva2010).
Acquired experience, distribution, and abundance of prey are important factors in Vespidae predator foraging (Richter, Reference Richter2000; Picanço et al., Reference Picanço, Oliveira, Rosado, Silva, Gontijo and Silva2010). Some Vespidae species choose foraging locations influenced by the prey density (Richter, Reference Richter2000) and previous experience of other foragers (Picanço et al., Reference Picanço, Oliveira, Rosado, Silva, Gontijo and Silva2010). Social Vespidae are opportunistic and generalists. However, in some situations, these predators behave individually as facultative specialists (Richter, Reference Richter2000). This behavior occurs when Vespidae return to forage in locations where they succeeded to find the prey (Suzuki, Reference Suzuki1978; Richter & Jeanne, Reference Richter and Jeanne1985; Picanço et al., Reference Picanço, Oliveira, Rosado, Silva, Gontijo and Silva2010), and so they can feed repeatedly on the same prey species (Picanço et al., Reference Picanço, Bacci, Queiroz, Silva, Miranda, Leite and Suinaga2011). During this research, we observed the constant return of Vespidae to plants with C. includens larvae. We also observed the behavior of recruitment of new individuals to foraging on these plants. According to O'Donnell & Jeanne (Reference O'donnell and Jeanne1992), foraging success increases with Vespidae age and experience. In this research, Vespidae foraging was intense and predation was high even in times where the population density of C. includens was low. This demonstrates the high efficiency of prey location by these predators.
The habitat of Vespidae must provide suitable nesting sites and food resources within reach of foraging to ensure their reproductive success (Sutherland, Reference Sutherland1996). For this reason, nests are built in trees or shrubs in forests located near agricultural crops, usually where prey availability is high. Lawton (Reference Lawton1983) demonstrated that an environment with more complex structure enables the establishment and survival of most species of social Vespidae. Our experiments were conducted in areas near the native vegetation. This possibly contributed to the high number of Vespidae foraging during the evaluations and, therefore, to the high C. includens mortality.
This study elucidates the factors and mechanisms involved in C. includens population regulation, so these factors should be considered in planning strategies and management tactics for this pest. The natural mortality of C. includens is high and the mortality factors are sufficient to reduce its population density. The mortality critical stage of C. includens is the larval stage, and second and fourth instars are most vulnerable to mortality factors. Mortality key factors are ants in the second instar and Vespidae in the fourth instar. The action of Vespidae and ants is crucial to the reduction of C. includens populations. The elimination of these factors can cause an increase of 77.52 and 85.17% of its population, respectively. Favoring these natural enemies through pest management tactics and the maintenance of their population levels should be considered during the decision-making process. Thus, efficient pest control becomes possible. Therefore, determining the importance of multiple mortality factors in the management of C. includens is the first step to a better understanding of their population dynamics.
Acknowledgements
CNPq, CAPES, and FAPEMIG by grants and funds granted. Dr Jacques Delabie, Dr Emilio Guerrieri, Dr Diego Carpintero, Dr Adalberto Santos for natural enemies identification. The Department of Entomology, University of Nebraska-Lincoln for all contribution in this paper.