We're just sick and tired of bloody earthquakes and the confidence-destroying buddies, aftershocks. Reference Anderson1
A large majority of peer reviewed literature on disaster resiliency emphasizes fostering resilient communities through improved business infrastructure, health delivery systems, and recovery projects for single-event disasters. Response of emergency services also addresses the surge capacity of resource triage management and planning at the community and regional levels. The Institute of Medicine asserts that it is “only possible to achieve an integrated resilient community that can respond effectively to a public health emergency through active collaboration, coordination, and shared responsibility among a broad group of public and private stakeholders and the community itself.”Reference Stroud, Altevogt and Goldfrank2 The common and shared element whereby they “tackle problems, gaps, and future opportunities” can be successfully addressed only if multiple stakeholders work together.Reference Stroud, Altevogt and Goldfrank2
There are few examples of crises, natural or human-generated, other than war that are sustained over time in which fostering resiliency has been used extensively or proved successful. Much is learned from the failed public health infrastructure and social protections and the challenges to resiliency by studying war and conflict. In addition to the obvious—affected populations normally flee any direct threat to life—the destruction of essential services in water, sanitation, basic health care, shelter, food, and energy for heating and cooling usually occurs before families decide to migrate across borders and become refugees or are internally displaced within their own countries. All preventive actions, including migration, are taken to ensure and maintain human security. When that state of awareness is reached, usually a “public health emergency” already exists and catalyzes a different decision tree for both individuals and communities. The main goals of both communities and aid workers become the restoration of essential services to prevent excess morbidity and mortality and restore that sense of human security.Reference Burkle and Greenough3 Rarely discussed in the aftermath of war is the postconflict phase that occurs once violence has ceased. This transitional phase, leading to sustained development, remains the most dangerous time for populations still at risk.
Postconflict environments are characterized as having less than 10% of the essential resources that were present before the warfare began, and vulnerable populations remain at an “emergency level” with little prospect of a rapid turnaround. Whereas the direct violence of warfare has ceased, the indirect mortality and morbidity caused by destroyed essential public health protections continue to rise and may remain elevated for up to a decade.Reference Ghobart, Huth and Russett4 In this regard, postconflict environments share similarities with major sustained weather-related and postgeophysical crises. However, little is known about whether similarly comparable and “feared” resiliency outcomes occur if essential services are destroyed or not maintained and a public health emergency exists in these sustained geophysical crises, as they would be by prolonged warfare.
We believe that the Christchurch, New Zealand, earthquakes are an example of a major, sustained and unrelenting geophysical event that has produced a catastrophic public health emergency. In the realm of major earthquakes worldwide, the NZ earthquakes were unique, primarily because of the sustained and repeated high level of geophysical destruction to the backbone of a large urban and suburban community. These factors and an awareness of current and future daily deficiencies have contributed to an altered community-level mindset that challenges traditional postdisaster resiliency factors and decision-making for many victims and governmental decision-makers. For those who have not left Christchurch in the past 12 months, a “new normal” has taken hold and now serves as an objective measure for the decision process to stay or leave. The new normal serves as an uncomfortable but realistic guideline against which further resiliency can be measured. This report describes the evolution to and development of the new normal state for Christchurch survivors.
THE CHRISTCHURCH EARTHQUAKE
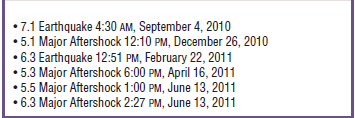
Scientists claim that between 10 000 and 15 000 earthquakes occur each year in New Zealand. Table 1 summarizes the sequence of the 2010-2011 NZ earthquakes. A 7.1 magnitude earthquake struck Christchurch (Canterbury or Darfield) at 4:35 am on September 4, 2010. The epicenter was 40.2 km west of the city but was shallow (10 km), lasting for 40 seconds. The 6.3 earthquake that occurred 6 months later (February 22, 2011) at 12:51 PM was centered 9.9 km from the center of Christchurch at a shallow depth of 5 km, causing widespread damage, injury, and death in the central city and further weakening structures affected by the previous earthquake. Another 6.3 aftershock on June 13 caused considerable additional damage.5
Magnitude and Sequence of Earthquakes and Major Aftershocks
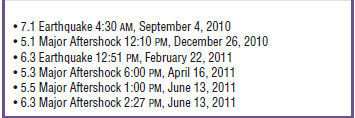
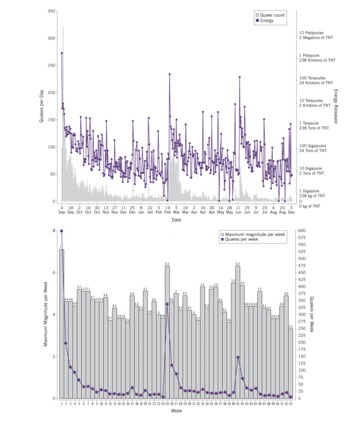
Figure 1 illustrates the sequence, magnitude, and energy level of the earthquakes and aftershocks. By September 2011, one year after the original earthquake, 7497 earthquakes greater than 2.0 magnitude have occurred, averaging more than 20 per day.5
Quake count and energy: total energy released to date is 3.55029 petajoules.
Top, Earthquake count and energy released during 12-month period. Bottom, Earthquakes per week measuring a magnitude of 3.0 or greater. Both closeness to Christchurch and the shallowness of the 6.3 earthquake were primarily responsible for the worsening of the damage over that caused by the previous 7.1 earthquake. Reproduced under public domain: Canterbury Quake Live. Christchurch, New Zealand. http://quake.crowe.co.nz/Quakelist/.

The shallowness to the surface of the second and third earthquakes and their proximity to the central business district were several times as severe as that of the initial 7.1 earthquake. In addition, the geology of the area “guided” the shock waves directly toward the city.6 Peak ground accelerations were among the highest ever recorded in the world, and four times higher than the highest accelerations measured in the magnitude 9.0 earthquake off the east coast of Japan in March 2011.7
The major consequences of earthquakes result primarily from the collapse of buildings and shelters. The Christchurch area has faced extremely difficult challenges from this series of earthquakes and aftershocks. Much of what followed in the collective mindset is related to whether one could still live and survive in this postdisaster environment. Society tolerates a level of risk, and risk management includes the recognition that some buildings are more important than others because they contain many people (ie, schools, public halls, shopping malls) or serve critical public functions (ie, hospitals).6 Whereas building and construction in New Zealand is highly legislated by a series of acts, regulations, codes, standards and advisories, no building is “earthquake proof.”6 In spite of stringent earthquake codes, seismic activity in the Christchurch earthquakes caused horizontal, vertical, and oblique ground movement that undermined many foundations, leaving few buildings to survive intact. However, information gained from research, much of it pioneered in New Zealand, has made buildings stiffer, stronger, and tougher to “control the structural yield” by which the damage occurs in a more predictable way without collapsing under designed shaking levels.7 Even so, about 7600 buildings were constructed precode and did not meet more than one-third of current code standards, and another 490 “heritage” buildings did not fare well.6
Liquefaction and “Slapdown”
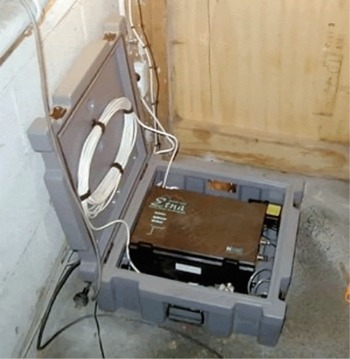
Additional damage resulted from liquefaction, lateral spreading, rock falls, and landslides. Liquefaction is the process whereby a saturated unconsolidated soil or sand loses strength and stiffness and rapidly converts into a suspension, causing the soil to flow like a liquid. Liquefaction has been a major contributor to urban seismic risk where buildings are close to one another.8 The ground is no longer able to support the weight of the buildings after the solid nature of the ground changes to a liquid mass. Lateral spreading occurs where the ground “slumps” toward low points, such as rivers and harbors, a process that can tear buildings apart.9 Most alarming in the Christchurch earthquake was that the ground acceleration was 2.2 times (220%) the force of gravity.7 A trampoline effect, or slapdown, showed that the dominate ground acceleration was vertical, while others were recorded as rapidly going up and down in a slapping motion.10Reference Gorman11 These slapping impacts generated energy that traveled back up toward the surface, magnifying the entire process and pushing large amounts of water to the surface. People, buildings, and automobiles were thrown high in the air. Near the epicenter of the earthquake a measuring device (Figure 2) located at the Heathcote Valley School12 recorded that the school building was effectively “punched” in the air with twice the force of gravity.Reference Reyners13
An Etna accelerograph (Kinemetrics, Inc, Pasadena, California) is inside a protective case and bolted to a concrete floor.

In spite of the long history of major earthquakes in the greater Christchurch area, most people had not heard of liquefaction or its risks. Significant liquefaction affected the central city, the sprawling eastern suburbs, and those buildings and homes built on coastal, riverside, and river delta areas. The unprecedented damage may have been exacerbated by a high water table from a wet winter. The population was amazed that major liquefaction occurred within seconds. Liquefaction is a frightening experience that clearly demonstrated the sheer power of the earthquake and that these earthquakes were different and of “global significance.”14 Liquefaction damage meant that some parts of Christchurch, including many notable historic buildings, cannot be rebuilt. Many published photos of engulfed automobiles and buildings into the liquefied and “slimy mass”15 contributed to fears that liquefaction could unexpectedly and suddenly engulf humans. What was not destroyed in one quake was destroyed in those that followed, especially the second earthquake, confirming that hope of recovery of the damaged land may be lost. All of these factors led to a sequence of “damage-rebuild, damage-rebuild, damage-rebuild” events that continually challenged and eroded individual, family, and community resiliency.
IMPACT ON ESSENTIAL SERVICES
Water and Sanitation
Eighty percent of the water and sewerage system was severely damaged.16 Liquefaction caused buried pipes to float to the surface and considerable damage to the gravity-fed system, which may need to be completely rebuilt.16 With the onset of winter, the damaged storm water systems were challenged when flooding became common due to sunken land, broken storm drains, and burst water mains.Reference Wright17
Basin baths became common because there was no reticulated water for up to two months; many relied on emergency rain water tanks that some homes had before the earthquakes. Potable water, which still required boiling before use, was distributed by tankers to central points for collection by residents. Once functioning, the city water supply was chlorinated to protect the community from possible waterborne health threats. Even now, residents have been required to conserve water and to flush toilets sparingly to minimize impact on the fragile infrastructure. Of the 2800 portable toilets and 31 000 chemical toilets that were distributed, many remain in use in the worse affected areas where sewer lines were repaired, only to need repair again after the second earthquake and again after the third, finally stalling further repairs.Reference Earthquake18 Heavy snowfalls in late July and mid-August caused further problems to the storm water system, causing a heavy load as the snow melted. In cold weather, the use of the outdoor portable toilets also became a trial, especially at night.Reference Wright17 Only recently have portable toilets been removed from the last of the health facilities using them; however, water is still being chlorinated and it is unsure when the process will cease.
Shelter
Earthquake destruction is primarily related to homes, buildings, and related infrastructure. The hastily created Canterbury Earthquake Recovery Authority (CERA) first estimated that more than 7000 houses required demolition and more than 100 000 were damaged.19 It is economically estimated that the total cost of rebuilding to insurers is about 30 billion NZ dollars, making these earthquakes the nation's costliest natural disaster and the third most costly event in world history after the 2011 Japan and the 1994 California earthquakes.Reference Conway20
All of Christchurch was initially mapped into four zones: red, orange, green, and white. Land marked red is unlikely to be suitable for continued residential occupation for a prolonged period of time. Some red zone areas will be totally abandoned as housing areas.Reference Conway20 The rebuilding of Christchurch is predicted to take 15 years or more.21 The Earthquake Commission received more than 345 000 claims for all earthquakes since September 4, 2011, one of the highest numbers ever handled by a single insurer in the world.Reference Stewart22 The criteria for defining residential areas as red zone are as followsReference Stewart22Reference Brownlee23:
• significant and extensive area-wide land damage;
• a high risk of further damage to land and buildings from low levels of shaking;
• the success of engineering solutions would be uncertain and uneconomical; and
• any repair would be disruptive and protracted.
These criteria resulted in the severe social dislocation of schooling, transport, and employment for entire communities. Repair in red zone areas would require raising the height of the land by 3 m or more, along with many kilometers of perimeter treatment and complete replacement of sewerage and water systems, electricity, and roadways. By June 2011, a total of 5100 properties in Christchurch and another 100 in the surrounding areas were classified as red zones. Orange or “hold zone” areas included about 10 000 residential properties. These areas were where engineers need to undertake further investigation. Some of the orange zones were defined as the direct result of the last magnitude 5.5 and 6.3 earthquakes on June 13. In addition, zones that were formerly defined as orange or green were changed to red zones after damage from the second and third major earthquakes, requiring reclassification before final decisions could be made.Reference Stewart22
Residents in the red zones have been given two options: one is an offer of purchase for the entire property at current value ratings; it also assumes all the insurance claims other than contents. The second is an offer of purchase for the land only; homeowners can continue to negotiate with their own insurer. As of June 2011, orange, green, and white zones (which include the central business district) were still being mapped. More than 100 000 properties were classified in green zones, meaning that these damaged homes can be repaired and rebuilt without further need for an area-wide land assessment.Reference Stewart22
By July 30, 2011, a total of 1500 residents in orange zones in the suburban town of Kaiapoi were told it would be another three weeks before hearing whether their land would be classified as a red or green zone. Speculation rose that from 700 to 1000 properties would be reclassified as red, that most of the previous orange zone area would be abandoned, and that the population would need to be prepared. Drop-in centers were being organized to provide the displaced population with housing options and to expedite future development options.Reference Heather24
Currently, disputes continue between engineers conducting assessments and the Christchurch City Council's pushing for closure regarding whether more than 600 homes at risk of future rock falls and slope instability will need to be abandoned. Concerns emphasize that citizens deserve “information on the future of their properties as soon as possible.”25 Whereas a $2 billion rebuild for central Christchurch is planned, others find that this is a “pretty big wish list.”Reference Sachdeva26 “People must decide how much they are prepared to pay to fund,” while others bluntly assert that “Christchurch is a bad investment for the future. We should just write the city off and move to a more stable place to live either in NZ or Australia.”Reference Sachdeva26
Health
Fortunately, direct health consequences were less than what would be expected with the severity of the earthquakes and the consequential damage. Normally, building codes dictate that everyone can emerge alive from a building designed for a 1-in-500-year earthquake shaking at that level. Hospitals and communication centers, which have higher standards, are designed for a 1-in-1000-year or even 1-in-2000-year earthquakes. Foundational lead rubber bearings, also referred to as “base isolation,” deployed at the Christchurch Women's Hospital, allowed the severe ground shaking to move horizontally beneath the building, thereby reducing and isolating it from other forces.6 The Southern Cross Hospital Christchurch “behaved well” because of a new generation of structures that both prevented collapse and allowed the building to be used immediately after the quake.6 Of the 181 total deaths (extremely small given the severity of these earthquakes), 134 resulted from unreinforced masonry and two multistory buildings.6
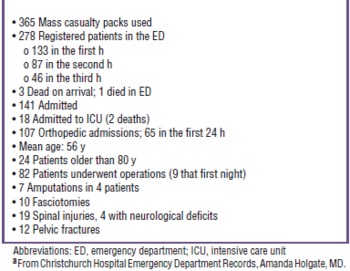
Reports confirmed that during the first hour at Christchurch Hospital emergency department (ED), “those injured arrived in cars, on foot, carried in by others, in police vehicles and in the back of small trucks, not by ambulance.”Reference van Beyen27 As such, little prehospital triage or treatment was performed. Casualty data are indicated in Table 2. The ambulance bay to the ED was damaged and communications failed, leaving the ED without information on the outside extent of the disaster. There was no lack of health personnel, and an emergency medicine physician triaged specialists and others to the 10 available resuscitation bays.Reference van Beyen27 After the first earthquake, makeshift treatment and triage areas functioned from parks and shopping malls.Reference McColl28 Approximately 100 additional unregistered patients were treated and released or transferred. Not surprisingly, amputations were completed to free survivors from the rubble.Reference McColl28
Casualty Data From the Sole Emergency Department at Christchurch Hospitala

At Christchurch Hospital, electrical power was lost immediately but “six back-up diesel generators kicked in.”Reference van Beyen27 Power to the one generator for the ED, intensive care unit (ICU), operating rooms, radiology, mortuary, and elevators repeatedly malfunctioned. Because the hospital elevators to radiology failed, the ED relied on portable x-ray and ultrasound units.Reference van Beyen27 Subsequent investigation showed that high vertical ground acceleration caused the oil pressure switch to break and sediment to clog the fuel tank, pump, and lines. All other critical emergency electricity generators and switch gear at nontrauma hospitals within the city operated during the electricity outages of varying lengths that followed all the major earthquakes, but considerable ongoing problems continued to strain the generators.Reference McColl2829
Water began rising from the basement of the hospital and further threatened hospital infrastructure. The blood bank was flooded, and alarms “clanged and blared, unable to be silenced.”Reference van Beyen27 The city water supply to the hospital also failed. Safety concerns led to the evacuation and relocation of patients to many regional hospitals. More than 640 elderly care beds were lost, requiring more than 520 transfers to residential care facilities throughout New Zealand and elsewhere in the South and North Islands; 300 transfers were officially organized; and the rest of the patients were taken in by families. Tragically, the Canterbury District Health Board staff responsible for vulnerable persons reported to the Health Board on September 9, 2011, that 104 of the 520 nursing home residents evacuated from Christchurch after the February quake died, a higher number than would be considered normal.Reference Gutschlag and Ward30 In addition, community nursing support suffered from destroyed offices and electronic records. With damaged roads and limited access, patients were transferred without notifying the providers. Of the dialysis patients transferred to Auckland, 42 required triage and urgent dialysis on arrival. Residential care has remained a concern, as many patients had to be moved out. While repatriation to care centers needed to be arranged, bed space has been limited. Of the 130 pharmacies, only 49 provided services that functioned close to normal. Both general practitioners and pharmacies have witnessed a change in demographics, as census numbers have increased in some areas and decreased in others. Coordination has been designed to provide replacements and to move staff who were laid off to other areas where more staff are now needed.31
There has been a rise in illness among health workers, resulting from the onset of winter, individual and family stress, further damage to their own homes, and new damage with the subsequent earthquakes. Staff from outside of the area have been brought in to provide respite.Reference McColl2829 After the initial and scary envelopment of the area with earthquake-related dust, Christchurch has experienced a higher number of days with increased air pollution as a direct consequence of the dust. Moreover, Christchurch has had 21 high-pollution nights from January 1 to July 31, 2011—9 more than at the same time last year. Authorities confirmed that 9 of the 21 were “typical” for this time of year, while the other 12 were related to dust and silt in the air from the February 22 and June 13 earthquakes.Reference McColl2832
Food
Many commercial food retailers, warehouses, and stocks were damaged in the first and subsequent earthquakes. Initially, essential food and household items such as milk, bread, and children's diapers were often unavailable. Supplies were brought in from other NZ centers, but delivery was hampered during the initial responses due to damage to road, rail, and docking facilities at the Christchurch port. Civil authorities arranged emergency food drops to welfare centers. Overall, initial press stories of food shortages were exaggerated. To date, food supplies have returned to “normal,” and three supermarkets in key suburbs that were destroyed are being rebuilt; however, access to other supermarkets are complicated due to road closures, density, and reconstruction projects.Reference McColl28
Energy for Communications, Heating, and Cooling
Within the Christchurch Hospital, communication during the earthquakes was unavailable and staff were unable to contact their families. Cell phones were not working for some time due to the overloading of and loss of power supply to some communications towers. Once restored, texting became easier than calling. In general, traditional landline telephones worked well throughout the community.Reference McColl28
With the coming winter months, there was great concern that the lack of heating in homes would affect those most vulnerable owing to age and chronic illness. Several patients were sent by ambulance to hospitals to be kept warm. Currently, the emergency program to replace 10 000 homes with replacement wood- and gas-fueled burners and with electric heat pumps and air conditioning for the coming months has been completed.Reference McColl2831
Population Migration
Studies have shown that 6400 people changed their mailing addresses between September 2010 and July 2011; the numbers do not reflect those who changed their addresses within the region. A June 14, 2011, online, unscientific newspaper poll of 15 089 voters taken one day after the magnitude 5.5 and 6.3 earthquakes found that nearly 18.7% said they were planning to leave Christchurch. Another 3.4% of voters said they were prepared to walk away from their properties, while 25.7% reported that they would leave if they could but were tied by property or job. The remaining 36.8% did not want to leave the city, and 15.4% did not know what to do. Mental health and governmental experts suggested that a mass exodus was not likely.Reference Cooke33Reference Sachdeva34 However, there is concern that “professionals” will leave when they find employment in their career field.
THE EMERGENCE OF A NEW NORMAL
Reflecting on Resilience
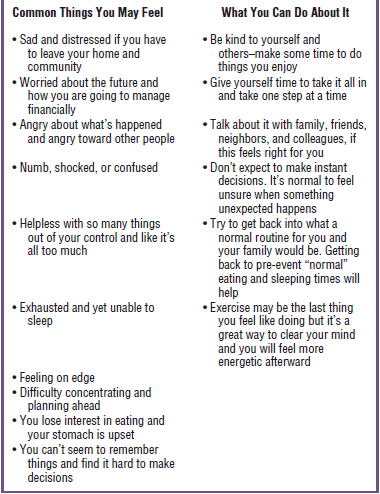
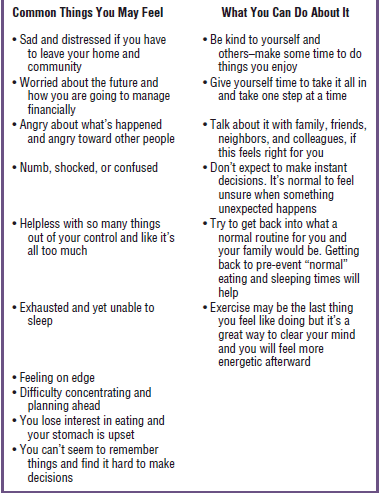
People gathering, especially in neighborhoods, to talk, support, and gain strength from one another seems to be the greatest need for many. After the earthquakes, there are “far more gatherings to share meals and just talk,” and when people are conducting business, people usually inquire, “How are you?” and “How is your home?”Reference McColl28 Organized campaigns and advice on Web sites and at primary health care sites have been initiated, advising people to talk to their partners, check on their neighbors, and provide routines for their children. Communication and information have been essential, whether formally received or informally imparted, such as knowing how to provide and accept from people you did not know before the disaster.Reference van Beyen27 Early on, the public press and media described “Christchurch people as stoic and would regroup”35; adding, “It is a fairly staid sort of place, the people are not prone to bouts of flamboyant expression but they are genuine, which can be quite refreshing.”36 The concern about stress has been pervasive among health care providers, and pamphlets (Table 3) were generated to guide the population to cope effectively.37
Canterbury District Health Board: Recovering and Looking to the Future37
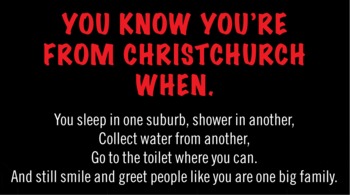
In addition, the use of dark humor, which surfaces regularly after major crises, especially war, was helpful, as it was used not only to educate and reassure (Figure 3) but also to illustrate the dry but effective sense of humor normally evident in the population. Yet, it was noticeable from comments heard on the radio and in conversations that resiliency was wearing thin. Emergency managers and others described how difficult resiliency was to achieve during the protracted disaster. Many reflected about all the discomforts to daily life that nine months of earthquakes; damage to properties, houses, and essential infrastructure; and the loss of jobs and prized possessions have brought. By April 2011, people outside of Christchurch were describing “earthquake fatigue” and were critical of the domination of the news on earthquake-related events. One woman declared “Don't you realize the rest of the country has moved on?” Christchurch residents, on the other hand, found this attitude harsh, although curious. “People here are exhausted and stressed, and simply trying to function is a full-time job for many. Running on adrenalin for two months is not healthy for anyone, couple that with a feeling of despair as to whether there's any coherent plan or future for the city you live in and the result is tension.”Reference Anderson1 Emerging as one of the most contentious issues is that insurance claims, which number more than 100 000, have been frustratingly slow in being processed. For the future, this could mean that costs of rebuilding may be so expensive as to be in doubt and even unavailable.Reference Van Den Bergh38 How resilience can be improved in such circumstances is a major concern.Reference van Beyen27
Example of Humor Following a Crisis.
Reprinted with permission from Raines B. You Know You're From Christchurch When…. Glenfield, Auckland, New Zealand: Harper Collins Publishers; 2011:12.

The “Pause” in the Traditional Disaster Cycle
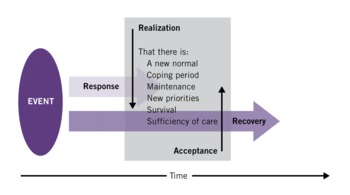
In New Zealand and Australia, comprehensive management planning has been based on a four-phase cycle: reduction (mitigation in Australia), readiness (preparedness in Australia), response, and recovery. A pause in the disaster cycle (response to recovery) was first witnessed toward the end of the response phase, as it finally blended into recovery (Figure 4). This pause represented the period of general awareness and realization—especially by emergency managers, but also increasingly among the population as a whole— that a change in the response phase has occurred. In fact, the pause was an active process that could be interpreted as response efforts that were slowing down, accelerating, and slowing down again. Once this shift back and forth within the response-to-recovery period settled down, the new normal state became evident. In Christchurch, the pause was worsened by the unique and unrelenting sequences of aftershocks and by the bureaucratic process of zoning and rezoning of land damage.
The pause process occurs between the response and recovery phases of the comprehensive emergency management cycle.

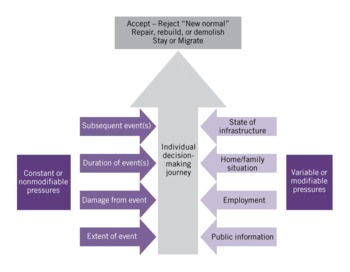
The realization of this new normal occurred after the initial rush of the response phase was reduced and people found time and space for reflection. Factors influencing the length of the pause period and acceptance of the new normal were size of the event, duration of the event, and existence of further events.
The key elements of the pause phase process for the Christchurch community are as follows:
• A new normal: What was normal in life before is not present now and will not be for some time, or ever. For example, one's primary health provider is located in a different, often distant, part of the city; people are unable to shop for food in their former supermarkets and shops; the use of utilities such as water, sewerage, and power is limited.
• Coping period: Learning to cope with changed circumstances. For example, elective nonessential surgery/treatment is postponed; living quarters are shared with extended families and elderly parents; longer distances and greater time are needed to reach destinations within an affected area; queuing is necessary to obtain goods and services; patience and understanding are required to cope with these changes.
• Maintenance: Facilities and services require maintenance to keep functioning while awaiting major repair. For example, roads and water supply are patched together to allow limited but essential use to occur; delays and barriers are put in place by insurance and finance companies.
• New priorities: What is now essential for daily living has changed. For example, long hours at work become part of or accepted behavior and beliefs; family, friends, and community are recognized as more important than previously appreciated.
• Survival: A sense of survival and spirit is realized. For example, questions and answers for oneself, family, friends, and community are focused on what needs to be done to get through and move forward.
• Sufficiency of care: Decisions are needed to determine what can be done with facilities and resources that exist now. For example, basic health care services provided in the initial response phase may need to be accepted as sufficient for an unknown duration. Acceptance that extended calls for outside assistance, which are known to weaken health care in other regions, needs to end. An altered standard of care must be planned for the affected region, as it may be a prolonged and lengthy period before health services are restored to the predisaster standard of care.
This realization of a new normal must be accepted by individuals, the community, and local and national leadership. Without such acceptance, the move to eventual recovery, to whatever standard that remains, will be delayed or not achieved. The decision to accept or reject the new normal framework is depicted in Figure 5.
The process by which an individual accepts or rejects the new normal state.

COMMENT
The concept of a new postdisaster normal is not unique to disaster planners and managers.Reference Greer3940 However, discourse and debate on the subject emphasize the importance to local communities “defining” what the new postdisaster normal will be. To accomplish this task, the communications strategies between local citizens and community leadership need to build awareness, understanding, evaluation schemes, and implications of the new normal and, in the process, acquire community commitment. Whereas recovery is often defined in phases or timeframes, timeframes should not define recovery, especially long-term recovery.41
Many of the studies on earthquake recovery, particularly on the major elements of shelter and land damage rehabilitation, are found in the civil engineering and construction management literature.Reference Bolin42Reference Kamel43Reference Comerio44 Using Hurricane Katrina as their study framework, Levine and colleagues confirmed that because the emergency management model presumes that recovery quickly follows response, governments focus only on short-term, localized displacement. However, long-term and long-distance displacement exposes a “gray area between immediate shelter and permanent housing, along with concerns about vulnerability, housing availability, and land development.”Reference Levine, Esnard and Sapat45 The authors emphasize that future research needs to increase planners' understanding of the transitional phase between response and recovery. In particular, areas of research include the unique aspects of social vulnerability and displacement; provision of temporary housing; household decisions to return home; and disaster-driven land development and housing construction processes that universally become complex and, unfortunately, destabilizing factors for final recovery.
The new normal state defines and exposes the realistic yet new phase in which these issues become operationally dominate. Any community will be dealing with survivors who have lost everything and those who have lost little or nothing. How each views the recovery process, the attention they get, and the defining of the new will differ. Additional research supports this viewpoint in suggesting that people who have experienced a similar situation but escape damage because of chance will make decisions consistent with a perception that the situation is less risky than those who have not had that experience. People “appear to mistake such good fortune as an indicator of resiliency” and further risk alienating others who are not as fortunate.Reference Dillon, Tinsley and Cronin46
While this case study looks at the evolution of a new normal among postdisaster survivors, it does not necessarily imply that the new normal state translates into loss of quality of life. Esnard asserts that the concept of quality of life has broad appeal to a variety of professions and disciplines, with increasing centrality to local sustainability. Her research highlights the negative impact of disasters on quality of life in communities, which are defined as encompassing small neighborhoods to regions, and concludes that quality of life can serve as the guiding principle for sustainable redevelopment, given its centrality to other ongoing community planning and development initiatives and goals.Reference Esnard47
The Katrina Pain Index, maintained by the Center for Constitutional Rights at Loyola University in New Orleans, looks at the impact on the elderly, renters, people of color, the disabled, and the working and nonworking poor in posthurricane New Orleans.Reference Quigley48 The direct impact was massive, but, unlike the series of earthquakes that hit Christchurch, the direct impact was not sustained. After Katrina, the problems long term were indirect consequences; these served to remind planners and managers of the importance of monitoring all indices (both direct and indirect) long term, especially in large impact crises. An August 2010 Index report revealed that, in spite of the rise in overall median income, the street-level perspective five years after the hurricane is that large numbers of the poorest people have not been able to return, including thousands of elderly and disabled persons. Although New Orleans lost at least 100 000 people from its population, affordable housing is still not readily available, and tens of thousands are paying rent that is out of proportion to their wages. The Index initially predicted that it would take 25-30 years before the city would return to its predisaster state.Reference Quigley48 Whereas these challenges faced by New Orleans are common to many across the United States, the Katrina disaster has made challenges greater and more visible than in other places. More than one in four residential addresses are vacant, the highest rate in the United States. Although circumstances have improved during the past year, 50 100 residential properties remain blighted or have no structure on them; more than 5000 families are on the waiting list for public housing and another 28 960 families are on the waiting list for housing vouchers, which is more than double what it was before the hurricane. Almost 20 000 applications for rebuilding homes have not received funding; job opportunities are down 16%; public school student enrollment has declined by 43%; and violent crime has risen since Katrina and remains well above national averages.Reference Quigley48 Clearly, vulnerable populations remain casualties from large-scale crises for a prolonged period of time, indicating that more than economic indicators must be transparently followed long term. The Katrina Pain Index in many ways functions as the “conscience” to the otherwise impersonal process that recovery can be. A new normal has existed in New Orleans for several years now but that awareness may be resisted or not realized.
Posthurricane Katrina, the resiliency and recovery in New Orleans reflect on the progress achieved throughout communities, but also stimulate discussion concerning strategies for using recovery as an opportunity to build long-term capacity and resiliency. Many nongovernmental agencies were involved in the post-Katrina recovery and, in many ways, filled in the gaps that were not being addressed by federal agencies. These agencies attempted to create a model of sustainable recovery, building community capacity, sustaining affordability, ensuring quality of life, and improving community resilience with strategic partnerships, investments, and best practices.
CONCLUSIONS
Reducing disaster losses and restoring the life of communities are essential to any meaningful definition of sustainability. The capacity to speed recovery by taking action in advance to identify and reduce vulnerabilities is known as resilience. Whereas this mindset drives the response-to-recovery process, planners must be cognizant of what elements are behind the pause, if and when it occurs. It is crucial that support and coordination are not lost or become splintered during the pause. In prolonged and unrelenting crises, whether they are caused by war, earthquakes, or other weather-related and major geophysical disasters, the new normal state is an expected outcome. The educational and training aspects of these crises must merge with the new normal. In recent years, societies have come to accept that among disasters and other crises, a new normal is constantly evolving, especially as volatility of crises and risk exposure escalate. When repeated damage occurs over an extended period, it is important to expect more pauses in recovery and integrate the new normal into the planning and decision-making process. Summarizing an address on September 2, 2011, Jarg Pettinga, MSc, PhD, Department of Geological Sciences, Canterbury University, reflected on the 5.0 magnitude earthquake that occurred that very morning, at 3:30 AM, stating, “This is not finished yet.”Reference Pettinga49