


How does the victimization of civilians affect their support for combatants during wartime? Are the effects of violence on attitudes uniform across warring parties, or are they conditional on who inflicted the harm? Civilians, existing accounts tacitly assume, are simply guided by a logic of survival that denies them the luxury of taking into consideration prior ethnic or ideological attachments. This seemingly eliminates the need to study wartime attitudes.
We challenge this view by arguing that the effects of violence on civilian attitudes are conditional on combatant identity (Lyall Reference Lyall2010). We contend that intergroup bias—the systematic tendency to interpret the actions of one's own in-group in a more favorable light than those of the out-group—should produce robust and observable asymmetries in how combatant actions affect civilian attitudes. Simply put, it is likely that harm by one's own group carries a different set of implications and effects than victimization by members of an out-group. We anticipate that in-group harm does not lead to either increased support for the out-group or to significant loss of support for in-group combatants. Harm by the out-group, however, is likely to increase out-group antipathy while heightening support for in-group combatants.
To test this argument, we conducted a survey in the very heart of the current Taliban insurgency (Barfield Reference Barfield2010; Crews and Tarzi Reference Crews and Tarzi2008; Giustozzi Reference Giustozzi2008; Jones Reference Jones2009) that utilizes multiple endorsement experiments to measure civilian attitudes toward the Taliban and the International Security Assistance Force (ISAF) in Afghanistan. We combine a multistage sampling design with multilevel statistical modeling (Bullock, Imai, and Shapiro Reference Bullock, Imai and Shapiro2011) to examine attitudes among 2,754 male respondents in 204 villages within 21 districts of five Pashtun-dominated provinces.
Three main findings emerge. First, there is clear evidence that victimization by ISAF and the Taliban has asymmetrical effects on individual attitudes. Harm inflicted by ISAF is met with reduced support for ISAF and increased support for the Taliban. In contrast, Taliban-inflicted harm does not translate into greater support for ISAF and has only a marginally negative effect on Taliban support. Second, subsequent efforts by each combatant to mitigate the effects of the harm they caused among aggrieved individuals actually appear to be successful, though in ISAF's case this finding rests on a small subset of selected individuals given ISAF's haphazard approach to responding to civilian casualties.Footnote 1 Third, we find little support for alternative explanations that privilege prior patterns of violence, the current distribution of territorial control by the combatants, or the role of economic assistance in determining civilian attitudes. Taken together, these findings illustrate the need to broaden our theories to consider the psychological mechanisms that drive civilian behavior in wartime.
THEORY AND HYPOTHESES
Motivation: Rational Peasants, Civilian Agency, and Wartime Attitudes
A near consensus now exists among practitioners around the notion that counterinsurgency wars are decided by the relative success each combatant enjoys in winning popular support from the civilian population (Kilcullen Reference Kilcullen2009; Mao Reference Mao1961; Thompson Reference Thompson1966; Trinquier Reference Trinquier2006; U.S. Army 2007). From the counterinsurgent's perspective, victory is obtained through a combination of service provision, material assistance, information campaigns, and, above all, restraint on the use of one's force with the goal of minimizing civilian casualties. From the Vietnam-era Hamlet Evaluation System (HES) to contemporary efforts in Iraq and Afghanistan, winning the “hearts and minds” of the civilian population, or at least an important subset of it, is a central element of counterinsurgency campaigns.
Surprisingly, however, there are few rigorous empirical studies of civilian attitudes toward combatants during wartime (see Beath, Christia, and Enikolopov Reference Beath, Christia and Enikolopov2011, for an exception). To be sure, this gap is due in part to the logistical and ethical issues that accompany survey research in a wartime setting. Even if surveys could be conducted safely, methodological issues abound: social desirability bias, high refusal rates, and preference falsification may frustrate efforts to obtain reliable answers, especially if sensitive issues such as support for combatants are investigated using direct questions (e.g., Berinsky Reference Berinsky2004; DeMaio Reference DeMaio1984). As a result, one leading scholar has argued we should “bracket [the] question of individual motives and attitudes” (Kalyvas Reference Kalyvas2006, 101) in favor of theories that emphasize the more easily observable structure of opportunities and constraints facing civilians in wartime (see also Leites and Wolf Reference Leites and Wolf1970, 45).
Indeed, the prevailing view of civilians in the civil war literature suggests they are “rational peasants” (Popkin Reference Popkin1979), that is, utility-maximizing agents driven by the short-term dictates of survival. Without strong ethnic or ideological attachments, civilians seek to minimize their exposure to harm from the combatants while maximizing the benefits offered by combatants, including material assistance and basic security. Based on this consensus, our theories concentrated on explaining which factors drive civilian behavior: the relative balance of control exercised by combatants (Kalyvas Reference Kalyvas2006; Kalyvas and Kocher Reference Kalyvas and Kocher2007; Leites and Wolf Reference Leites and Wolf1970), competitive service provision (Akerlof and Yellen Reference Akerlof, Yellen, Aaron, Mann and Timothy1994; Berman, Shapiro, and Felter Reference Berman, Shapiro and Felter2011; Crost and Johnston Reference Crost and Johnston2010), and relative levels of civilian victimization (Condra and Shapiro Reference Condra and Shapiro2012; Kocher, Pepinsky, and Kalyvas Reference Kocher, Pepinsky and Kalyvas2011; Stoll Reference Stoll1993), to name only three. Prior allegiances, if present at all, are thought to be easily recast in the face of a given mixture of (threatened) punishments and (promised) rewards levied by combatants who aim to exercise control over the civilian population.
Despite privileging different independent variables, these theories converge on the same empirical prediction: civilians should respond symmetrically to combatant actions. Put differently, civilians should be indifferent to which combatant provides material assistance (Berman, Shapiro, and Felter Reference Berman, Shapiro and Felter2011, 776; Collier and Hoeffler Reference Collier and Hoeffler2004, 569; Mampilly Reference Mampilly2011, 54–5) or victimizes them (Condra and Shapiro Reference Condra and Shapiro2012, 183–4; Kalyvas Reference Kalyvas2006, 111–19; Stoll Reference Stoll1993, 20). What matters is the type and amount of aid or violence, not which combatant is responsible for these actions, since civilians cannot afford to discriminate when their survival is at stake. We would therefore expect civilians to respond uniformly to similar assistance provided by foreign and domestic nongovernmental organizations, for example. Similarly, these theories predict that civilians will provide information to each side equally and routinely, with the choice of which combatant to inform dictated only by prevailing levels of control or violence.
Yet the empirical findings in these studies are often inconsistent with this baseline expectation of constant causal effects across combatants. The effects of aid programs on violence reduction in Afghanistan, for example, appear to hinge on the ethnic composition of a district, not the level of control or prior violence (Beath, Christia, and Enikolopov Reference Beath, Christia and Enikolopov2011). Similarly, small-scale aid programs in Iraq have heterogeneous effects across Sunni and non-Sunni dominated districts (Berman, Shapiro, and Felter Reference Berman, Shapiro and Felter2011). In addition, Condra and Shapiro (Reference Condra and Shapiro2012)’s findings suggest that Sunni districts exhibit markedly different pre- and postcivilian casualty patterns of violence than Shia or mixed districts. In each case, it appears that civilians are responding asymmetrically, rather than uniformly, to combatants. If responses are conditional on combatant identities, then we need to theorize how heterogeneity in the effects of aid and violence—variation in who is rewarding or punishing civilians—affects attitudes and subsequent behavior asymmetrically.
Second, these theories rely on indicators of civilian behavior that are observationally equivalent with multiple causal mechanisms. As a result, we are left unable to adjudicate between competing accounts or, more simply, to explain why a particular relationship exists. Kalyvas (Reference Kalyvas2006) acknowledges, for example, his central independent variable, the relative distribution of combatant control, generates its effects via at least six different mechanisms, three of them attitudinal in nature (124–32). Observational data cannot tease apart these different mechanisms; only by directly measuring attitudes can the relative influence of each mechanism be determined.Footnote 2 Getting the mechanisms right also has important policy implications: it matters whether civilians are providing tips to insurgents because they fear punishment for noncooperation or if they genuinely support the rebel cause since the policy response is likely to be different even if rebel control is constant in these scenarios.
Why Identity Matters: Intergroup Bias and Support for Combatants
We argue that wartime attitudes are shaped by intergroup biases that create durable expectations about the responsibility and blame for combatant actions toward the civilian population. These biases lead civilians to condition their interpretation of events on the perpetrator's identity (Lyall Reference Lyall2010). As a result, we expect that support for combatants will depend on the combatant's identity, as will the effects of actions taken by the combatants.
We define intergroup bias as the systematic tendency by individuals to evaluate one's own membership group (the “in-group”) more favorably than a group one does not belong to (the “out-group”) (Hewstone, Rubin, and Willis Reference Hewstone, Rubin and Willis2002, 576; Tajfel Reference Tajfel1970; Tajfel and Turner Reference Tajfel, Turner, Austin and Worchel1979).Footnote 3 Positive actions by one's own in-group are therefore viewed as arising from the innate disposition of in-group members while similar actions by the out-group are interpreted as situational in nature: the out-group was compelled by the situation to undertake a positive act, whereas the in-group did so because of its inherent nature. Negative actions by an in-group, by contrast, are understood as situational in nature (“forced to be bad”), while negative actions by the out-group confirm biases about the out-group and its members as bad actors.
Laboratory experiments have shown that intergroup bias is especially prevalent in situations where the out-group possesses a significant power advantage and members of the in-group feel threatened by the out-group (Brewer Reference Brewer1999; Esses et al. Reference Esses, Dovidio, Jackson and Armstrong2001; Hewstone, Rubin and Willis Reference Hewstone, Rubin and Willis2002, 585–6). Such conditions characterize counterinsurgency wars, in which members of a group are challenging a much stronger out-group such as a national government or external occupier in a bid for independence, autonomy, or state capture.Footnote 4
One potential basis for in-group identification is ethnicity.Footnote 5 Ethnicity can perform two functions under wartime conditions. First, it acts as a shorthand or “social radar” (Hale Reference Hale2008, 34) that allows forward-looking individuals to anticipate the nature of in- and out-group actions based on prior interactions or information about ethnic types. In particular, ethnicity can convey information about often unobservable characteristics about other relevant actors like soldiers and rebels, such as the credibility of their threats and assurances for (non)compliance. Biases about (non)coethnics can thus be drawn on to facilitate wartime risk management by allowing individuals to quickly attach probabilities, if only crudely, to the expected (re)actions of combatants (Lyall Reference Lyall2010, 15).
Second, and central to our argument, group membership also moderates beliefs about responsibility and blame for past actions toward the individual and her group. Viewed through the lens of intergroup bias, individuals are more likely to punish out-groups for transgressions, simply confirming biases about the out-group's disposition. Harm inflicted by the in-group, however, carries a different meaning: victimized individuals, and the community at large, may be more forgiving, since such acts are justified by appeal to extenuating circumstances that forced the in-group's hand. This bias helps explain why external occupiers are often blamed by victimized individuals for harm that was actually inflicted by the rebels themselves.
This discussion generates several conditional hypotheses, which are characterized by two types of asymmetry. Table 1 summarizes these hypotheses. First, we anticipate that harm inflicted by the out-group will be associated with a sharply negative effect on civilian attitudes toward the out-group (Hypothesis 1) and a correspondingly large rally effect for insurgents drawn from the in-group (Hypothesis 2). Taking Hypotheses 1 and 2 together, we should observe a clear asymmetry of effect on attitudes that is conditional on the joint identities of the perpetrator and victim(s).
Home Team Discount: The Asymmetry of Combatant Support in Civil War

Second, the in-group's victimization of civilians will not result in a transfer of support to the out-group (Hypothesis 3) but will instead generate only a neutral effect on out-group support. We may observe a modest negative effect on in-group support (Hypothesis 4), though this should be substantially smaller than the negative effect on out-group support after civilian victimization. Here we observe a second, more subtle, asymmetry: Unlike out-group victimization, which leads to support for the in-group, in-group victimization does not lead to a corresponding increase for the out-group. We term this the “home team discount”: insurgents may be less constrained in their abuse of their fellow in-group members since such actions do not lead to a corresponding positive effect on support for the out-group.Footnote 6
We also hypothesize that as we move from an individual's direct experience with the combatants to indirect experiences shared by other in-group members, the effects of victimization on combatant support should attenuate. Put differently, the magnitude of the action's effect, but not its direction, should diminish as we move from direct experiences to indirect ones provided by secondhand accounts, combatant propaganda, or rumors (Hypothesis 5).
Simply put, we anticipate that the effects of combatant violence on civilian attitudes are asymmetrical, not uniform. Violence by the out-group toward civilians should have negative effects on support for that group (in many contexts the counterinsurgent or national government) while having a positive effect on support for the in-group. In-group violence, by contrast, should result in only a modest negative effect on in-group support (if any effect is recorded) and should not yield a transfer of support to the out-group.
THE SURVEY
We adopt a survey methodology that employs a battery of indirect endorsement experiments to measure attitudes. Endorsement experiments are especially apt for environments such as Afghanistan, where concerns about safety, social desirability bias, and nonrandom refusals to participate are present in spades (Blair et al. Reference Blair, Fair, Malhotra and Shapiro2013; Bullock, Imai and Shapiro Reference Bullock, Imai and Shapiro2011). In addition, there are Afghanistan-specific reasons for concern. First, ISAF, along with other organizations, have spent billions of dollars over the past decade seeking to win “hearts and minds.” This situation creates and reinforces incentives to provide answers perceived to be acceptable to ISAF, especially if individuals believe future receipt of aid is conditional on current responses. Moreover, for cultural reasons individuals are typically surveyed in public settings. We recorded an average of two additional individuals present at each survey session, excluding the respondent and enumerator.Footnote 7 Finally, our survey firm negotiated access to villages with local elders, arbaki (militia) commanders, and Taliban leaders. In such situations, indirect questions are preferable because they yield a higher rate of acceptance among these gatekeepers, thus avoiding biases in the choice of interview locations.
The Endorsement Experiment
The mechanics of a survey endorsement experiment are straightforward. Randomly selected respondents are assigned to a treatment group and asked to express their opinion toward a policy endorsed by a specific actor whose support level we wish to measure (here, ISAF and the Taliban). These responses are then contrasted with those from a control group of respondents that answered an identical question without the endorsement. Higher levels of enthusiasm for a policy with an endorsement relative to those without it are viewed as evidence of support for the endorsing actor. Since each respondent is assigned only one condition for any endorsement experiment, it is impossible for enumerators or others to compare support levels across different conditions for any individual respondent.
Drawing on electronic and print media, as well as focus groups and two pretest surveys conducted in sampled districts, we identified four policies with the properties desired for an endorsement experiment. Successful endorsement experiments share four properties (Bullock, Imai, and Shapiro Reference Bullock, Imai and Shapiro2011). First, selected initiatives should be in the same policy space so that they can be combined for statistical analysis. We select policies that are all related to domestic policy reforms: prison reform, direct election of district councils, a reform of the Independent Election Committee, and the strengthening of anticorruption policies. Second, these initiatives should be well known by individuals to minimize “Don't Know” responses and to differentiate support for an endorser from learning about a policy from the endorsement itself. In the survey, only 4.8% of respondents replied “Don't Know,” while refusal rates were low in all provinces. Third, these initiatives should actually be endorsed by the particular actors in question so that the questions are realistic and respondents take them seriously (Barabas and Jerit Reference Barabas and Jennifer2010).Footnote 8 Finally, a wide range of views was held by the general public about these initiatives, enabling us to detect support for endorsers without suffering from ceiling and floor effects.
Here, we reproduce one endorsement question, calling for reform of Afghanistan's notoriously corrupt prison system, below. The text of the remaining questions is provided in the Appendix.
• Control Condition: A recent proposal calls for the sweeping reform of the Afghan prison system, including the construction of new prisons in every district to help alleviate overcrowding in existing facilities. Though expensive, new programs for inmates would also be offered, and new judges and prosecutors would be trained. How do you feel about this proposal?
• Treatment Condition: A recent proposal by the Taliban [or foreign forces] calls for the sweeping reform of the Afghan prison system, including the construction of new prisons in every district to help alleviate overcrowding in existing facilities. Though expensive, new programs for inmates would also be offered, and new judges and prosecutors would be trained. How do you feel about this proposal?
Plagued by allegations of widespread overcrowding and systematic torture, among other human rights abuses (Human Rights First 2011), the Afghan prison system has been publicly criticized by ISAF, the Taliban, and outside observers alike. When polled, only 48% of Afghans claim to place any faith in the Afghan prison system (The Asia Foundation 2010). As a result, both ISAF and the Taliban have at various occasions offered remarkably similar reform programs (Nixon Reference Nixon2011; International Crisis Group 2008).Footnote 9
We also asked whether individuals would support a proposal to allow Afghans to vote in direct elections when selecting leaders for district councils. While technically permitted under Afghanistan's 2004 Electoral Law, these elections have not been held to date. In early 2010, the Independent Directorate for Local Governance (IDLG)—a government agency led by a presidential appointee that works with ISAF to coordinate subnational governance policies—publicly floated the idea of direct elections, to be held in March 2011 (they were not). Surprisingly, the Taliban seized upon this idea in their own propaganda, suggesting that Karzai's claims of being democratically elected were hollow since the Electoral Law was not being followed (Nixon Reference Nixon2011).
Third, we gauged support for reform of Afghanistan's Independent Election Committee (IEC), a much-maligned institution that failed to prevent widespread fraud in the 2009 Presidential and 2010 Parliamentary elections. The Afghan public has also soured on the IEC; only 54% approved of its performance in 2010 (The Asia Foundation 2010). ISAF and various international organizations spent much of the post-September 2010 election period publicly discussing various reform proposals. Even the Taliban, which had sought to derail these elections through violence, raised the IEC as additional evidence of the Karzai administration's democracy deficit (Nixon Reference Nixon2011).
Our final question asked whether individuals would support strengthening the new Office of Oversight for Anti-Corruption. Alongside security concerns, there is perhaps no more salient issue in the minds of Afghans today than corruption; a full 76% rated it a “major problem” in 2010, ranking it among the top two domestic concerns of individuals (The Asia Foundation 2010). Both ISAF and the Taliban are aware of the issue's salience; each has issued repeated public statements concerning corruption in general and the need to strengthen existing institutions, including the Office of Oversight, in particular (Konrad-Adenauer-Stiftung, Royal United Services Institute and Transparency International UK 2011; Office of the Special Inspector General for Afghanistan Reconstruction 2009).
For all four endorsement questions, respondents were asked to assess their level of support for each proposal on a five-point scale: “I strongly agree with this proposal”; “I somewhat agree with this proposal”; “I am indifferent to this proposal”; “I disagree with this proposal”; and “I strongly disagree with this proposal.” Respondents were also permitted to answer “Don't Know” or “Refuse to Answer.”
Figure 1 displays the overall (top row) and provincial distributions of responses to the four endorsement questions. Three patterns are worth noting. First, there is substantial heterogeneity of interprovince support for these policies, even independent of particular endorsements. This is encouraging since it suggests that the questions, taken separately or together, possess strong discriminatory power. Compare higher support for prison reform in Logar, for example, with Khost, or anticorruption efforts in Logar with Helmand. Second, support differs substantially across Taliban and ISAF endorsements. In some provinces including the Taliban stronghold of Helmand or the warlord-controlled Uruzgan, support for Taliban endorsed policies is far higher than ISAF endorsed policies. In fewer cases, notably in the key battleground province of Kunar, ISAF endorsement translates into higher support for at least two proposals. To further validate whether the endorsement experiments are measuring the support for the Taliban and ISAF, the Appendix presents a detailed descriptive analysis, which argues that the patterns we observe across provinces and districts are consistent with conditions in each province at the time of the survey.
Overall and Within-Province Distribution of Responses from the Endorsement Experiments
Notes: Plots depict the distribution of responses to four policy questions (columns) across three groups (Taliban/ISAF endorsement groups and control group) for the overall sample (top row) and each province (bottom five rows). Sample sizes are also shown.
Sampling Design and Target Population
Our survey experiment was conducted between 18 January and 3 February 2011 in five provinces of Afghanistan.Footnote 10 We chose to concentrate on Pashtun-majority areas rather than a nationwide sample for three reasons. First, estimation at the village and district level requires a sufficient number of individual respondents and selected villages, respectively, making a nationwide sample prohibitively expensive if we scaled up with the same level of coverage. Second, these areas are not only substantively important—they encompass the Taliban “heartland,” and are considered the battleground provinces of the Afghan war—but are also areas where intergroup bias between Pashtuns and ISAF should be present. Third, these areas have experience with both ISAF- and Taliban-initiated violence. Indeed, they represent the high end of the distribution of violence.
We devised a multistage sampling design to generate estimates of support for combatants at the individual, village, and district levels. First, five provinces—Helmand, Khost, Kunar, Logar, and Uruzgan—were randomly selected from the 13 Pashtun-majority provinces.Footnote 11 Next, we randomly selected one-third of each province's districts for a total of 21 selected districts. Third, villages were randomly sampled from these districts with the restriction that at least 10% of each district's villages had to be selected, yielding 204 villages. Households were then chosen within these villages using the random walk method. Finally, male respondents aged 16 years and older were randomly selected from these households using a Kish grid. We surveyed nine respondents from villages with populations below the mean of sampled villages (about 680 individuals) and 18 in villages with above-mean populations. Table 2 summarizes our sampling design and the realized sample.
Overview of Multistage Sampling Design
Notes: The sampling design was conducted as follows: First, five provinces shown in this table were randomly sampled from a total of 13 provinces with a Pashtun majority. Second, districts were randomly chosen within these districts. Third, villages were then randomly sampled from within selected districts. Fourth, households were randomly selected within each of the selected villages. Finally, one male respondent 16 years or older was randomly sampled within each of the selected households. The table also displays the number of Taliban- and ISAF-initiated violent events during one year prior to the survey (from 18 January 18 2010 to 17 January 2011) inflicted at the provincial level.
We obtained an 89% participation rate (2,754 out of 3,097 attempts). Figure 2 presents the distributions of basic demographic variables for our sample of 2,754 respondents. Our average respondent was a 32-year-old Pashtun male who was likely married (77% answered yes), possibly employed (only 58% reported holding a job, with the most frequent occupation being “farmer”), and earning between US $1.40 and $6.97 a day. Respondents typically had little or no government-provided schooling, and on average had 18 months of madrassa religious schooling. In keeping with the high poverty rates of the sample area, respondents on average had less than 90 minutes of electricity a day. Less than half (48%) possessed cellphones, while nearly all (90%) owned a radio, the principal means of obtaining information. Ethnic minorities, mostly Tajiks, made up 6% of the respondents and had comparatively higher rates of education and employment.
Distribution of Demographic Characteristics
Notes: Bar plots indicate the number of respondents in each category for demographic variables. Dashed lines represent median values.
Since the vast majority of Afghans live in small rural settlements, we avoided sampling from large urban centers such as district capitals. Our villages thus range from 29 to 6509 inhabitants (mean: 681 individuals). We also made the difficult decision to include only male respondents given the cultural and logistical challenges of interviewing women in these violent and deeply conservative areas. Our protocol included a special consent form for those aged 16–18 years. We elected to include these individuals since Afghanistan's median age is only 18, a fact typically overlooked by existing surveys of public opinion.
Of the original 204 villages, only four proved inaccessible due to a combination of Taliban hostility, the presence of criminal elements and, in two cases, the inability of the enumerators to locate the selected village.Footnote 12 In all cases, village elders, who may have been members of the Taliban, were first approached by ORCA district supervisors with the relevant connections to describe the survey and to receive assurances of enumerator safety. Despite our extraordinary level of access to Taliban-controlled areas, a testament to ORCA's connections as well as its decision to hire locals enumerators, we nonetheless experienced myriad delays and logistical challenges. These included movement restrictions due to open war-fighting (especially in Helmand); Taliban and militia roadblocks (typically appearing after 2 p.m. in most of our districts); and attempted highway robbery. In one case, a clean-shaven enumerator was pulled from his car in Kunar where, along with other motorists, his face was blackened with motor oil by local Taliban to signify his “sinfulness.”Footnote 13 Our most serious incident involved a district manager in Uruzgan, who was wounded by a roadside improvised explosive device (IED) the day after placing the last bundle of completed surveys on a fruit truck (our method of returning surveys to Kabul).
Measuring Exposure to Violence
Table 2 outlines just how violent these provinces have been using two different datasets. The number of attacks initiated by the Taliban and ISAF from 18 January 2010 to 17 January 2011 was extracted from ISAF's Combined Information Data Network Exchange, which records the date, location, and type of event from 17 specific categories.Footnote 14 These data show that the sampled provinces have experienced variable levels of violence but, on average, are considerably more violent than other non-Pashtun provinces.
Figure 3 illustrates this pattern by overlaying the location of sampled villages (as black dots) on the distribution of Taliban and ISAF violence (as red dots) during 2010. Two spatial patterns emerge immediately. First, while some of our surveyed villages are within extremely violent areas, other sites experienced relatively few attacks nearby, giving rise to considerable heterogeneity in the level and type of harm experienced by respondents. Second, we overlay the spatial distribution of relative control by combatants, as measured by ISAF, at the district level. Nine of the 21 districts are defined as under Taliban control (red areas), while another nine were coded as “contested” (green areas). Only three districts in our sample are thus considered under central government or pro-ISAF local control (blue areas). These data underscore both the difficulties of research in these areas as well as the fact that, for nearly all respondents, experience with harm at the hands of ISAF or the Taliban (or both) is not an abstract notion but a realistic possibility—and, for many, a reality. In the Appendix, we demonstrate that though these provinces are more violent than non-Pashtun provinces, the sampled villages exhibit violence levels similar to nonsampled villages in these districts. We also show that sampled villages are similar to nonsampled villages on other substantively important dimensions. As expected with multistage sampling, in-sample balance at the district and province level is slightly worse, given the small samples of districts (21) and provinces (5).
Sampled Villages
Notes: Black dots represent randomly sampled villages within five Pashtun-dominated provinces. Red dots represent Taliban- or ISAF-initiated violence in 2010. Three colors are used to distinguish Taliban-controlled (red), government-controlled (blue), or contested (green) districts.
We measure our central explanatory variable, exposure to harm at the hands of ISAF or the Taliban, with several questions. We distinguish between two models of harm: direct exposure, in which an individual or his family are directly affected in the past year; and indirect exposure, in which individuals are asked about their awareness of ISAF- or Taliban-inflicted harm within their manteqa (area) over the same time period. These self-reports, elicited prior to the endorsement experiments, were preceded by a script that defined “harm” as both physical injury and property damage. These questions and detailed descriptive analyses appear in the Appendix.
Our respondents reported a staggering degree of exposure to ISAF and Taliban violence. Some 37% of respondents indicated that they had personally experienced victimization by ISAF, while a similar 33% acknowledged Taliban victimization (left corner plot in Figure 10(a) in the Appendix). About 19% of respondents reported that they had been victimized by both combatants. Nearly 70% of respondents had heard of ISAF harming civilians in their manteqa, while about 40% had similarly heard of Taliban-inflicted harm in their area over the past year (left corner plot in Figure 10(b)).
These self-reported measures were followed by questions about whether the individual had directly experienced or was indirectly aware of the efforts by the responsible combatant to make amends for harm inflicted. These questions are designed to test whether intergroup biases are irretrievably fixed or, instead, there remains the possibility of softening, if only partially, these biases in a wartime setting. We are therefore able to classify individual experiences by exposure to harm (yes/no), by combatant, and whether the individuals were directly approached by the combatants following victimization or had heard of such efforts within their manteqa.
To be approached by ISAF signifies that an individual or family received a one-time solatia payment, typically around $2,500, that absolved ISAF of criminal liability for civilian casualties or property damage.Footnote 15 By contrast, to be approached by the Taliban signifies that the aggrieved party received a funeral oration by the Taliban extolling the virtues of the fallen individual(s) as well as modest monthly payments or basic staples such as kerosene or foodstuffs.
Yet can we rely on these self-reports, especially those obtained via direct questions? At least two objections might be raised. First, we may be concerned that questions of wartime harm are simply too sensitive to elicit truthful answers. This, too, was our initial concern, but one subsequently mitigated when enumerators reported that respondents, far from being reticent about sharing their experiences, were only too eager to describe them. In fact, the combined rate of “Don't Know” and “Refuse to Answer” for these questions was only 2% for Taliban and 1% for ISAF-inflicted harm questions.Footnote 16
Second, there may be endogeneity between the certain covariates—for example, the level of combatant control, or an individual's socioeconomic and cultural attributes—and survey responses. Individuals did report a much greater (second-hand) awareness of ISAF victimization than Taliban misdeeds, for example. This may suggest a greater willingness to speak openly about ISAF, especially in the Taliban-controlled districts that represent 43% of our sample. Coethnic bias itself may also skew these self-reports: Pashtuns could conceivably be more likely to report ISAF victimization than harm by the almost-exclusively Pashtun Taliban.
Without dismissing the dangers of endogeneity, there are reasons to believe such concerns may be muted. First, minimal nonresponse rates were recorded; respondents clearly were not hiding their answers behind appeals to “Don't Know” and “Refuse to Answer.” Second, almost identical levels of victimization were recorded at the hands of ISAF and the Taliban. Third, substantial variation exists within Taliban-controlled and contested districts (and villages), suggesting that a heavy Taliban presence does not necessarily dictate pro-Taliban answers. Fourth, the large discrepancy between indirect exposure to ISAF and Taliban victimization is likely due to the Taliban's own impressive and far-reaching information campaign. Unlike ISAF, the Taliban is adept at disseminating news of ISAF-inflicted civilian casualties (real or imagined) via cell phone videos and SMS as well as routine visits to villages. The efforts of ISAF lack the reach of those of the Taliban and remain largely confined to urban centers and traditional media.
Finally, to complement respondent self-reports, we calculated the number of attacks initiated by the Taliban and ISAF occurring in or near each village. To be consistent with our survey questions, we count only the attacks that occurred within a five kilometer radius of each village during one year prior to the survey. This event data offers an extraordinarily fine-grained measure of violence that can act as an important, if limited, alternative measure to our self-reported measures of exposure to harm. Intriguingly, we find little correlation between these individual self-reports and ISAF's own dataset of violent events. We constructed measures of violence using the number of Taliban and ISAF-initiated events during the year prior to the survey at different radii around these villages and found little correlation.Footnote 17 Moreover, there is almost no correlation between these self-reports and ISAF's own civilian casualty data. ISAF's data suggest that the Taliban are responsible for inflicting 89% of incidents involving the death or wounding of civilians in 2010 (or, by UNAMA's estimate, 83% of civilian deaths). By contrast, our self-report data reveal a much more even distribution of harm inflicted, with a slightly larger proportion of respondents reporting victimization at the hands of ISAF compared to the Taliban.
Several factors may account for this discrepancy. First, the two measures operationalize harm differently. ISAF's data focuses solely on deaths and wounded, while our self-reports measure both physical harm and property damage. The latter category, which ISAF does not collect systematically, is critical because it represents a far more frequent occurrence than the rare mass-casualty events that command media attention. Second, ISAF's coding rules for assigning responsibility for a particular event rely on objective indicators (e.g., if a Taliban-placed IED kills civilians, then the Taliban is assigned responsibility for the event) while the population may not be making the same calculation (e.g., ISAF is blamed for IED-conflicted casualties since ISAF's presence made the IED likely). Finally, these self-reports measure individual-level exposure, while ISAF's event data in present form can only be pegged to the village level. For these reasons, we believe that our self-reports offer a more comprehensive measure of harm inflicted than ISAF's own data.
STATISTICAL MODELING
Since all four endorsement experiment questions occupy the same policy space, we employ the methodology developed by Bullock, Imai, and Shapiro (Reference Bullock, Imai and Shapiro2011) to combine responses from the four endorsement experiment questions to uncover the underlying latent levels of support for each combatant. We exploit the multistage sampling design of our survey experiment and construct a multilevel model where each level directly corresponds to each stage of sampling. Under this model, for example, a village-level parameter is assumed to be randomly drawn from a distribution defined at the district level in which the village is situated. This corresponds to the sampling process, in which villages are randomly selected from the population of villages within each of the sampled districts. Our multilevel modeling approach is thus justified by the sampling design and allows us to estimate (via partial pooling) support levels of the Taliban and ISAF and their difference at all four levels—individuals, villages, districts, and provinces—providing a wealth of information about the distribution of support. Finally, our model can also accommodate predictors at each of the four levels including individual-level survey measures and village-level violence data.Footnote 18 The model also allows for spatial correlation at the village, district, and province levels through the introduction of random effects at each level.
We now formally define our statistical model. Let i index survey respondents in our sample (N = 2,754). In the endorsement experiment, each respondent is randomly assigned to one of the three conditions with equal probabilities: Taliban endorsement, ISAF endorsement, and no endorsement (control condition). We use Ti to denote this randomized “treatment” assignment, which takes one of the three values, i.e., 2 = Taliban, 1 = ISAF, and 0 = Control. Now, respondent i’s answer to the jth policy question is represented by Yij for j = 1, . . . , 4 and is recorded as the five-category ordinal response variable, 5 = Strongly agree, 4 = Agree, 3 = Indifferent, 2 = Disagree, and 1 = Strongly Disagree. Following Bullock, Imai, and Shapiro (Reference Bullock, Imai and Shapiro2011), we partially pool all policy questions in order to identify the common underlying pattern across all questions rather than idiosyncratic noise associated with a particular question.
First, the individual level is based on the ordered probit item response model:
 \begin{eqnarray*}
\Pr (Y_{ij} \le l \mid T_i = k) = \Phi (\alpha _{jl} - \beta _j (x_i + s_{ijk}))
\end{eqnarray*}
We model the two key latent parameters, xi and sijk, using the multilevel modeling strategy. Formally, the model is specified as follows:
\begin{eqnarray*}
x_i & \stackrel{\rm indep.}{\sim } & \mathcal {N}\left(\delta _{{\rm village}[i]} + Z_i^\top \delta ^Z,\ 1\right) \\
s_{ijk} & \stackrel{\rm indep.}{\sim } & \mathcal {N}\left(\lambda _{k,{\rm village}[i]} + Z_i^\top \lambda ^Z_k,\ \omega _{k,{\rm village}}^2\right) \\
\delta _{{\rm village}[i]} & \stackrel{\rm indep.}{\sim } & \mathcal {N}\left(\delta _{{\rm district}[i]} + V_{{\rm village}[i]}^\top \delta ^V,\ \sigma ^2_{\rm district}\right) \\
\lambda _{k,{\rm village}[i]} & \stackrel{\rm indep.}{\sim } & \mathcal {N}\left(\lambda _{k,{\rm district}[i]} + V_{{\rm village}[i]}^\top \lambda ^V_k,\ \omega _{k,{\rm district}}^2\right) \\
\delta _{{\rm district}[i]} & \stackrel{\rm indep.}{\sim } & \mathcal {N}\left(\delta _{{\rm province}[i]} + W_{{\rm district}[i]}^\top \lambda ^W_k,\ \sigma ^2_{\rm province}\right) \\
\lambda _{k,{\rm district}[i]} & \stackrel{\rm indep.}{\sim } & \mathcal {N}\left(\lambda _{k,{\rm province}[i]} + W_{{\rm district}[i]}^\top \lambda ^W_k,\ \omega _{k,{\rm province}}^2\right)
\end{eqnarray*}Specifically, we assume that each respondent is randomly drawn from a population distribution in his own village, each village is randomly drawn from a distribution of its district, and each district is randomly drawn from a distribution of its province. At each level, covariates can be incorporated and the normal distribution is used. We use Markov chain Monte Carlo to obtain random draws from the joint posterior distribution of relevant parameters. For each model fit, which is accomplished via JAGS (Plummer Reference Plummer2009), we monitor convergence by running three parallel chains with overdispersed starting values.
Finally, though the number of nonresponses is small, the pattern of missingness is not completely random. Thus, we impute these missing values as part of our model by assuming that the data are missing at random conditional on village and other covariates at individual and more aggregate levels. This mitigates the bias and inefficiency that typically result from list-wise deletion.
Model Specification
We fit two models: a direct exposure model that incorporates a respondent's (or his family's) direct exposure to harm and our key explanatory variables, and an indirect exposure model that draws on the same covariates, but substitutes direct exposure to harm for an individual's awareness of civilians being harmed within his larger manteqa. Both models include a common set of theoretically relevant variables (see the Appendix). At the individual level, we include a battery of socioeconomic and demographic covariates that have been cited as important determinants of support for terrorist or insurgent groups. These covariates include the respondent's age, marital status (Berrebi Reference Berrebi2007), income level, years of state, and madrassa education (Bueno de Mesquita Reference Bueno de Mesquita2005; Krueger and Maleckova Reference Krueger and Maleckova2003; United States Agency for International Development 2011b), ethnicity, whether the respondent is a Pashtun, and whether the tribe he affiliates himself with was deemed already pro-Taliban (Giustozzi Reference Giustozzi2008, 52–69).Footnote 20
The models also include village- and district-level covariates, which include the settlement's altitude to account for difficulty of state control (Fearon and Laitin Reference Fearon and Laitin2003), population size, and the number of ISAF- and Taliban-initiated violent events within five kilometers of the village's center one year prior to the survey's launch.Footnote 21 District-level covariates include total expenditures on ISAF Commander's Emergency Response Program (CERP) short-term aid projects in 2010 (ISAF CERP Data, 2005-10); the number of villages in a given district that had received NSP-run community development projects by the conclusion of 2010; a dummy variable that indicated whether the district was home to a Taliban-run sharia court system; the area in a given district under opium cultivation (in hectares) in 2010 (United Nations Office of Drug Control 2010, 112); the length of paved roads, a proxy for general economic development; a dummy variable indicating whether the district neighbored Pakistan, to control for cross-border flows of arms, insurgents, and funds; and ISAF's own measure of the control it exercised over a given district. We draw on ISAF's fourfold index of control, which which rates districts from “government control or dominant influence” to “local control or dominant influence” to “contested” to “Taliban control or dominant influence.” These ratings were assigned in September 2010, roughly four months before our survey was fielded.Footnote 22 ISAF- and Taliban-directed aid and service provision variables account for the possibly offsetting positive actions of combatants on the battlefield.Footnote 23
EMPIRICAL FINDINGS
We first examine the relationship between individual-level traits and attitudes before providing evidence of the asymmetric effects of violence on combatant support. We then add nuance to our discussion by examining how intra-Pashtun tribal heterogeneity, along with variation within the Taliban itself, also condition attitudes. Finally, we explore whether postharm mitigation efforts by ISAF and the Taliban are capable of overcoming intergroup bias in a wartime setting. Given our quantities of interest, we rely on graphs rather than coefficient tables to demonstrate our main empirical findings.Footnote 24
Main Results
Our multilevel models generate estimates of a respondent's level of support for the particular combatant; estimates are measured in terms of the (posterior) standard deviation of respondents’ preferences within a single dimensional policy space (i.e., ideal points). If a respondent is assigned to the control group, no estimate is generated. Imagine, for example that a respondent is neutral toward the proposed reform initiative. If this individual's support level for the Taliban was a “1,” then it implies that a Taliban endorsement can shift this individual's ideal point by one standard deviation in the proreform direction.
Attitudes Toward Combatants
Who is more likely to support the Taliban or ISAF? As an initial test of the validity of our survey instrument, we plot individual-level support estimates from the direct exposure model against key demographic covariates in Figure 4. We note that estimated support for both combatants decreases with age, though the Taliban enjoy more support among the youth than ISAF. This may be somewhat surprising given the Taliban's public image as a conservative gerontocracy, but the war has created opportunities for advancement among the youth, and the Taliban appears to be given credit for this mobility. Predictably, support for ISAF—or, more bluntly, decreased dislike for ISAF—is associated with increased education and with fewer years spent in madrassa education. The reverse is true for the Taliban: its estimated support levels rise with years of madrassa education and fall with years of government education. Finally, per capita income is positively associated with estimated ISAF support (or, again, less dislike of ISAF) while there appears to be no clear pattern between income and Taliban support.
Bivariate Relationships between Demographic Variables and Individual-level Support for the Taliban and ISAF
Notes: Support estimates are given in terms of the standard deviation of ideal points. For age (the left column), dots represent respondents and the lowess curve is fitted as a solid line. For remaining plots, box plots are used: the width of each box is proportional to (the square root of) the number of respondents for each value of the demographic variables.
Attitudes by Levels of Victimization
What are the average support levels for ISAF and the Taliban among those harmed by these combatants? As an initial investigation of the effects of victimization, we estimate the level of support for each combatant according to whether respondents reported harm by ISAF only, the Taliban only, by both combatants, or by neither (Figure 5).Footnote 25
Estimated Support Levels for Each Combatant by Victimization Type
Notes: We derive and then plot the posterior predicted mean support level from our multilevel models with 95% confidence intervals.
We find that most respondents are not supporters of either combatant: among those not harmed by either combatant, respondents exhibit a strongly negative effect toward ISAF (a −0.62 effect in standard deviations of the ideal points) and are only slightly less negative about the Taliban (at −0.29 standard deviations of the ideal points). Interestingly, those respondents who were harmed by ISAF only or by both ISAF and the Taliban exhibit a positive effect toward the Taliban (at 0.27 standard deviations and 0.15 standard deviations, respectively). Respondents who had been harmed only by ISAF or the Taliban were the least supportive of these combatants (at −0.89 standard deviations for ISAF and −0.40 standard deviations for the Taliban), though the magnitude of the effect is clearly asymmetrical across combatants.
Asymmetrical Effects of Victimization
We now provide the key evidence to support our central claim that the effects of violence on civilian attitudes are conditional on combatant identity. Figure 6 illustrates the estimated average effects of ISAF (left panel) and Taliban victimization (middle panel) on ISAF and Taliban support at two levels: the individual/family (solid circles) and the manteqa (open circles). In the right panel, the net differences between the effects of victimization on support for the Taliban and ISAF are also provided.
Estimated Effects of ISAF and Taliban Victimization on Support Levels for Each Combatant
Notes: The right panel presents the differences between the results in the middle and left panels. Posterior means of coefficients derived from multilevel models are plotted with 95% confidence intervals.
A number of important observations stand out. First, as expected by Hypothesis 1, we note that ISAF victimization is associated with a significant negative effect on ISAF support. ISAF victimization is also associated with a substantively large positive effect on Taliban support (Hypothesis 2). These data confirm that harmed individuals are both punishing the out-group for inflicting harm and are transferring support to the out-group as expected if intergroup biases are in play.
Second, Taliban victimization has no clear effect on support for ISAF. As expected by Hypothesis 3, we do not observe a blossoming of support for ISAF after Taliban-inflicted harm, suggesting that the out-group is not rewarded for its (relative) restraint. Moreover, Taliban victimization itself only slightly decreases Taliban support and certainly does not approach the penalty on ISAF support witnessed after ISAF victimization. While it would be incorrect to conclude that the Taliban can victimize civilians with impunity, they appear to enjoy a much larger cushion of public support than does ISAF, for whom civilian casualties are associated with a steep negative effect on support.
Third, we observe the hypothesized asymmetry of effects between ISAF victimization on Taliban support (middle panel, left column) and Taliban victimization on ISAF support (left panel, right column). This difference is statistically significant and is estimated to be 0.37 standard deviation of the ideal points (with the 95% confidence interval of [0.02, 0.73]) at the individual/family level. The right panel in Figure 6 underscores the asymmetry between the effects of ISAF victimization on relative support for the combatants (Taliban support minus ISAF support) and those associated with Taliban violence. Once again, it is apparent that while ISAF victimization creates a substantial positive effect on net Taliban support, Taliban victimization generates at best only a very modest positive effect on relative support for the out-group.
Are these results driven by personal exposure to harm, as suggested by Hypothesis 5, or are indirect influences equally as important? Returning to Figure 6, we observe that manteqa-level effects (as represented by open circles) of ISAF victimization are attenuated when compared with individual self-reports. We find that the net difference in the effect of ISAF violence on ISAF support between the individual and manteqa level is nearly statistically significant, with a 0.203 (95% confidence interval at [0, 0.65]). We do not observe a similar pattern of attenuation for Taliban violence, in part because the individual-level effects are already small. While the general pattern of effects is therefore similar across individual and manteqa levels, the magnitude of estimated effects on support levels for each combatant is typically diminished at the manteqa level, and significantly so for ISAF.
One interesting wrinkle also emerges from these findings: both Taliban and ISAF endorsements are, in some cases and regions, associated with reductions in support for the proposed reform relative to the control endorsement.Footnote 26 While caution is warranted, one interpretation of this result is simply that the control most closely resembles an official (government) endorsement. What we may be measuring, then, is the relative shift in support for Taliban and ISAF combatants associated with victimization against a more general backdrop of war weariness in which neither combatant is especially favored. That said, however, since support in war is relative, not absolute, it is also clear that the Taliban do enjoy a greater measure of support, and more tolerance of inflicting harm on civilians, than ISAF.
Tribal Analysis
Support for combatants is best cast as a continuum (Petersen Reference Petersen2001, 8), rather than a simple (and misleading) choice of “pro-Taliban” or “anti-ISAF.” We therefore add nuance to our discussion of intergroup bias by exploring intragroup variation. Several Pashtun tribes, for example, have largely (and publicly) declared in favor of the Taliban, while others, often in conflict with pro-Taliban tribes, have remained neutral or in a few instances sided against these tribes. While we cannot assume homogeneity of views among all members of a particular tribe, we can explore whether the attitudes of individuals from these pro-Taliban Pashtun tribes diverge from those of their non-Taliban aligned counterparts.
In particular, we expect that individuals from pro-Taliban tribes are more likely to be forgiving of Taliban victimization given their prior identification with the Taliban. The negative effects of ISAF victimization are also likely to be greater in magnitude for this subset, though if ISAF support is already low we may observe a floor effect given that support for ISAF may not sink any further. In each case, victimization is likely to confirm the intergroup bias that negative in-group actions are situational in nature while those of the out-group and its members are dispositional.
We begin with the effects of ISAF victimization on support for ISAF and the Taliban among pro-Taliban tribe (solid circles) and non-pro-Taliban tribe (solid squares) members, then turn to how Taliban violence affects support for ISAF and the Taliban itself. We provide a graphic interpretation of these results in Figure 11 in the Appendix.
We find, for example, that ISAF victimization has a more pronounced negative effect on ISAF support among pro-Taliban tribe members than their non-pro-Taliban tribal counterparts. Notably, however, the difference itself is fairly modest at −0.328 standard deviations (95% confidence interval at [−0.904, 0.168]) and statistically insignificant. The effects of ISAF violence on support for the Taliban are also different across subgroups. Here, it is the non-pro-Pashtun tribes that record the largest positive effect on support for the Taliban after experiencing ISAF victimization. This result is likely due to two factors. First, it is probable that since pro-Taliban tribes have already decided for the Taliban, their support is subject to a ceiling effect that limits the magnitude of the positive shock to Taliban support. Second, this result suggests that ISAF violence has an outsized effect on individuals who believe that they are either neutral or (more rarely) who have sided with ISAF. The difference between these two groups is striking at −0.604 standard deviations (with a 95% confidence interval of [−1.09, −0.23]), suggesting that ISAF-inflicted harm has a large effect on members of non-Taliban-aligned tribes and their support for the Taliban.
By contrast, Taliban victimization has broadly similar effects on ISAF support for both pro-Taliban and nonaligned Pashtuns. This result is consistent with our expectation that intergroup bias prevents a transfer of support from the in-group to the out-group. Where we observe divergence between these two subgroups is in the effects of Taliban violence on Taliban support. Members of pro-Taliban tribes appear not only to tolerate but embrace harm, as witnessed by the positive effect of Taliban harm on Taliban support. By contrast, Taliban violence has a slightly negative effect on non-pro-Taliban tribal members’ support for the insurgent organization.Footnote 27
These findings deepen our previous discussion by suggesting that combatant violence has asymmetric effects across different Pashtun tribal affiliations. ISAF victimization clearly has a disproportionate effect on support for the Taliban among non-pro-Taliban tribal members. Taliban victimization, by contrast, has a positive (and large) effect on pro-Taliban tribal members, suggesting that the Taliban possess a far higher freedom of action—to include causing civilian casualties—among their supporters than ISAF.
Effects of Post-Harm Mitigation Efforts
Can combatants offset the negative effects of their violence by rendering postharm assistance? We offer a preliminary exploration of this issue in Figure 7, which presents the estimated combined effect of being harmed but not subsequently approached (circle), the effect of being approached (square), and the combined effect of victimization and receiving post-harm assistance on attitudes toward the combatants.
Estimated Effects of Victimization and Subsequent “Approach” by Combatants on Support
Notes: The right panel presents the differences between the results in the middle and left panels. Posterior means of the corresponding coefficients are plotted along with 95% confidence intervals.
Two broad conclusions stand out. First, postharm mitigation efforts by both combatants are associated with a marked negative effect on support for the other combatant. Taliban victimization alone has a small positive effect on attitudes toward ISAF (as reported above) but, once aid has been proffered, the effect is a substantially negative effect on attitudes towards ISAF. Similarly, experience with ISAF victimization alone is associated with a positive effect on support for the Taliban. Yet if aid has been provided by ISAF, the result is a large negative effect on Taliban support (second column). Indeed, the net difference in effect between individuals who were harmed but not approached by ISAF and those who were harmed and then approached is a highly significant −1.00 standard deviation movement away from a pro-Taliban position (95% confidence interval of [−1.43, −0.53])
An optimistic take on these results would suggest that hearts and minds can in fact be swayed, if not bought outright, via postharm mitigation efforts. Yet a second finding is also important: these efforts appear to have little effect on support for the actual combatant that rendered the assistance. While ISAF does appear more successful at generating modest positive effects after its efforts, there is much less positive movement in attitudes toward the combatant responsible for the victimization than there is a shift away from the other combatant. In this situation, postharm aid appears less about persuading civilians to move toward one's side as it is about shifting away from the rival combatant.
We must also be careful not to overstate the finding about the effects of ISAF assistance. There is a severe selection problem at work here, because ISAF managed to “approach” only 16% of those who claimed that they had been harmed by ISAF. By contrast, the Taliban “approached” over 60% of those who self-identified as suffering Taliban victimization. ISAF's decision-making on the extension of condolence and battle damage payments is often haphazard, but is at least partly conditioned on anticipated reception in a given village (Campaign for Innocent Victims in Conflict 2010b). The more likely a unit is to receive armed resistance from aggrieved villagers, the less likely ISAF will return to disburse payments. Given closer media scrutiny, mass casualty events are more likely to be followed by postharm mitigation efforts. Aggrieved individuals in small-claims cases, by contrast, are often forced to go to military bases to receive their funds, discouraging all but the most determined and risk acceptant claimants (Campaign for Innocent Victims in Conflict 2010a). As a result, the finding regarding ISAF's ability to use condolence payments to overcome intergroup bias relies on a small subset of individuals who were specifically selected to receive this assistance. Indeed, these individuals may be the ones most likely to be swayed by ISAF's efforts.Footnote 28
Summary
Taking these findings as a whole, we uncover substantial evidence to support claims that the effects of violence on attitudes are conditional on perpetrator's identity. ISAF's violence is strongly associated with a negative effect on attitudes toward ISAF, while Taliban violence only has a marginally negative effect on Taliban support. Similarly, ISAF victimization leads to a marked positive effect on Taliban support but, consistent with our expectations, Taliban victimization results in only a small positive effect on ISAF support. These asymmetries are often powerful among a subset of individuals, namely, those who claim membership in publicly pro-Taliban Pashtun tribes. Finally, these results appear to be largely driven by personal experiences with harm, rather than indirect knowledge of harm inflicted within an individual's manteqa, especially for ISAF violence. This finding reinforces the need to devise and test our arguments about civilian victimization at the most microlevel unit possible, that of the individual, rather than assuming that macrolevel effects scale down to the individuals in a given geographic space.
Alternative Explanations
Our findings strongly suggest that intergroup biases are responsible for the observed asymmetries of effects of combatant actions on civilian attitudes. Yet what of alternative explanations? We consider four alternative identity-based theories and three additional explanations that emphasize battlefield factors such as the distribution of aid, relative control by the combatants, and Taliban service provision.
Other Identity-Based Accounts
We might imagine, for example, that the observed asymmetry of effects arises from a sense of betrayal among civilians. Perhaps these individuals expect that ISAF, but not the insurgents, will protect them, a belief that leads them to punish ISAF for violating its perceived commitment to safeguard the population. While intuitive, it is apparent that few believe ISAF will protect them from harm; in fact, the opposite is true. We posed the question “In your view, how often do foreign forces [Taliban] take precautions to avoid killing or injuring innocent civilians during their operations?” Possible answers were as follows: always (3), sometimes (2), rarely (1), and never (0). The mean response for ISAF was 0.56; for the Taliban, a 1.92, a substantial difference.Footnote 29 These findings are stunning when we consider that the Taliban killed an estimated 2,080 Afghan civilians in 2010 alone while ISAF was deemed responsible for 440. Yet the perception remains that ISAF, rather than the Taliban, is wielding violence indiscriminately, suggesting that individuals in our sample area do not believe that ISAF is protecting them.Footnote 30
These findings are also consistent with arguments that the post-2001 status reversal experienced by Pashtuns in Afghanistan's ethnic hierarchy has created high levels of support for the Taliban (for status reversal arguments, see especially Petersen Reference Petersen2002, 40–61). Yet while it is true that foreign-imposed regime changes often upend existing institutions, this is less the case in Afghanistan than elsewhere. The Karzai-led government created by the Bonn Agreement (December 2001) actually represented a return to prior patterns of ethnic hierarchy, not a decisive break. The current Pashtun-dominated executive has echoes in earlier Durrani Pashtun regimes, including the rule of the “Iron Amir” (1880–1901), under Mohammed Nadir Shah (1930–79), and the Taliban era itself. Despite (modest) local score settling, Pashtuns were not collectively punished for their earlier support of the Taliban, and the new Afghan constitution itself was ratified unanimously (Barfield Reference Barfield2010, 272–93). Given that dissatisfaction with the Karzai government transcends ethnic lines, it is unlikely that current Taliban support among Pashtuns—itself variable, not constant, in our data—is due to status reversal.
A third alternative explanation privileges revenge motives arising from the Pashtun-specific code of ethics known as Pashtunwali. Consisting of nine principles, Pashtunwali norms call for aggrieved individuals to take revenge (badal) upon a wrongdoer while acting bravely (tureh) to defend their property, family (especially women), and honor (Johnson and Mason Reference Johnson and Mason2008; Tomsen Reference Tomsen2011, 47–54). This argument about culture dictating attitudes stumbles, however, over two issues. First, it is not clear why attitudes would be asymmetrical among harmed individuals without invoking a prior claim about intergroup bias. In principle, revenge seeking should lead to symmetrical effects of violence on civilian attitudes since the obligation to seek redress is not directed solely against non-Pashtuns. Second, there is considerable intra-Pashtun tribal differences in how their attitudes are influenced by combatant violence and subsequent restitution efforts. It is neither the case that Pashtun attitudes are monolithic toward the combatants, nor are these attitudes uniformly affected by combatant actions.
Finally, these asymmetrical effects remain regardless of an individual's level of prior exposure to ISAF. Contact theory (Allport Reference Allport1954; Cook Reference Cook1971) suggests that, under certain conditions, intergroup bias—and, specifically, the lessening of out-group derogation—can be reduced via frequent, positive interaction with members of the out-group. Current ISAF counterinsurgency doctrine also stresses the importance of face-to-face interaction with local populations to build trust and shape attitudes. There is little evidence to support this claim in our context, however. To begin with, the conditions cited as necessary for contact theory to be operative are daunting. These include equal status between the interacting parties, shared goals, sustained intimate contact, and the absence of competition (Paluck and Green Reference Paluck and Green2009, 346), a set of conditions absent in Afghanistan. We also directly tested this claim with a question that measured the respondent's frequency of prior interaction with ISAF forces (Frequency). Frequency was statistically significant and negatively associated with ISAF support, exactly the opposite of contact theory's predictions.
Battlefield Dynamics: Aid, Control, and Taliban Service Provision
How do other theoretical explanations fare in explaining civilian attitudes? Surprisingly, we find little evidence that district-level variables hold weight in explaining attitudes toward either combatant. Caution is warranted when interpreting these results, to be sure, because there are only 21 districts in our sample. Moreover, while our sample is randomly drawn, combatant decisions to allocate aid and services and to wield violence are not, suggesting that some endogeneity between district-level variables and attitudes may be present.Footnote 31
Economic assistance appears to hold little sway over attitudes, whether in the form of quick, 30-day Commanders’ Emergency Response Program (CERP) initiatives or more deliberate National Solidarity Program (NSP) community grants. This holds true if we replace our preferred CERP measure, dollars spent per district in 2010, with the number of CERP initiatives undertaken per district in 2010. Similarly, our measure of NSP progress, namely the number of villages in a given district that received NSP grants up until December 2010, is not associated with any effect on civilian attitudes. While data limitations are undoubtedly present, especially given poor CERP data management practices, a district-level analysis may nonetheless be justified given the possibility of spillover between villages in a given area for certain types of aid.
The apparent ineffectiveness of the US $1 billion National Solidarity Program deserves a closer look, not least because it partly conflicts with Beath, Christia, and Enikolopov (Reference Beath, Christia and Enikolopov2011)’s careful NSP evaluation. These authors conclude that NSP receipt is associated with a modest improvement in respondents’ attitudes toward both local and central governments in 8 of 10 targeted districts. This positive effect disappears, however, in the two most violent and Pashtun-dominated districts in their sample, a finding that jibes with our own (Beath, Christia, and Enikolopov Reference Beath, Christia and Enikolopov2011, 4). Broadly speaking, the different conclusions about NSP effectiveness stem from sampling decisions: our 21 districts are all majority Pashtun and much more violent than average (Tajik majority) districts, while Beath, Christia, and Enikolopov restrict their sample to mostly Tajik or Hazara dominated areas (6 of 10 districts in their sample) where only 3% of respondents indicate that their village had experienced an attack in the past year (Beath, Christia, and Enikolopov Reference Beath, Christia and Enikolopov2011, 16).Footnote 32 Moreover, these differences may also arise from different methodological choices: we chose to rely on endorsement experiments to minimize social desirability bias, while the NSP survey evaluation relied on direct questions.
We also find only modest evidence for the presumed relationship between the distribution of combatant control and civilian attitudes. While being located in a government-controlled district is predictably associated with a negative effect on Taliban support, no level of combatant control is associated with any statistically significant effect on support for either combatant. ISAF support is lowest, and Taliban support highest, in districts that are deemed “Taliban controlled” by ISAF relative to “contested” districts. This is consistent with the theoretical predictions of Kalyvas (Reference Kalyvas2006), though the level of support for the Taliban is surprisingly low and, indeed, does not reach positive values for most of the districts in the analysis.
Taliban support is also consistently lower in districts marked by high opium cultivation. While the Taliban do provide farmers with security in exchange for a share of revenue from opium sales, it is possible that more draconian Taliban measures—cultivation quotas enforced through violence, increasing levels of taxation, and leverage due to rising farmer indebtedness—account for these lower levels of Taliban support. Unexpectedly, the districts that were earliest to witness mobile Taliban courts established have lower net support for the Taliban, though this difference is not statistically significant. This difference is perhaps due to the fact that the Taliban chose these locations to win over local populations, not to reward areas where support was already assured.
Finally, we examined whether districts that border Pakistan differ in their levels of support for the Taliban than nonborder districts. One might imagine, for example, that these border districts have a higher concentration of foreign fighters than more distant districts such as Helmand or Uruzgan, and thus the meaning of “Taliban” may differ regionally.Footnote 33 We therefore plot in the appendix the mean differences in support for Taliban and ISAF, along with the net difference, in the final column of Figure 12. There is little difference in support for either combatant between border and nonborder districts.
Village-Level Analysis
These findings also pose a substantial challenge to studies that presume individual- or group-level motives and mechanisms but test these arguments with data aggregated to larger territorial units such as villages or districts. As noted above, our violent event datasets are only weakly correlated with respondent perceptions of harm. This lack of a relationship carries over into our multilevel model, in which ISAF and Taliban violent events from January to December 2010 are not associated with respondent attitudes toward the combatants regardless of whether we rely on a 1-, 5-, or 10-km radius around the village. Simply put, once we control for variance at the individual level and varying intercepts at the village, district, and province level, other factors at the village and district levels are not strongly associated with combatant support.Footnote 34
To be sure, not every research question requires individual-level data, and we must be cautious when assessing causality in the absence of a clear identification strategy. Yet these nonfindings suggest that the now-standard practice in civil war studies of relying on aggregated event counts may be problematic. At a minimum, these data are unlikely to be useful in testing the attitudinal mechanisms thought to link violence to behavior. Even studies that draw on fine-grained data on civilian casualties (Condra et al. Reference Condra, Felter, Iyengar and Shapiro2011) are likely to be misleading if these events are only loosely connected with civilian perceptions or are aggregated into larger territorial units far removed from the victimized individuals. In other words, civilian attitudes may represent a substantial omitted variable in most statistical accounts of civil war dynamics. These mistaken inferences are likely compounded if the event data are not disaggregated by perpetrator and victim identities, thus missing the conditional nature of violence's effects on civilian attitudes.
Endogeneity
Two potential objections to our intergroup bias theory should also be addressed here. First, it is possible that perceptions of harm inflicted are themselves driven by prior attitudes toward the combatants. Willingness to assign blame for harm may therefore be endogenous to preexisting beliefs, particularly in circumstances where the actual identity of the perpetrator is unknown. Addressing this issue is difficult due to the absence of completely reliable measures of violence inflicted on individuals. In addition, research in conflict settings is typically conducted after repeated interactions between combatants and civilians have already occurred. Nevertheless, our theory generates a clear set of predictions about asymmetrical effects, whereas claims about endogeneity between attitudes and perceptions of harm do not. Specifically, the presence of endogeneity implies that self-reported harm by any group is negatively correlated with support for that group and does not predict that these effects are conditional on the perpetrator's identity.
It is worthwhile to note that information may be unreliable, and uncertainty rife, in wartime settings. Individuals themselves may not know which combatant to blame for the harm inflicted, especially if they are literally caught in the crossfire. Individuals may also be biased against the outsider, leading to the over-reporting of harm by the out-group. Under this scenario, blame attribution may be at work.Footnote 35 Nevertheless, in contrast to our intergroup bias argument, this alternative theory does not predict the asymmetry in the marginal effects of victimization. Instead, a theory of blame attribution would suggest that the effects of victimization are uniform across combatants even though self-reports may incorrectly attribute some of the harm inflicted to the out-group.
A second concern is that since groups vary along multiple dimensions, not simply ethnicity, these differences in political objectives and military strategies may matter more than intergroup bias. In general, addressing such a concern would require the researcher to manipulate certain aspects of the identity and/or actions of combatants while keeping the ethnicity difference constant. Clearly, this is a difficult task in a wartime context. In our case, we can rule out specific explanations. For example, one may hypothesize that since ISAF is an external intervener, it possesses a shorter time horizon than the Taliban, the local in-group, and thus individuals will respond differently to their actions. However, this hypothesis is unlikely to hold in our case. While external interveners can of course withdraw, this prospect does not necessarily predict asymmetrical effects of harm. Moreover, an individual's “shadow of the future” would also have to loom exceedingly large for these distant concerns to trump short-term survival calculations.Footnote 36
CONCLUDING REMARKS
The premise that civilians in wartime, trapped between dueling combatants, are driven solely by material inducements and immediate or threatened punishment remains a central facet of our theories of civil war dynamics. Our evidence suggests a more complicated picture: civilians possess strong intergroup biases that condition how violence will affect support for combatants. Moreover, these effects are asymmetrical, not uniform, in nature. In Afghanistan, ISAF's violence is associated with a negative effect on attitudes toward ISAF, while Taliban violence does not produce a similarly negative effect. Moreover, ISAF's victimization is associated with a positive effect on Taliban support; Taliban victimization, by contrast, does not lead to a transfer of support to ISAF. This asymmetrical “home team discount” is especially strong among self-declared pro-Taliban tribes. Nor are these effects fleeting. These asymmetrical effects persist even when controlling for key factors such as each combatant's level of control over a district, their prior patterns of violence, and their efforts to provide economic assistance and basic services.
These findings suggest several implications for the current war in Afghanistan and, more generally, for the study and practice of counterinsurgency. First, rebels who are in-group members possess a measure of forgiveness not afforded the counterinsurgent when it victimizes civilians. In fact, ISAF violence has most likely reinforced intergroup biases, making it even more difficult to sway, let alone win, “hearts and minds.” Nor does it appear that aid programs, whether the massive National Solidarity Program or small-scale Commander's Emergency Response Program funds, are making substantial in-roads on this task. To be sure, more research is required, given that our sample included only 21 districts. Yet these programs do appear insufficient to provide the kinds of material inducements that might overcome intergroup biases. The durable nature of these biases also suggests they will persist through 2014, complicating ISAF's planned exit from Afghanistan.
Our survey also provides a proof of concept for the utility of experimental methods in violent settings. Scholars, nongovernmental organizations, and military forces alike could benefit from replacing direct questions with indirect survey techniques such as endorsement and list experiments. In Afghanistan, for example, ISAF has devoted tens of millions of dollars to assessing public opinion on a wide array of sensitive issues using direct questions, including on corruption and support for the Afghan government, Taliban, and Afghan National Security Forces. Given the methodological and ethical issues associated with direct questions in wartime environments, such efforts are unlikely to yield credible data on public opinion that policymakers require. At the other extreme, the World Bank's signature Living Standards Measurement Survey avoids sensitive topics and typically does not record data on exposure to violence, even when fielded in (post)conflict environments (Brück et al. Reference Brück, Justino, Verwimp and Avdeenko2010). Between these two extremes, there is enormous opportunity to use and combine multiple indirect techniques to tackle sensitive issues of pressing theoretical and practical importance.
That combatant violence has asymmetrical effects on civilian attitudes also raises implications for existing theories of civil war violence. Most importantly, this asymmetry underscores the need to consider the psychological mechanisms that may drive civilian behavior in wartime. In part, this may result in the broadening of our understanding of individual incentives to include nonmaterial and group-based incentives as well as material inducements and punishments. Equally important, however, is the role played by perceptions of harm, as measured by self-reports. No single event dataset, or even multiple ones, will capture the complete array of violence experienced by a population during wartime, especially if these data remain narrowly focused (as now) on civilian fatalities only. Rather than relying solely on event data, we should integrate perceptions of harm and other individual-level characteristics into our models if we are to understand how violence is understood by civilians and how it affects both attitudes and subsequent behavior. Given that ISAF's own event data had little explanatory weight in our models, village level or even coarser data are likely inappropriate for testing theories that assume individual- or group-level motives and mechanisms.
As a part of this process, empirical strategies will need to move beyond the simplistic assumption that violence has uniform effects. Statistical models that rely on counts of violent acts but do not distinguish among perpetrator and victim identities are likely to be misspecified, for example. Instead, we should be devising and testing theories that measure conditional average treatment effects if we are to properly capture the heterogeneous effects of violence on attitudes. This move is especially important for explaining why certain policies worked (or failed) and identifying why certain individuals (but not others) were more responsive to particular initiatives. Beyond violence, measurement of the effectiveness of aid interventions would also likely benefit from considering whether program effects are conditional on donor identity.
Finally, we still know little about how group identities form under wartime conditions or how blame for particular events is assigned by affected individuals. Reversing this study's focus to treat identity as the dependent variable would provide insight into the dynamics of blame in wartime settings. Perhaps most ambitiously, future research should strive to close the loop between attitudes and behavior. Estimates of support could become the basis for predicting the location of future violence or the degree of collaboration with the local population, highlighting again the importance of elevating civilian attitudes from their current neglected status in our theories to the foreground of our study of civil war dynamics.
APPENDIX
Endorsement Experiment Questions
In addition to the prison reform question, we used three other questions in order to estimate support levels for the Taliban and ISAF.
Direct Elections
It has recently been proposed [by the Taliban; by foreign forces] to allow Afghans to vote in direct elections when selecting leaders for district councils. Provided for under Electoral Law, these direct elections would increase the transparency of local government as well as its responsiveness to the needs and priorities of the Afghan people. It would also permit local people to actively participate in local administration through voting and by advancing their own candidacy for office in these district councils. How do you feel about this proposal?
Independent Election Commission
A recent proposal calls [by the Taliban; by foreign forces] for the strengthening of the Independent Election Commission (IEC). The Commission has a number of important functions, including monitoring presidential and parliamentary elections for fraud and verifying the identity of candidates for political office. Strengthening the IEC will increase the expense of elections and may delay the announcement of official winners but may also prevent corruption and election day problems. How do you feel about this proposal?
Anti-Corruption Reform
It has recently been proposed [by the Taliban; by foreign forces] that the new Office of Oversight for Anti-Corruption, which leads investigations into corruption among government and military officials, be strengthened. Specifically, the Office's staff should be increased and its ability to investigate suspected corruption at the highest levels, including among senior officials, should be improved by allowing the Office to collect its own information about suspected wrong-doing. How do you feel about this policy?
“Ground-Truthing” Our Initial Findings
Figure 1 displays the overall (top row) and provincial distributions of responses to the four endorsement questions. Three patterns are worth noting. First, there is substantial heterogeneity of interprovince support for these policies, even independent of particular endorsements. This is encouraging since it suggests that the questions, taken separately or together, possess strong discriminatory power. Compare higher support for prison reform in Logar, for example, with Khost, or anticorruption efforts in Logar with Helmand. Second, support differs substantially across Taliban and ISAF endorsements. In some provinces including the Taliban stronghold of Helmand or the warlord-controlled Uruzgan, support for Taliban endorsed policies is far higher than ISAF endorsed policies. In fewer cases, notably in the key battleground province of Kunar, ISAF endorsement translates into higher support for at least two proposals. To further validate whether the endorsement experiments are measuring the support for the Taliban and ISAF, the Appendix presents a detailed descriptive analysis, which argues that the patterns we observe across provinces and districts are consistent with conditions in each province at the time of the survey.
Since endorsement experiments only provide indirect measures of support, it is important to compare these responses with existing knowledge of these areas. We contend that, while these distributions are broadly consistent with the qualitative knowledge about these five provinces, our survey experiment also identifies novel patterns at provincial and district levels.
As Figure 1 demonstrates, Helmand reveals a strong pro-Taliban emphasis in its collective response to the endorsement questions at the provincial level. This finding is perhaps unsurprising, for Helmand has been a Taliban bastion since the resurgence of the Taliban movement in 2006. Afghanistan's largest province, a key south-north supply line, and the center of its booming opium trade, Helmand has also consistently topped ISAF charts for insurgent-initiated attacks against ISAF forces. In 2010—that is, before and during our survey—ISAF and Afghan National Army (ANA) forces had launched a series of operations designed to evict the Taliban forcibly from several districts, including Garmser, Nawa, Nad Ali, Now Zad, and the capital, Lashkar Gah. These efforts have yielded a modest reduction of anti-ISAF violence, but these gains remain fragile and their ultimate effects unknown.
Khost is a relatively small and mountainous province that, owing to its strategic location bordering Pakistan, has emerged as an important transit route for both Taliban fighters and those of the Haqqani network. Closely aligned with the Taliban, the Haqqani network is led by Mawlawi Jalaluddin Haqqani and his son, Sirajuddin Haqqani, and has gained a reputation as one of the most lethal and violent insurgent organizations in Afghanistan. At the time of our survey, Khost was largely stable, but had recorded a notable uptick in attacks in 2010 when compared with the preceding year. The presence of both a sizable ISAF contingent and these armed groups lends Khost the air of a classic “battleground” province. As a consequence, attitudes toward the combatants appear nearly evenly divided, with ISAF or Taliban leanings apparently dictated by the content of the particular issue rather than prior allegiance.
Much like Khost, Kunar is a relatively small, mountainous province that borders Pakistan. Two insurgent groups, the Taliban and Hezb-e Islami Gulbuddin (HIG), are present, though the Taliban are by far the largest and most important organization. Unlike Khost, however, Kunar has long been viewed by ISAF as a linchpin in its eastern strategy. As such, at least $70 million in aid has been poured into the province, while the United States maintains a large, if still insufficient, military presence in the province. Here, too, public attitudes toward the combatants appears divided, with the weight of a particular endorsement conditional on the question posed. This is perhaps to be expected given the sizable presence of both combatants in the province, not to mention ever-increasing levels of violence between them. Kunar will only gain in importance in the coming months as ISAF shifts its counterinsurgency strategy away from Helmand and Kandahar and toward Afghanistan's eastern border provinces.
Logar has until recently enjoyed a reputation for safety, with some of the lowest recorded totals of insurgent violence among Pashtun-majority provinces. While an important transit route to and from Kabul, there is only a minimal Czech-led ISAF force presence in the province. In recent years, however, the Taliban have made inroads into this agricultural province as part of their strategy to encircle Kabul, and violent incidents increased in 2010. Our endorsement experiments reflect this trend: three of four questions suggest a pro-Taliban leaning, despite the fact that Logar's capital, Pul-i-Alam, is only 60 kilometers from Kabul.
Uruzgan is a rugged, sparsely populated and extremely poor (even by Afghanistan's standards) province that has only a small Dutch-led ISAF presence. Local government has essentially been captured by Matiullah Khan, a local warlord who heads a private army that generates millions of dollars by guarding NATO's supply convoys that transit the highway linking Kandahar to Uruzgan's capital, Tirin Kowt.Footnote 37 Khan, along with U.S. and Australian Special Forces, has also fought to clear Taliban forces from Uruzgan, though allegations persist that he actually colludes with, rather than combats, Taliban forces to secure additional revenues for “protection.” In light of the province's chaotic government, weak ISAF presence, and general lawlessness, the demonstrated support for the Taliban in Figure 1 is perhaps unsurprising despite ISAF's own internal designation of Uruzgan as generally under “government or local control.”
Finally, Figure 8 offers Helmand as an example that substantial district-level variation exists in the distribution of responses, even within a province uniformly regarded by ISAF and outside observers as heavily pro-Taliban. Intriguingly, in the case of Lashkar Gah, Helmand's capital district, we even observe high levels of ISAF support. This trend is likely due to a joint ISAF-Afghan National Army (ANA) offensive launched in late 2010 that resulted in the forced dislodging of Taliban fighters from the capital city, if not the surrounding countryside. Unlike other provinces, however, Helmand has a fairly high refusal to answer rate, which is mostly concentrated in Now Zad district. Subsequent interviews with our Helmand survey coordinator and district managers suggest that the survey was conducted during an ongoing ISAF military operation that had bloodied, but not yet eliminated, the Taliban in Now Zad.Footnote 38 Historically a Taliban bastion, Now Zad was a “no man's land” in January-February 2011 and, as such, many respondents simply refused to answer these questions to avoid incurring Taliban wrath. Given these circumstances, it is nonetheless remarkable that the majority of respondents in Now Zad still answered these questions.
Within-District Distribution of Responses to the Endorsement Experiment for Helmand Province
Notes: Plots show the distribution of five point scale responses to four policy questions (columns) across three groups (Taliban/ISAF endorsement groups and control group) for each of the five districts of the Helmand Province in the sample. Sample sizes are also shown.
Sampling Balance Checks
The multistage random sampling of provinces within the universe of 13 Pashtun-dominated provinces, then districts, then villages guarantees balance across covariates in expectation. Figure 9 shows that the balance is also achieved between surveyed villages (black density lines) and nonsampled villages in sampled districts (dark gray density lines).
Covariate Balance Across Surveyed and Non-Surveyed Villages
Exposure to Violence
The questions about exposure to violence are reproduced below.
• Over the past year, have you or anyone in your family suffered harm due to the actions of foreign forces [Taliban]?
• Over the past year, have you heard of anyone in your manteqa suffering harm due to the actions of foreign forces [Taliban]?
The same questions were asked about the Taliban to establish the comparison between the effects of ISAF and Taliban-inflicted harm on attitudes. Manteqa literally translates as “area” and typically refers to a geographic space larger than the village but much smaller than a district. To avoid ambiguity and differing interpretations, the questions were preceded by a script that defined “harm” as both physical injury and property damage.
After each question about direct and indirect exposure to harm, we asked whether the individual had personally experienced or heard about efforts by the responsible combatant to mitigate the harm inflicted. These questions permit subsetting of individual experiences by exposure to harm (yes/no), by combatant, and whether those harmed were subsequently approached by the responsible party in an effort to mitigate the negative effects of their actions. This latter comparison is especially important since it allows us to examine whether attitudes are irretrievably hardened by violence or whether they can be shaped, if only partially, by combatants after the fact. Our postharm mitigation question is reproduced below.
• (If yes to the above question) Have you (or your family) been approached by foreign forces after they caused harm?
• (If yes to the above question) Have you heard whether foreign forces approached those who suffered harm?
As before, these questions were repeated to capture whether the Taliban had approached victimized individuals (direct exposure) and if the respondent knew of similar efforts in his manteqa (indirect exposure).
Respondents were also asked “how often do you encounter foreign forces in the area where you live?” This question, which was not asked about the Taliban for security reasons, aimed to control for prior level of interaction with ISAF forces. Possible answers ranged from “daily” and “several times a week” to “several times a month” and “never.”
Figure 10 presents mosaic plots summarizing four key questions (two for each combatant) about exposure to violence: whether the respondent had experienced harm from Taliban and ISAF-initiated violence and whether the responsible combatant subsequently approached harmed individuals. Plots were created for direct exposure to violence (Figure 10(a)) and indirect exposure in the manteqa (Figure 10(b)) for the sample average and for each province. In each mosaic plot, the rectangle's area is proportional to the number of respondents who answered a specific combination of these four questions. For example, the plot in the upper left corner illustrates the overall distribution for direct exposure to violence; the largest rectangle depicts those that did not experience harm by either the Taliban or ISAF and who were, as a consequence, not approached.
Responses to Questions About Taliban and ISAF Victimization and Subsequent “Approach” by These Combatants
Notes: Mosaic plots depict the overall and interprovince distributions of responses at the self/family (left two columns) and manteqa (right two columns) levels. In each plot, the area of a rectangle is proportional to the number of respondents who answered those four questions in a specific way. The number in each rectangle represents the proportion of the same of the corresponding subgroup. “Don't Know” and “Refuse to Answer” were dropped as they accounted for at most 2% of the sample.
Province-level variation is broadly consistent with the pattern of violence outlined in Figure 3. Helmand is associated with the highest recorded levels of violence from individual and manteqa level self-reports (right corner plots of each subfigure) and from the CIDNE data, for example. Logar, by contrast, is associated with the lowest levels of self-reported victimization (left bottom corner plot of Figure 10(a)) and CIDNE data (see Figures 11 and 12).
Tribal Analysis
Differences in Estimated Effects of Victimization by the Taliban and ISAF on Their Support Levels by Tribal Affiliation with the Taliban
Notes: The right panel presents the differences between the results in the middle and left panels. Posterior means of the corresponding coefficients are plotted along with 95% confidence intervals.
Alternative Explanations
Relationship between District-Level Covariates and Estimated District-Level Support for the Taliban and ISAF
Notes: The estimated mean support levels and 95% confidence intervals for each combatant (solid circles and squares) are presented along with net differences (open triangles).
Coefficient Estimates of the Full Models
Posterior Means and Standard Deviations for Estimated Effects of Covariates on Support for ISAF, the Taliban, and the Estimated Difference from the Full Individual-level Harm Model and the Manteqa Harm Model
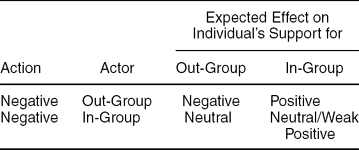
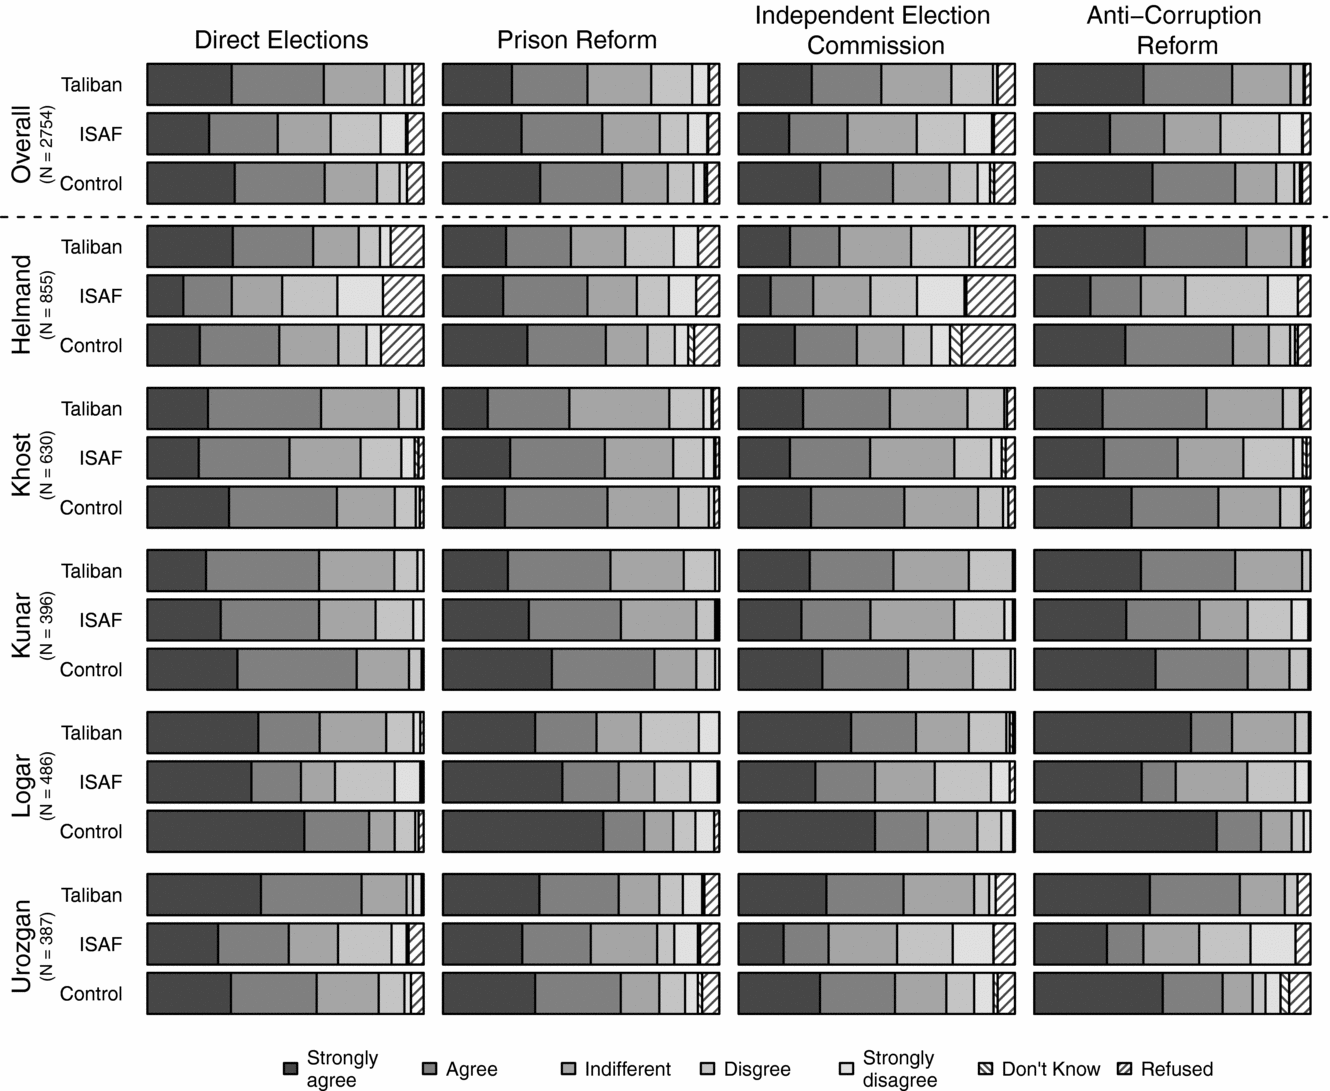
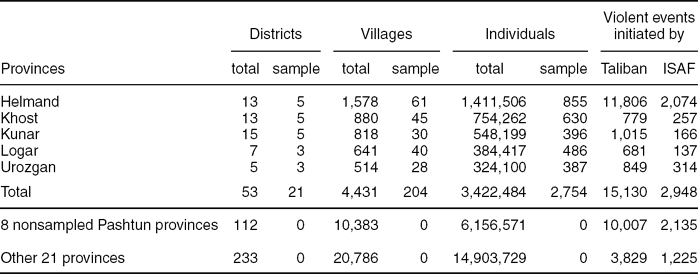
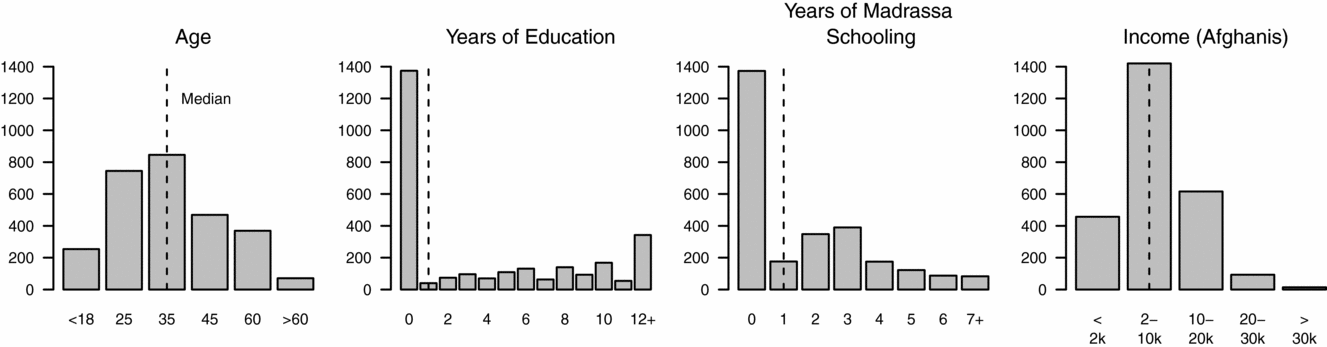

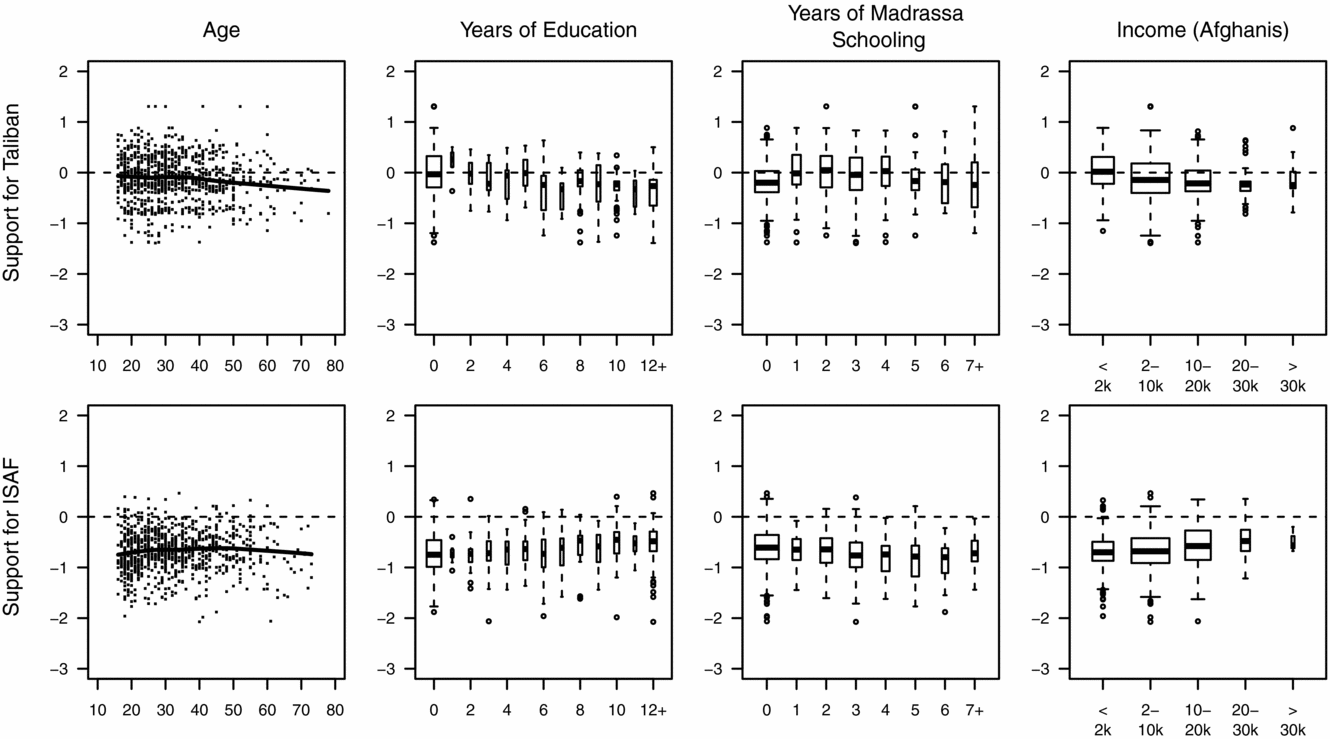
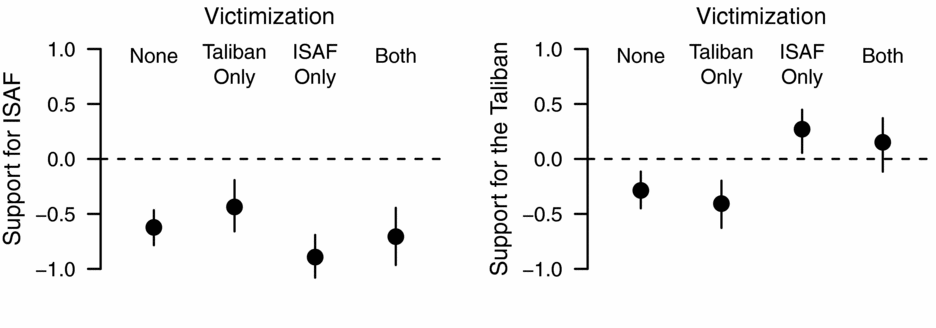
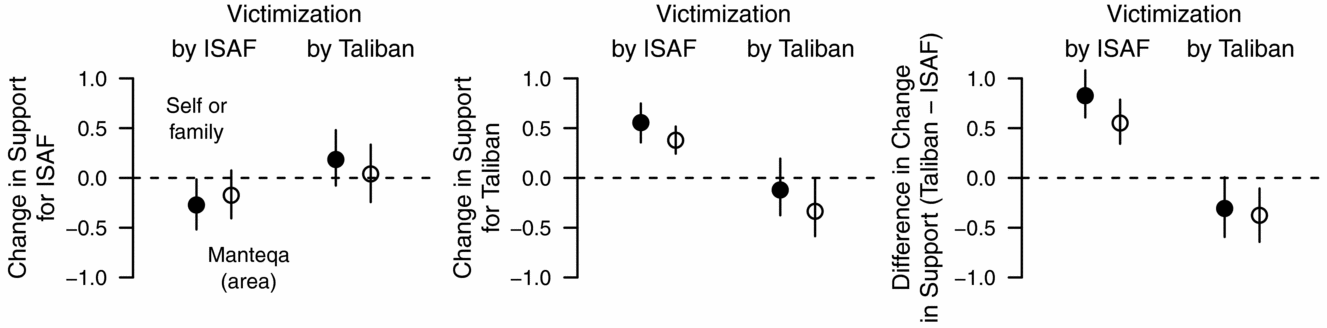
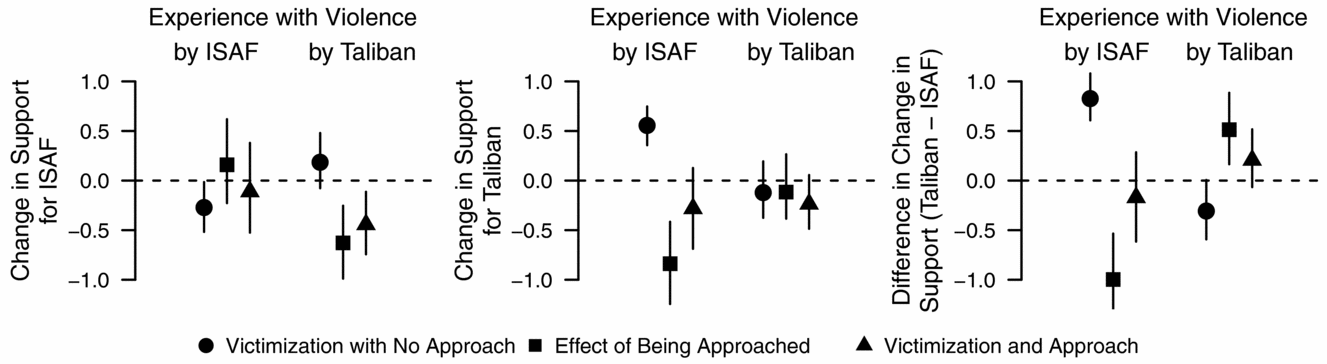
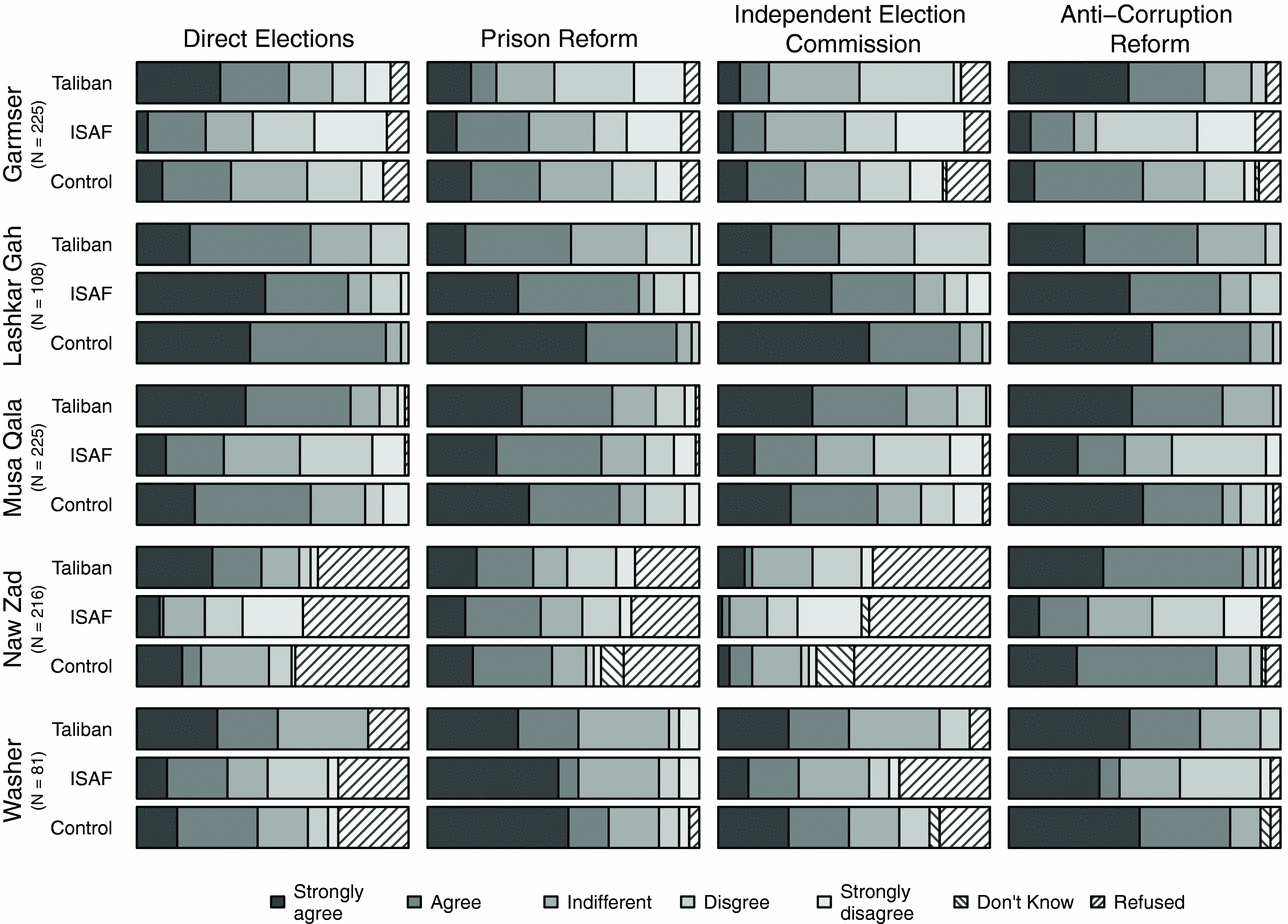
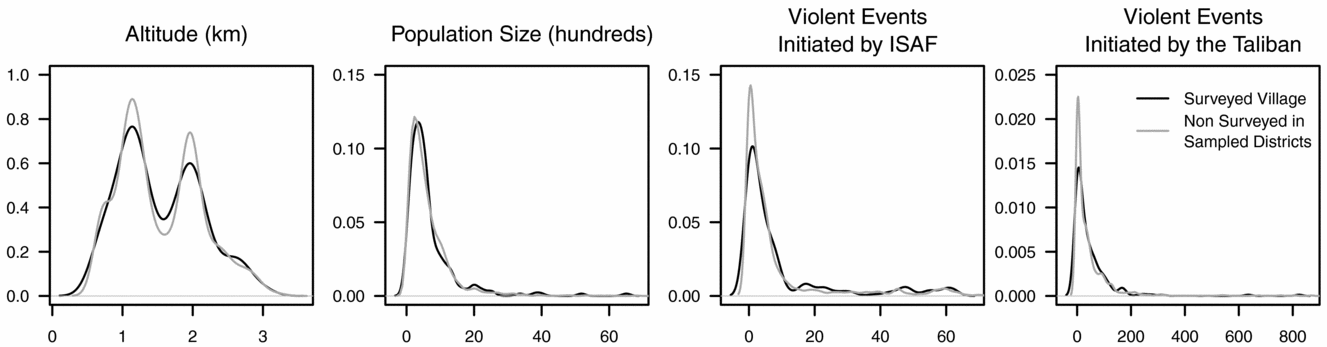
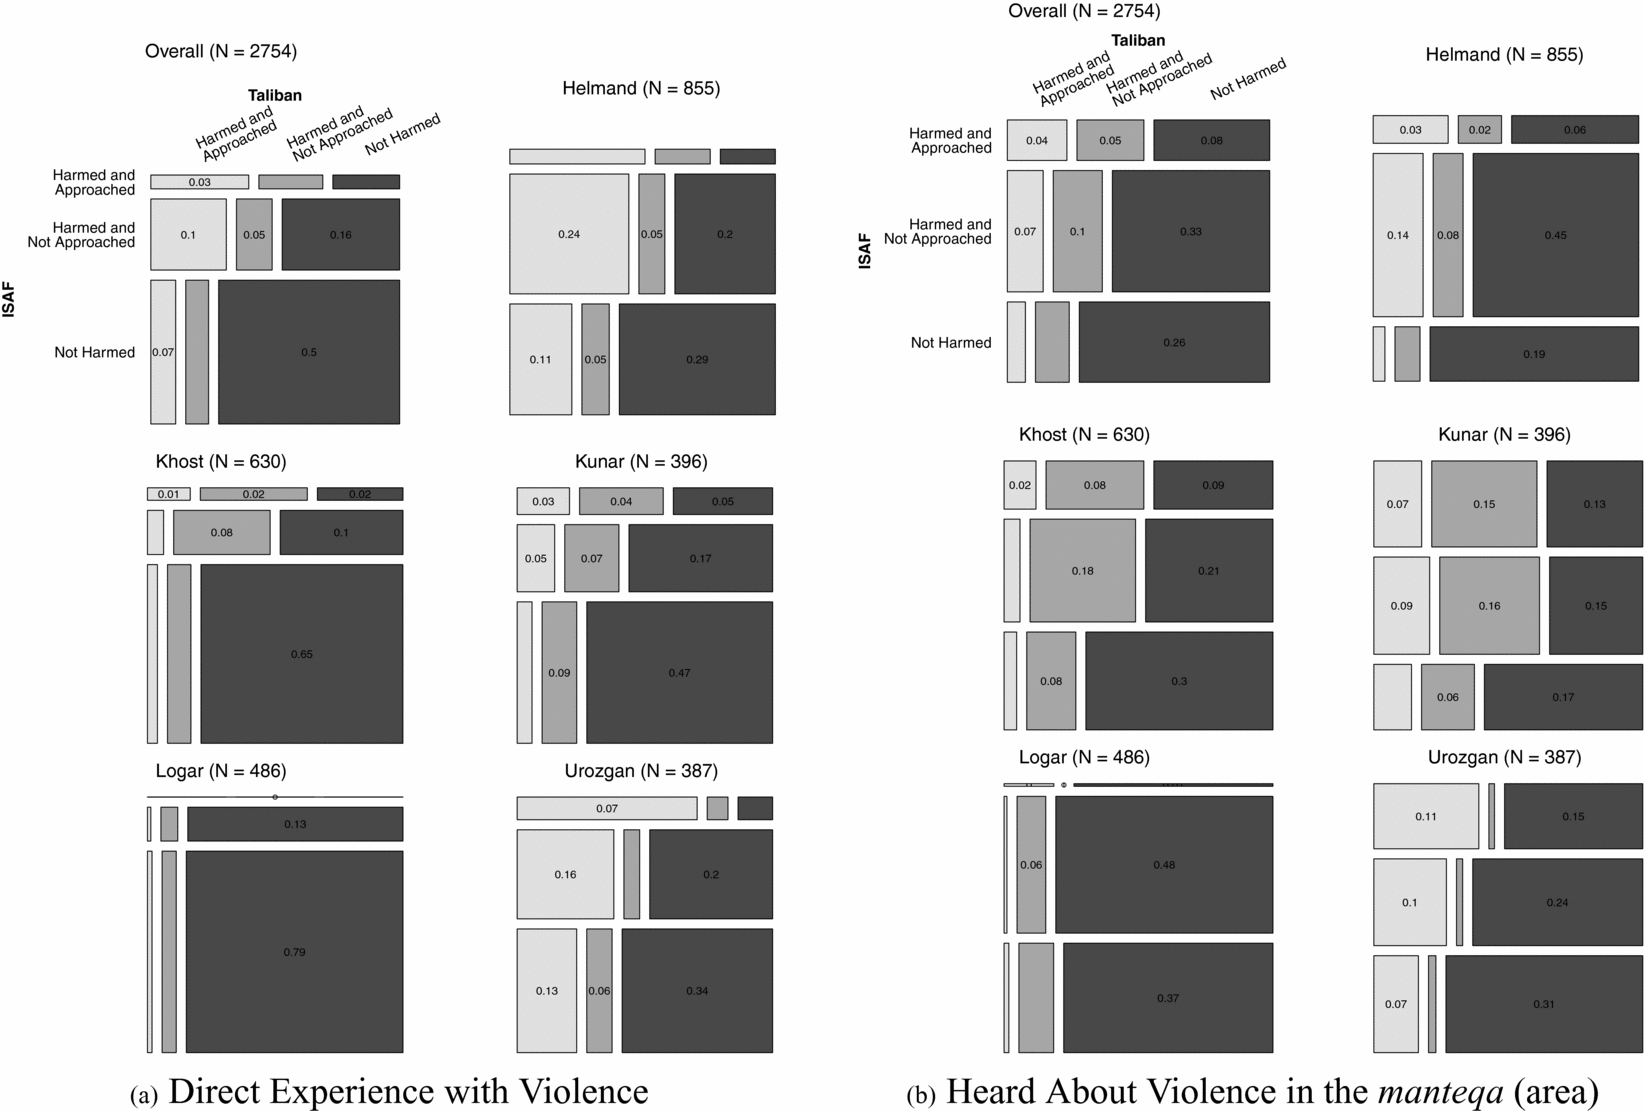
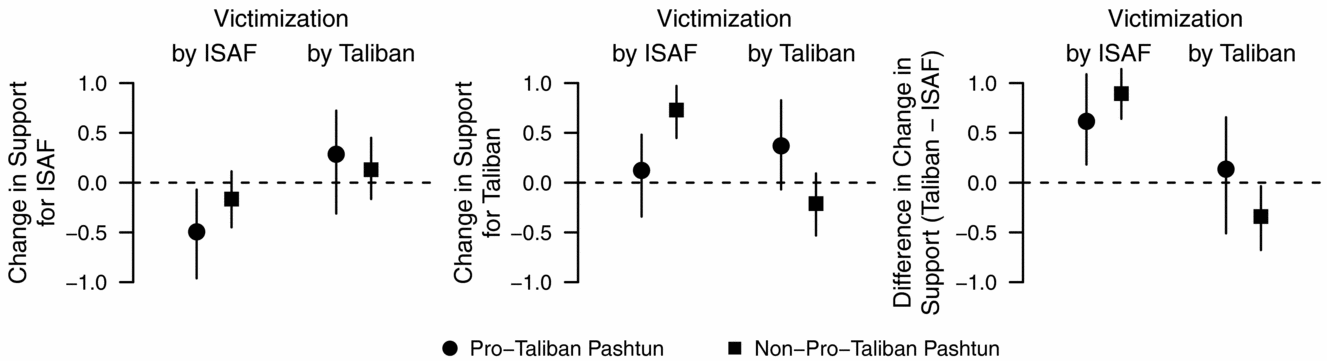
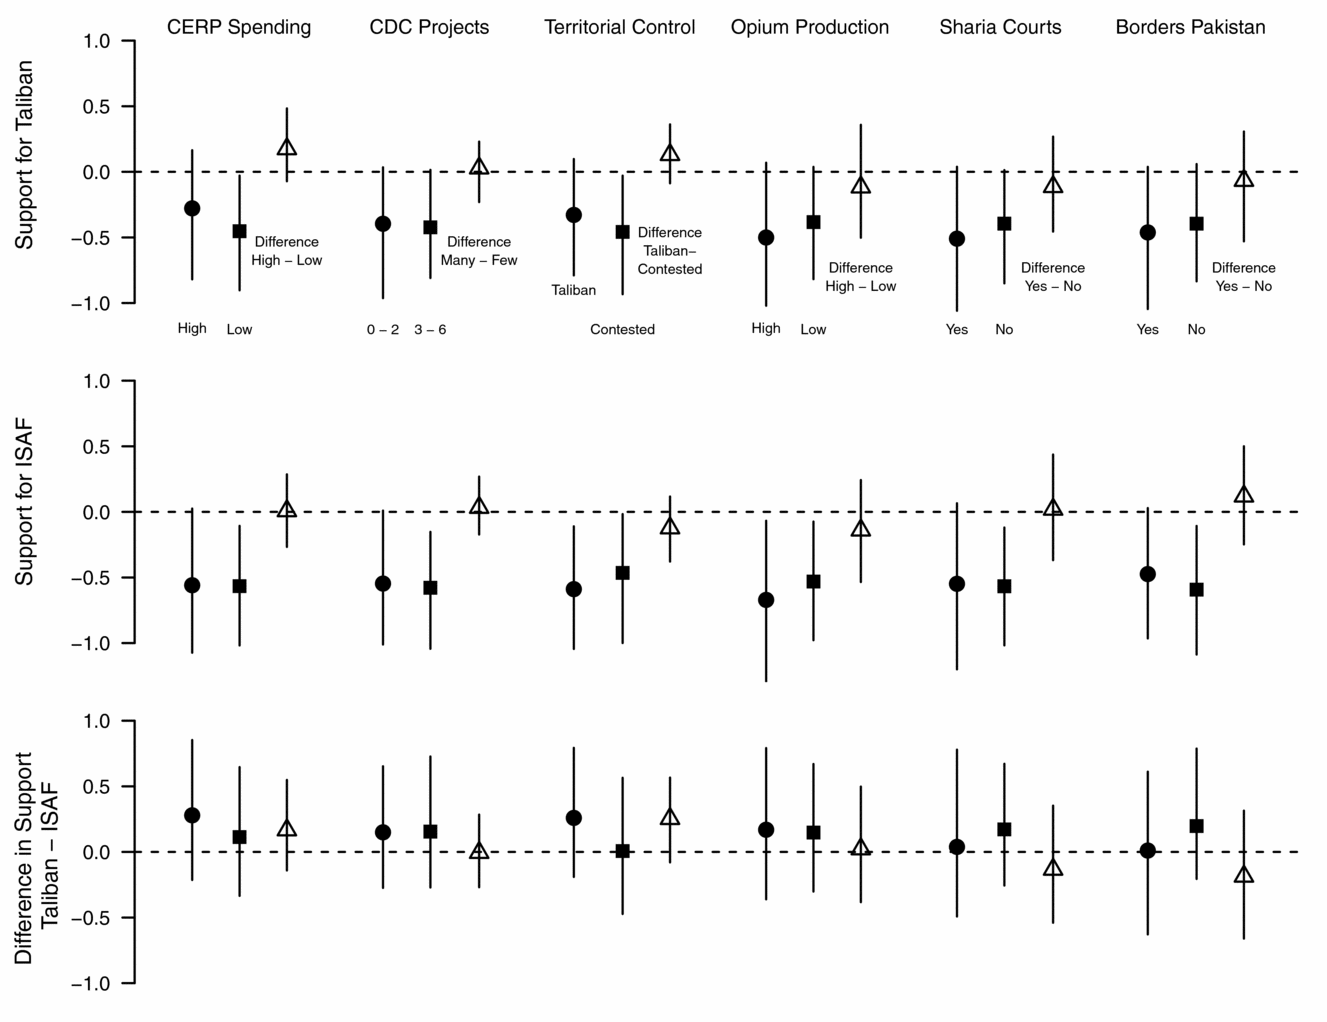
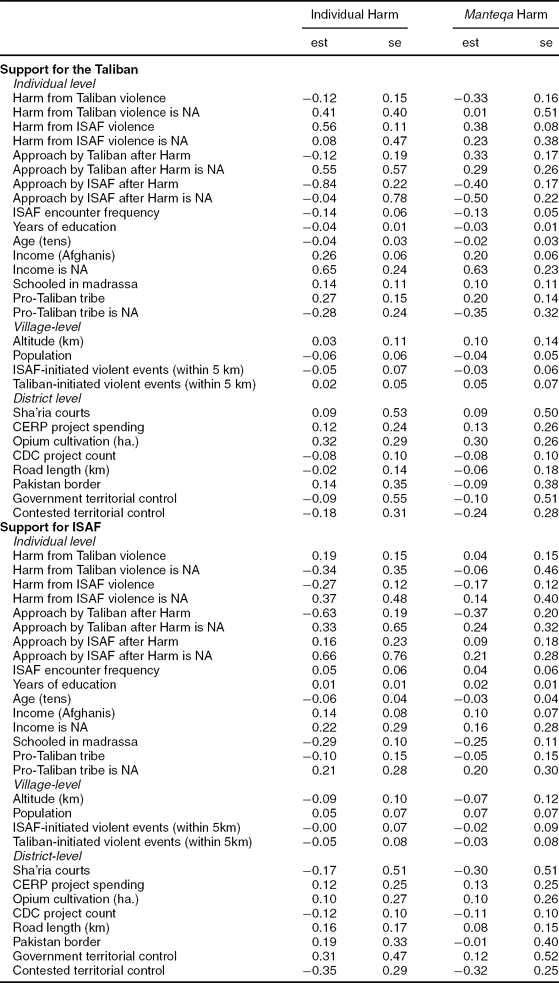



Comments
No Comments have been published for this article.