


INTRODUCTION
Immigrants are severely underrepresented in city halls and national parliaments around the world. In most European countries and even in traditional immigration destinations like the United States, Canada, and Australia, parity ratios—the share of immigrants who hold elected office divided by their share in the population—fall well below 1 (Bloemraad Reference Bloemraad2013). This lack of descriptive representation occurs even though immigrants have settled in advanced democracies for several decades and have done so in great numbers. In many advanced industrialized democracies the foreign-born now constitute well over 10 percent of the population.
The fact that substantial parts of the population face barriers when seeking to enter electoral politics poses deep challenges to democratic practice and norms. Minority representatives often articulate the interests of minority constituents, and, in doing so, introduce perspectives to deliberative decision-making processes that would otherwise remain ignored (e.g., Gutmann and Thompson Reference Gutmann and Thompson2004, Karpowitz et al. Reference Karpowitz, Mendelberg and Shaker2012, Mansbridge Reference Mansbridge1999, Tate Reference Tate2003). The presence of minority representatives can also lessen minority groups’ sense of marginalization. Descriptive representation can signal that the political system is inclusive of minority voices and, further, that the majority society accepts or even welcomes diversity (e.g., Bloemraad Reference Bloemraad2013, Chauchard Reference Chauchard2014, Mansbridge Reference Mansbridge1999, Phillips Reference Phillips1995).
Finally, and most dramatically, it has been argued that the political exclusion of immigrant-origin minorities has contributed to riots, as politically marginalized immigrant groups in France, Belgium, Great Britain, and elsewhere have taken their grievances to the streets (Bleich et al. Reference Bleich, Caeiro and Luehrman2010; Dancygier Reference Dancygier2010). A recent example of such disturbances occurred in Sweden, where the foreign-born constitute 15 percent of the population. The riots erupted in Stockholm's suburbs and subsequently spread to immigrant neighborhoods in other towns. One of the chief reasons attributed to immigrants’ discontent is the inequality they experience in the labor market and in the political arena. As one police officer remarked, rioting “is the only way [immigrants] can get the attention of politicians and the media” (Higgins Reference Higgins2013). Thus, even though descriptive representation does not necessarily ensure that legislation reflects minority concerns,Footnote 1 scholars have identified a host of other beneficial consequences.
What, then, accounts for the widespread and persistent political underrepresentation of immigrant-origin minorities? Existing research typically distinguishes between resource-based and context-based explanations. Scholars stressing the importance of resources point to differences in groups’ income and education levels as critical variables in explaining variation in electoral participation and representation. Others draw attention to the broader context (often referred to as opportunity structures), which can consist of party systems, electoral rules, and other context-level factors.Footnote 2
What is the importance of individual resources and political opportunity structures in explaining variation in immigrant representation? And are individuals holding similar resources and facing similar political opportunity structures treated identically, irrespective of whether they are natives or immigrants? One severe obstacle to answering these questions is the lack of adequate data that can adjudicate between these sets of factors. Existing research often examines variation in the composition of legislatures, usually city councils or national parliaments. This approach has yielded valuable insights, and it is especially useful for assessing how local contexts shape aggregate rates of minority representation.Footnote 3 But it also has major shortcomings.
First, rather than just looking at those who occupy legislatures, we should consider what distinguishes winning candidates from the rest of the population that does not hold elected office. Second, studying the make-up of legislatures does not provide information about the individual-level characteristics that help or hinder immigrants’ access to parliaments and, further, whether these characteristics matter differently for immigrants than they do for natives. For instance, to gain a fuller understanding of the sources of underrepresentation we would like to know not only whether highly educated immigrants are more likely to run for office and win than are their less educated counterparts; we should also test whether education provides the same boost for immigrants as it does for natives or whether immigrants’ educational attainment needs to exceed that of natives for these groups to achieve equality in election outcomes. In a similar vein, we should consider whether and how electoral and party contexts matter within and across groups.
Unfortunately, data constraints typically thwart such efforts. Identifying the immigrant background of elected officials—let alone their individual characteristics—is difficult, especially going back in time, and is therefore rarely done.Footnote 4 As a result of these challenges, a recent symposium on descriptive representation concluded that “Scholarship on minority representation in Europe is in its infancy” (Bloemraad and Schönwälder Reference Bloemraad and Schönwälder2013, 572). Yet, without knowledge of the personal features of immigrant and native candidates and the population as a whole, we cannot assess how much of the underrepresentation is due to the fact that immigrants tend to be poorer, less educated and younger—characteristics that usually reduce the likelihood of political engagement—and how much is accounted for by variation in the opportunity structures these groups face.
This article seeks to overcome some of these limitations. We employ unique data that cover the whole Swedish adult population over the course of two decades. Our dataset contains a host of contextual and individual-level variables, including whether an individual ran for and won local office. The data, based on government registers, allow us to annually observe over six million individuals located in 290 municipalities, spanning six election cycles between 1991 and 2010. This rich data source permits us to test the major competing hypotheses put forth in the literature.
Our central findings are twofold: First, immigrant underrepresentation is not primarily driven by group differences in the distribution of personal traits or opportunity structures. We consider variables such as education, income, employment status, age, as well as local economic conditions, socio-demographic characteristics of electorates, and electoral institutions, and find that differences in their distribution across immigrants and natives only account for a small portion of the representation gap. Rather, the return to these characteristics is much lower for immigrants than it is for natives. Second, we uncover important time trends. In the two decades under study individual resources and opportunity structures account, on average, for only one-third of the representation gap. In the early 1990s differences in these sets of factors explain a mere 16 percent of the immigrant-native representation gap, but by 2010 they explain almost 50 percent of the gap. This shift has been accompanied by enhanced electoral inclusion. In the early 1990s, natives were two and a half times more likely to win office than were immigrants, but by 2010 this number had fallen to two. Over time, then, equal cases are treated more equally, and immigrants begin securing more similar electoral rewards from their individual endowments and contextual environments.
In light of these findings—a large but decreasing representation gap and substantial but declining differences in the returns to characteristics—we turn our attention to the role of discrimination in the electoral process. Even if immigrants possess similar individual-level resources and confront identical opportunity structures, party elites and voters may harbor reservations when evaluating immigrant candidates that are absent when it comes to the recruitment and election of natives (e.g., Brouard and Tiberj Reference Brouard, Tiberj, Bird, Saalfeld and Wüst2011, Fisher et al. Reference Fisher, Heath, Sanders and Sobolewska2015, and Norris and Lovenduski Reference Norris and Lovenduski1995). As a result, immigrants may not reap the same rewards from favorable individual resources or opportunity structures as do natives. We conduct several tests to probe whether it is plausible to assume that discrimination helps account for immigrants’ underrepresentation and conclude that our results are consistent with the notion that party gatekeepers discriminate against immigrants, but that such discrimination is lessening over time.
These findings contribute to scholarship examining immigrants’ socio-political inclusion as it unfolds on the ground in several ways.Footnote 5 First, to the best of our knowledge, ours is the first article to examine election outcomes across immigrants and natives at the individual level. Moreover, we do so over a 19-year period, covering six elections, which permits us to reveal notable changes over time. Second, we go beyond comparing aggregate rates of representation among immigrants and natives and study variation at the individual level. This article is thus the first to comprehensively test resource-based accounts. Third, our access to individual level data allows us to employ a decomposition technique (widely used by sociologists and labor economists) that measures the extent to which immigrants’ underrepresentation results from differences in individuals’ characteristics and the opportunity structures they face as opposed to differences in returns to these factors.
The rest of this article proceeds as follows. We first briefly review the relevant literature, focusing on the juxtaposition of resource-based and context-based accounts. We next provide background about Sweden's postwar immigration history and of immigrants’ political inclusion and then discuss our data and methods. The empirical analysis then proceeds in two steps. We first present simple linear regressions across groups at the individual level. These demonstrate that individual resources and opportunity structures tend to have smaller effects on winning council seats among immigrants than they do among natives. To evaluate the relative importance of these factors in contributing to the representation gap we then use the decomposition technique mentioned above. This analysis reveals two things: First, differences in returns appear to be most critical in explaining immigrant underrepresentation. Second, while remaining substantial throughout, differences in returns have decreased significantly over time. In a final empirical section we assess the role of discrimination in explaining these findings. We show (i) that gains in immigrant representation are unlikely to be caused by two alternative mechanisms, changes in immigrants’ political engagement/mobilization or candidate partisanship; (ii) that native Swedes’ attitudes towards immigration have grown more tolerant as the representation gap narrows; (iii) that much of the improvement in representation is driven by those who are most likely to face discrimination, immigrants from poorer and culturally more distant regions; and (iv) that though party gatekeepers place this group of immigrants on less competitive list positions than they do natives, over time placement becomes more similar across groups. In the conclusion we discuss the implications of our findings for future research.
EXISTING RESEARCH ON IMMIGRANT POLITICAL REPRESENTATION
Existing research argues that both individual-level and contextual factors shape rates of minority representation in legislatures. At the individual level, socio-economic status (SES) has long been found to influence political participation (e.g., Persson Reference Persson2011, Wolfinger and Rosenstone Reference Wolfinger and Rosenstone1980). In addition to the direct effects of SES (which in our analyses consists of income, education, and employment) on participation, those with higher levels of SES are said to possess the civic skills that are conducive to political engagement (Verba, Schlozman, and Brady Reference Verba, Schlozman and Brady1995). Furthermore, socio-demographic characteristics such as gender and age also feature prominently in this literature. Do the same socio-economic and demographic individual characteristics that lead natives to enter politics also matter for immigrants? Prior research on immigrant-origin populations finds that age, education, income, and employment are significant predictors of political participation, though these variables do not perform as reliably among immigrants as they do among natives (e.g., Fennema and Tillie Reference Fennema and Tillie1999, Ramakrishnan Reference Ramakrishnan2005, Strömblad and Adman Reference Strömblad and Adman2010).
When socio-economic backgrounds vary systematically across groups, as they often do, these differences may go a long way in explaining differences in representation, even in the absence of discrimination based on immigrant status. As mentioned, however, because information on the individual characteristics of elected candidates is generally unavailable, existing work has not been able to address these questions definitively. Case studies do suggest that the background characteristics that promote political success among natives may not be sufficient to propel immigrants into elected office. In France, for instance, politically active and educated immigrant-origin elites that lobby for well-organized constituencies often fail to make the transition from community organizer to elected politician. Yet, this outcome is not pre-ordained. In British cities, by contrast, such individuals stand a relatively higher chance of obtaining a local council seat (Garbaye Reference Garbaye2005; Maxwell Reference Maxwell2012).
To account for these differences, research has focused on cross-national variation in political opportunity structures, such as citizenship and integration regimes. Continuing with the example just given, France's citizenship regime (open but assimilationist) supposedly discourages ethnically based campaigning whereas British multiculturalism has been said to favor such mobilization.Footnote 6 Additionally, electoral institutions may play a role. Local electoral rules place a premium on spatially concentrated, well-organized minority groups in Britain, where elections are held at the ward level. When the entire municipality forms one electoral district, as is the case in France, most Swedish municipalities, and in many other European countries, these characteristics play less of a role (Bird Reference Bird2005; Trounstine and Valdini Reference Trounstine and Valdini2008). Another prominent variable pertains to the district magnitude. As the number of available seats (per capita) rises, some have argued that party leaders may be more willing to balance the slate and to allocate spots to underrepresented minorities.Footnote 7 Additional contextual variables refer to the partisan and demographic environment: Left parties are generally more hospitable to including immigrants as candidates and as voters (e.g., Bird et al. Reference Bird, Saalfeld and Wüst2011, Dancygier Reference Dancygier2013). Further, some have maintained that liberal, well-educated voters of the majority population promote the electoral incorporation of ethnic minorities (Browning et al. Reference Browning, Marshall and Tabb1984).
While scholars have zeroed in on some of the contextual variables that may be conducive to parity in minority representation, we know much less about how individual immigrants fare in the electoral process. For example, do immigrants and natives with equal socio-economic profiles face equal chances of winning? Or do the characteristics that help the political careers of natives fail to provide the same advantages to migrants? Prior work has argued that discrimination against immigrant-origin office seekers by party elites has a significant impact on minority underrepresentation (e.g., Brouard and Tiberj Reference Brouard, Tiberj, Bird, Saalfeld and Wüst2011, Norris and Lovenduski Reference Norris and Lovenduski1995, Soininen Reference Soininen, Bird, Saalfeld and Wüst2011). This also seems to be true in the Swedish context. Interviewing 20 immigrant party activists (all prior candidates) in 1999, Blomqvist (Reference Blomqvist2005) found that immigrants expressed frustration with party leaders’ reluctance to allocate influential party posts to immigrants or to put them on winnable list positions. As one interviewee put it: Placing immigrants on top list positions is “very controversial. . .It is as if we are let into the yard but not the house.” Another concurred: “I’m skeptical that the party would ever place [immigrants] on an electable position, or a very powerful position. They use immigrant politicians, but only as tools” to capture some of the immigrant vote (Blomqvist Reference Blomqvist2005, 90; authors’ translations).
If such unequal treatment is widespread one would expect that socio-economic and political advancement do not go hand in hand, though empirical evidence on this point remains scant. Similarly, we do not know, for instance, whether natives and immigrants benefit in the same way from permissive electoral institutions. In sum, the literature has focused on individual resources and political opportunity structures as the main factors driving immigrant underrepresentation, but we do not have a good grasp of how these sets of variables shape the election chances of individual immigrants.
IMMIGRATION AND IMMIGRANT REPRESENTATION IN SWEDEN
This article begins to answer some of these questions by examining immigrant representation in Sweden. To situate our study, we now provide a brief description of Sweden's immigration history and of immigrants’ political incorporation, showing that these resemble developments found in many other European countries. The lessons we draw in this article should thus travel beyond the Swedish case.
Immigration Flows
In the postwar decades Sweden's immigrant population was, to a large extent, made up of labor migrants who had moved from the less developed parts of Europe to perform blue-collar jobs in the manufacturing sector.Footnote 8 When the oil crises hit in the 1970s, unemployment soared and demand for foreign labor dwindled. As a consequence, migration policy became harsher in many European countries, including in Sweden (Lundh and Olsson Reference Lundh and Ohlsson1999). Since the 1970s, refugees and family reunification migrants have dominated. The military coup of Pinochet in 1973, the 1979 Iranian revolution, and the persecution of the democratic movement in Poland during the early 1980s are examples of catalysts for such developments.Footnote 9
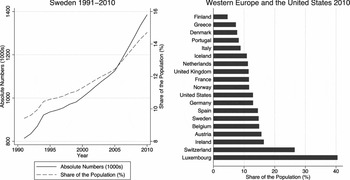
In 1991, the start date of our study, the share of the foreign born in Sweden stood at 9.4 percent, and by 2010 it had reached 14.7 percent (see Figure 1). Sweden's numbers are very similar to those of several other European countries (e.g., Germany, Belgium, Austria; the overall mean is 13.8 percent, see right panel), which have had similar migration histories, beginning with labor migration followed by refugee and family migration.
Foreign-born population in Sweden, Western Europe, and the United States

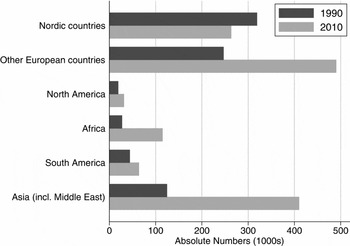
The most sizable inflow has been from Middle Eastern conflict zones, notably Iraqi refugees who constituted the largest number of migrants (over 100,000) to Sweden during this period, followed by the former Yugoslavia, Iran, Lebanon, Turkey, and Somalia (Statistics Sweden 2012). The distribution of national origins during our period of study has thus shifted, as depicted in Figure 2. The number of immigrants from the Asian region, which includes the Middle East, tripled between 1991 and 2010. In 2010, people born in Iraq and Iran together comprised nearly half of this regional category. There has also been a doubling of the number of immigrants from non-Nordic European countries. This is partly due to Sweden joining the European Union, but the main driver here was the civil war in the former Yugoslavia. Refugees from this region account for the largest group of non-Nordic European immigrants. Finally, the number of immigrants born in Africa has quadrupled during our study period, in large part due to refugee flows in the wake of the Somali civil war. We address these compositional differences in our analyses below.Footnote 10
Foreign-born population in Sweden by Region of Origin, 1990 and 2010

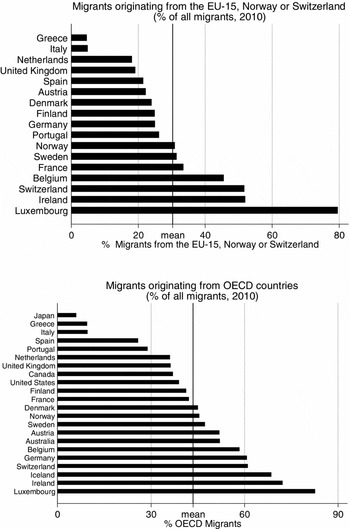
Placing these developments in comparative context, Figure 3 shows that the contemporary Swedish experience is not unusual. In 2010, 31.4 percent of Sweden's migrants hailed from Western Europe (defined here as the EU-15, Norway, and Switzerland), compared to the country average of 31.0 percent. The same year, 47.3 percent of migrants in Sweden originated from within the OECD, while the average figure in OECD countries is 43.5 percent. Moreover, just as in Sweden, in many of these countries the composition shifted with migrants coming from Western European or OECD countries comprising relatively fewer recent migrants (Messina Reference Messina2007, 39–46).
Distribution of Migrant Source Countries across Countries (2010)

Summing up, Sweden has a mix of migrants from within and outside of Europe. Like in most Western European countries, migration from the poorer and more conflict-ridden parts of the world has been substantial. Given the sustained and sizable nature of immigration, migrants have begun to make their presence felt politically as well.
Political Inclusion
Immigrant political participation has a long history in Sweden. The Voting Rights Reform of 1975 granted all residents who lacked Swedish citizenship (regardless of country of birth) but who had lived in Sweden for three or more years the right to vote and run in local elections. This reform, which has also occurred in other European countries, created a significant expansion of the electorate, especially in municipalities with a large immigrant population (Vernby Reference Vernby2013).Footnote 11 Furthermore, thanks to Sweden's relatively liberal citizenship regime, many first-generation immigrants and their descendants are Swedish citizens. In all of the analyses below we define immigrants as individuals who were born outside of Sweden and who were eligible to run for office (note that the analyses will include controls for citizenship status).Footnote 12
Turning to representation, our focus is on municipal councils. As is the case in most West European countries, councilors are elected using a party-list proportional system in at-large contests, though larger municipalities are partitioned into several electoral districts.Footnote 13
Municipalities play a large role in the provision of goods and services, including in key areas, such as social assistance, and education. Additionally, municipalities have independent taxation rights. In 2010, the average municipal income tax rate was approximately 21 percent. They also employ a large share of the labor force; in 2010 about 17 percent of the employed worked in the municipal sector. In view of these important functions, underrepresentation of minorities in local government must be considered a serious problem, potentially hampering the efficiency with which constituents’ interests are channeled, and hurting the overall legitimacy of the political system. The fact that municipal politics are a crucial springboard towards national politics in Sweden (Lundqvist Reference Lundqvist2013) further underscores the importance of studying who is elected at the local level.
Similar to the situation in many other advanced democracies, in Sweden immigrants are underrepresented in municipal politics. Some have argued that local party elites critically influence this outcome (Bäck and Öhrvall Reference Bäck and Öhrvall2004; Soininen Reference Soininen, Bird, Saalfeld and Wüst2011; Soininen and Etzler Reference Soininen and Etzler2006). Local Swedish elections operate by a party-list system, where local nomination committees largely control who gets nominated and how candidates are ranked on the list. These committees generally collect suggestions for nominees among local members and party associations.Footnote 14 Committees then put together a list that is finalized at a special meeting. Although in some party organizations rank-and-file members have a chance to make changes to the list, this rarely occurs. If changes do take place, they are typically meant to ensure a more equal representation of women. Last, most criteria for selection are informal in nature, rather than laid down by party rules, thereby permitting considerable discretion. The degree of “trust for a nominee” or a “sense of shared identity. . .can be important factors” in determining selection (Soininen Reference Soininen, Bird, Saalfeld and Wüst2011, 153; Soininen and Etzler Reference Soininen and Etzler2006).Footnote 15
Party gatekeepers are thus highly influential in deciding who is on the list and on what position. Though voters may, since 1998, cast preference votes for specific candidates, the list position still nearly exclusively determines winning. This is in part because only about one-third of voters actually cast preference votes (the remainder endorse the list as proposed by the party). Moreover, voters can cast only one preference vote which they generally award to candidates who already occupy the highest list positions. Indeed, on average, the candidate on the top spot obtains more than a third of a party's preference votes; candidates whose list position does not guarantee election only very rarely obtain preference votes (Folke et al. Reference Folke, Persson and Rickne2014).Footnote 16 Moreover, to get elected via preference votes, a candidate must obtain five percent of the party's total vote. Since the reform, candidates who were elected via preference votes (and who would not have been elected in their absence) have filled less than one percent of seats (Folke and Rickne Reference Folke and Rickne2012). For all practical purposes, then, Sweden still has a closed list system, or what some have called “closed lists in disguise” (cf. Folke et al. Reference Folke, Persson and Rickne2014, 2). This institutional setting empowers local party elites, allowing for discriminatory practices by party gatekeepers. Voter preferences for or against specific candidates within the same party will not make much of a difference in determining who ends up being elected.
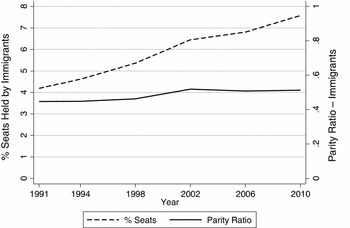
As the literature has pointed out, immigrants appear to face significant obstacles to getting nominated and elected in this setting. Our data confirm this picture, but also reveal important signs of change. Figure 4 shows that the share of seats held by immigrants has increased from 4.2 percent in 1991 to 7.6 in 2010. Since this increase outpaced the growth in the immigrant population, the parity ratio rose from .45 to .51. By 2010, then, the picture is one of steady improvements amid persistent underrepresentation. In the next section we address what factors help account for this representation gap as well as its narrowing over time.
Representation of Immigrants: Seat Shares and Parity Ratio

DATA AND METHODS
Our data combine information from various administrative registers held by Statistics Sweden. Most importantly, we have complete information on all individuals who ran for local office in the six elections that took place in Sweden's 290 municipalities from 1991 to 2010, covering approximately 13,000 council seats per election.Footnote 17 The candidacy data are then linked to population-wide registers containing information on a range of individual characteristics, such as age, gender, region of birth, family status, education, income, and residential location.Footnote 18
Our data cover all adults living in Sweden who are eligible to run for office. Natives and immigrants (irrespective of citizenship) will thus enter the dataset once they turn 18, and, in the case of immigrants, once they have lived in Sweden for at least three years. The average native appears in our dataset 4.7 times (out of a maximum of six elections), whereas the corresponding figure for immigrants is 3.7. Further, among winning candidates in 2010, natives had accumulated more political experience, having been nominated and elected more frequently than immigrants.Footnote 19 However, looking at only those who won office for the first time in 2010, natives had, on average, been nominated 0.9 times in prior years whereas immigrants had run, on average, 0.7 times, suggesting that recently immigrants who enter the electoral arena begin winning at a slightly quicker pace.
We next discuss our empirical approach (see the Online Appendix for a more detailed explanation). To explain the political underrepresentation of immigrants we employ the Oaxaca-Blinder (OB) decomposition technique (Blinder Reference Blinder1973; Oaxaca Reference Oaxaca1973), which has been widely used by sociologists and economists to study racial and gender wage gaps and discrimination in the labor market more generally (e.g., Fortin et al. Reference Fortin, Lemieux and Firpo2011, Oaxaca and Ransom Reference Oaxaca and Ransom1994, Reimers Reference Reimers1983). This technique builds on the simple idea that an observed difference in outcomes between two groups can be attributed to differences in characteristics on the one hand and to differences in the returns to these characteristics across the two groups on the other. For instance, the representation gap could be caused by immigrants possessing fewer of the resources conducive to a political career, or because individual resources of immigrants and natives are rewarded differently by voters and party gatekeepers.
In line with most other applications of the OB-decomposition technique we proceed from a simple linear model of the following type:
 $$\begin{equation}
Y_{ij} = \boldsymbol{X}_{ij} \boldsymbol{\beta} _j + \varepsilon _{ij} ,j = N,I,
\end{equation}$$
where Yij
is a dichotomous variable indicating whether individual i in group j was elected to local office in a particular election,
 $\boldsymbol{X}_{ij} $
is a vector of individual characteristics and political context factors,
 $\boldsymbol{\beta} _j $
is the vector of corresponding regression coefficients, and ε
ij
is an individual-specific residual. We choose a linear probability model over alternatives such as logit or probit partly because the statistical properties of the OB-decomposition technique are more well established in the linear case, and partly because this eases computation and interpretation (all the main results remain very similar when employing logistic regression; see the Online Appendix).
The key idea behind the OB decomposition is that we can use the results from the group-wise regressions in equation (1) to decompose the mean outcome difference between the groups into two different components, often referred to as the explained and the unexplained part. More formally, the mean outcome gap may be conveniently written as
 $$\begin{eqnarray}
{\skew5\bar Y}^N - {\skew5\bar Y}^I &=& \left( {{\skew5\bar X}^N - {\skew5\bar X}^I } \right)\beta ^* \nonumber\\
&& + \left[ {\skew5\bar X^N \left( {\beta ^N - \beta ^* } \right) - \skew5\bar X^I \left( {\beta ^I - \beta ^* } \right)} \right],
\end{eqnarray}$$
where overbars denote means and β* is a nondiscriminatory coefficient vector that would be observed in the absence of discrimination. The first term of the right-hand side of equation (2) is the so-called explained part and indicates how much of the gap is due to the two groups having different characteristics. The second term, typically called the unexplained part, captures the extent to which the gap depends on different returns to these characteristics. More concretely, in the present case the explained and unexplained parts indicate how much of the representation gap depends on natives and immigrants having different X's and how much depends on them having different β’s, respectively. Footnote 20
As should be clear from this description, the OB-decomposition technique is a complement rather than a substitute for more well-known regression approaches. The different techniques help answer different types of questions. Traditional regression analysis estimates the effect of X on Y and can indicate how much of the total variation in Y is explained by the full set of X’s. However, by further decomposing the regression results we can also estimate the relative importance of various observed and unobserved factors in explaining the overall variation in Y.
Further, while matching would be a useful tool for uncovering how much of the representation gap is due to unobserved factors (such as discrimination), the basic logic of creating a matched sample of individuals who are similar on the observables makes the technique less suitable for answering questions about how much of the representation gap is due to differences in observables across groups. In other words, matching won't be able to tell us the relative importance of the explained and unexplained part in accounting for the overall representation gap. Though we do not employ matching as our main technique for this reason, we nonetheless use it to check the robustness of our OB findings regarding the unexplained part (see below).
In the present study we use the decomposition method to examine to what extent the representation gap between natives and immigrants is due to differences in characteristics between the two groups or due to the two groups having different returns to these characteristics. The unexplained part in our model can be interpreted as the expected difference in the probability of becoming elected to local office for natives and immigrants with identical observed individual characteristics and political opportunity structures. Correspondingly, we conceptualize discrimination broadly, as equal cases being treated differently on the basis of their immigrant status (cf. Pager and Shepherd Reference Pager and Shepherd2008, 182). We should also note, however, that though the unexplained part is often attributed to discrimination, in practice it also captures unmeasured variables that may be relevant in producing gaps across groups. We address this issue below by providing several mechanism probes that support the plausibility of the interpretation that discrimination is at work.
EMPIRICAL RESULTS
We conduct the analysis in two steps. Before turning to the decomposition we present simple linear regressions that examine how standard individual-level characteristics and political opportunity structures affect the likelihood of obtaining office, and how these effects vary across groups and over time. In the second step, we use these regression results to decompose the overall representation gap into theoretically relevant components as just outlined.
Note that since winning and being nominated on an electable list position are so closely linked—candidate success depends in large part on the list position—we only discuss results on winning. We repeated the analyses for nomination as well, and the results are similar to the ones we present below (see the Online Appendix).
What Factors Account for Getting into Office?
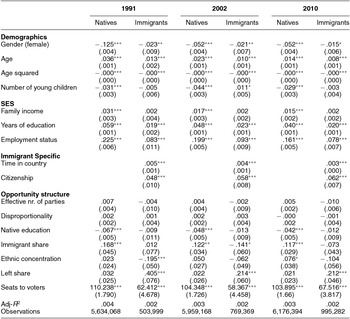
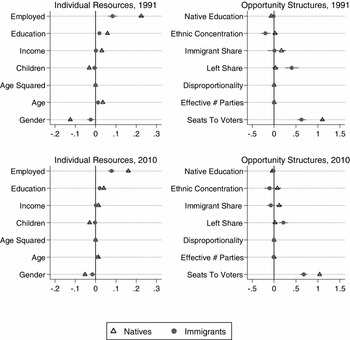
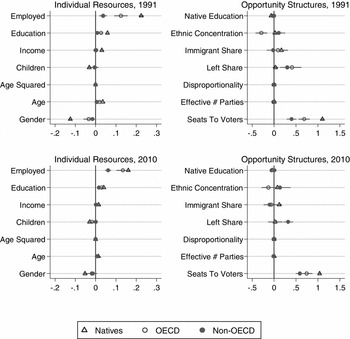
We begin our analysis by running separate regressions for natives and immigrants for each of the six elections held during the period 1991 to 2010. The dependent variable is a dichotomous variable indicating whether or not a particular individual was elected. For reasons of space Table 1 only displays the regression results for the elections held in 1991, 2002, and 2010 (the results for the remaining elections follow the overall pattern). To ease interpretation, Figure 5 depicts these results graphically for 1991 and 2010 (see the Online Appendix for summary statistics).
Determinants of Election to City Councils in Swedish Municipalities across Groups

Notes: The dependent variable is a dummy indicating whether an individual won election. OLS coefficients; standard errors in parentheses. Significance levels: *p = <.05; **p = <.01; ***p = <.001.
Determinants of Election to Municipal Councils

To gauge the importance of individual resources we include the standard set of independent variables, such as Gender (an indicator for female), Age (in years), Age squared, Number of Children (under the age of 11), Employment Status (1 for employed individuals, 0 for all others), Family Income (the log of equivalized disposable household income), and Years of Education. For immigrants we further include Time in Country (measured as years of residence in Sweden) and Citizenship (coded 1 if immigrants are Swedish citizens and 0 otherwise). Both of these variables are expected to have a positive effect on representation (Bird et al. Reference Bird, Saalfeld and Wüst2011).
The demographic and socio-economic variables largely behave as one would expect. Among natives, being male, middle-aged, and employed raises the probability of election (interestingly, being female has less of a negative effect among immigrants). Increases in education and income also make it more likely that native Swedes win elections, while having young children has the opposite effect. Turning to immigrants, we observe that, all else equal, length of residence and citizenship are positively related to the probability of being elected. As for the common demographic and socio-economic variables all coefficients estimates point in the same direction, but effects tend to be smaller among immigrants. For example, in 1991 being employed is associated with a .22 percentage point increase in the probability of winning a seat among natives, but the effect for immigrants is only .08. Likewise, an additional year of schooling raises the probability of election by .06 percentage points among natives, but is only associated with a .02 point increase among immigrants. The results also show, however, that these differences narrow over time. By 2010, the gains from an additional year of education have shrunk to .04 points for natives, but remain at .02 for immigrants.
The overall trends are broadly supportive of the notion that individual-level endowments yield higher returns among natives: The same rise in income or education, for instance, is associated with a larger increase in the probability of winning among natives. Formal tests (available upon request) reject the hypothesis that the estimated effects of individual level characteristics are equal across groups (see also Figure 5). At the same time, these dynamics become less pronounced over time. More recently, the electoral process appears to treat immigrants and natives who possess equal individual characteristics more equally, even though substantial differences persist.
Based on prior research we should also expect minority political representation to depend on a number of opportunity structure covariates at the contextual—in our case municipal—level, such as party systems, electoral rules, and the size and ethnic composition of the immigrant group. To measure the opportunity structure, we operationalize some of the main concepts mentioned in the above-cited literature (cf. Bird et al. Reference Bird, Saalfeld and Wüst2011). With regard to the electoral system, Seats-to-Voters is the ratio of council seats to the electorate; Effective Number of Parties Footnote 21 indicates the (adjusted) number of parties with seats in the local council; and Disproportionality Footnote 22 measures the difference between party vote and seat shares. Together, these variables capture the openness of the electoral system, with increases in seats per voter and in the number of parties and decreases in disproportionality denoting more permissive contexts. Left Share Footnote 23 measures the percentage of votes received by leftist parties.Footnote 24 Turning to the demographic composition of the local electorate, Native Education is the average years of education among natives in the electorate, Immigrant Share indicates the percentage of foreign born in the electorate, and Ethnic Concentration measures the concentration of the immigrant group with respect to country of origin.Footnote 25
Disregarding for the moment the estimated effects of Seats-to-Voters, Table 1 shows that the contextual variables do a fairly poor job of explaining between-municipality variation. Effective Number of Parties and Disproportionality are insignificant for both immigrants and natives. The partisan landscape appears to matter more: Immigrants are more likely win office as support for leftist parties increases. Yet, considering that the coefficient provides the estimated change in election chances for a change from no left party votes to all left party votes the effect is quite modest. The share of educated natives primarily has a negative influence on the election chances of natives. However, taking the cross-municipality variation of this factor into account (sd. = 0.65) this effect size should also be deemed modest.
With regard to the local immigrant composition, the main pattern is one of different but small effects across groups—positive among natives and negative among immigrants. These findings may at first appear counterintuitive. Note, however, that even though there is a positive relationship between the share of immigrants in the population and the share of immigrants among elected councilors at the municipality level (not shown), if the share of seats held by immigrants does not rise in direct proportion to the immigrant population—that is, if the elasticity of the share of immigrants among the elected to the share of immigrants in the population is less than 1—obtaining a seat on the council becomes more difficult for an immigrant as the number of fellow migrants increases. In our sample this elasticity is consistently below 1.Footnote 26
Turning at last to Seats-to-Voters, the effect of this variable dwarfs the effects of the other opportunity structure covariates. Given that the size of the local assembly does not perfectly reflect the number of voters in a municipality there will be a strong and mechanic negative relationship between the size of the electorate and the chance of getting elected. More precisely, since the ratio of council seats to the electorate is equivalent to the overall probability of being elected the interesting question is not whether or not the estimated effect of this variable is significantly different from zero. The null hypothesis should instead be that the ratio of seats to the electorate is related to election chances within different subgroups of the electorate in a one-to-one fashion. In other words, when discrimination at the group level is absent, getting elected becomes a simple accounting exercise: As more seats are available per voter, the probability of election increases, and it does so in identical fashion across groups.
We can reject this null hypothesis in all elections. In the native sample the effect of Seats-to-Voters is slightly larger than 1, implying that the reason why natives stand better chances in some municipalities than in others is almost entirely due to the fact that the ratio of seats to voters varies across municipalities of different size. This is also important among immigrants, but much less so. Whereas a one-percentage-point increase in Seats-to-Voters is expected to raise the probability of election by more than one percentage point for natives, the corresponding estimate for immigrants is only two-thirds of a percentage point.
To summarize, the results in Table 1 tell us a great deal about how individual resources and local opportunity structures matter for natives and immigrants seeking elected office. Many variables have stronger effects among natives, furnishing preliminary evidence that similar individual or local characteristics do not yield the same returns across groups. To better evaluate this question and to assess the relative importance of the two sets of factors in explaining the representation gap we next turn to the decomposition technique outlined earlier.
What Factors Account for the Representation Gap?
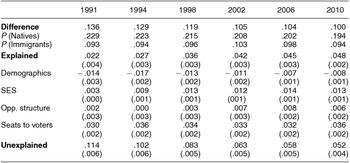
Table 2 presents the results of the Oaxaca-Blinder decomposition of the representation gap.Footnote 27 In the first three rows we observe significant gaps in the probability of election across groups. In 1991, natives were about two and a half times more likely to be elected than were immigrants (.23 percent vs. .09 percent), but the representation gap shrank by more than a quarter between 1991 and 2010—from .14 to .10 percentage points. Yet, by 2010 natives were still twice as likely to be elected as were immigrants. We do see convergence over time, but a notable representation gap remains.
Oaxaca-Blinder Decomposition Results 1991–2010
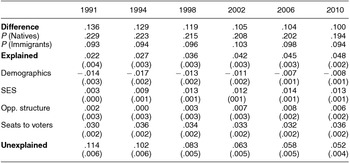
Notes: The first row reports the percentage point difference in winning a council seat across groups. The second/third row reports the percentage of natives/immigrants winning a seat. The second block (“Explained”) reports the size of the representation gap that is due to differences in characteristics, and the third block (“Unexplained”) reports the size of the representation gap that is attributable to differences in returns to characteristics. For included covariates, see Table 1. Standard errors are in parentheses.
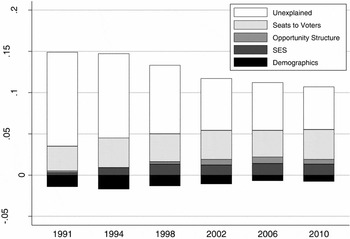
In the following rows we report estimates of the explained and unexplained parts of this gap. We have further decomposed the explained part into four broad factors included in the previous regressions: Demographics (age, age squared, gender, and number of young children); Socio-Economic Status (SES) (education, employment status, and income); Opportunity Structure (number of parties, disproportionality, native education, immigrant share, ethnic concentration, and left share); and Seats-to-Voters. We consider Seats-to-Voters as part of the political opportunity structure, but because its effect is so much larger we present it separately here.Footnote 28
Differences in these observable characteristics only account for 16 percent of the representation gap in 1991 (.022 out of the total .136 percentage point difference). That is, the fact that immigrants and natives feature different individual characteristics or face varying opportunity structures hardly contributes to immigrants’ political underrepresentation. Instead, the bulk of the gap is due to different returns to the various independent variables across the two groups. Put differently, in 1991 immigrants faced substantial barriers to entering electoral politics, and most of these barriers (84 percent) were attributable to differences in returns to observable characteristics. Over time, however, the unexplained portion of the gap decreases considerably. By 2010, differences in average characteristics account for nearly half of the immigrants’ underrepresentation.
A closer look at the results provides further insights. The negative contribution to the representation gap of demographics implies that differences in age, gender, and family size between natives and immigrants have, if anything, worked to the benefit of the latter group. The relative importance of differences in socio-economic factors has increased somewhat over time, albeit from a low level. Likewise, most of the variables derived from the opportunity structure literature do not explain very much of the representation gap. Although these variables become slightly more important over time, they still account for only 6 to 7 percent of the overall gap at the end of the period. The most consequential contextual variable is instead Seats-to-Voters. In 1991 about 22 percent of the overall representation gap is attributable to this variable. In 2010 this figure reached 36 percent.
Figure 6 displays these patterns and summarizes the findings. The sources of the representation gap have shifted over the years, from differences in returns to basic socio-demographic factors at the beginning (the unexplained portion typically attributed to discrimination), towards a situation where group differences in the distribution of these characteristics are increasingly influential. Specifically, the fact that immigrants, more so than natives, live in large municipalities with low seats-to-voter ratios has become more important.
Determinants of the Native-Immigrant Representation Gap; Results from the Oaxaca-Blinder Decomposition

In line with these results, we also find that a significant and negative immigrant effect remains when we match immigrants and natives on all the variables included in Table 1 (except for Citizenship and Time in Country), but that this immigrant penalty declines substantially over time. With the matching technique, the magnitude of the immigrant effect decreases by almost two-thirds between 1991 and 2010, which corresponds fairly well with the drop in the unexplained part found when using the OB decomposition (see the Online Appendix).Footnote 29
IS DISCRIMINATION AN IMPORTANT DRIVER OF THE REPRESENTATION GAP?
In this section we probe whether it is plausible to assume that discrimination by party gatekeepers is at least partly responsible for the sizable unexplained portion of the representation gap. Our main strategy will be to turn from the cross-sectional evidence that we have thus far relied on to movements in the unexplained portion of the representation gap over time. Stated differently, we view the unexplained part as an estimate of the upper bound of discrimination and now investigate whether discrimination is a plausible explanation for why and how this estimate changes over time.
To do so, we assess five mechanisms: First, we examine a competing hypothesis, namely that increased political interest and participation among immigrants leads to a narrowing of the representation gap. Second, we discuss the possibility that the decrease in the representation gap is due to trends in the electoral success of parties that are more inclusive of immigrants. Third, we turn to the behavior of natives and provide three pieces of evidence that are consistent with the notion that discrimination is critical but also declining over time. First, we show that native attitudes towards immigrants are relatively hostile, but that they have become more favorable over time. Next, we demonstrate that immigrants who encounter more discrimination in other realms—those from less developed and culturally more distant countries—are also less likely to win office, but that their chances have improved. Last, we show that party gatekeepers are prone to placing immigrants on unfavorable list positions. Yet, this bias diminishes over the years, making it more likely that nominated immigrant candidates actually win office.
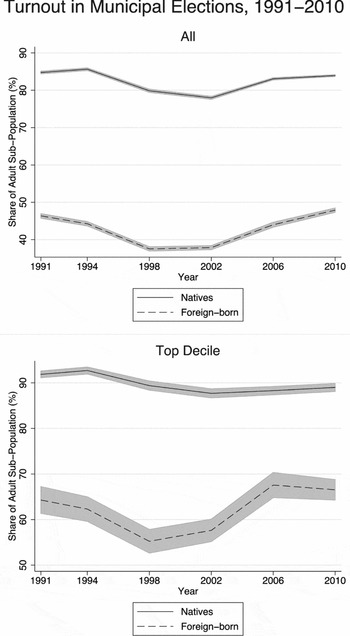
Though we conceptualize discrimination broadly as equal cases being treated unequally in the electoral process, the unexplained part of the OB decomposition captures all unobserved heterogeneity, not just variation caused by unequal returns to the socio-demographic and human capital variables we include. That the unexplained part diminishes from 84 to 52 percent could thus be related to immigrants becoming more actively involved in electoral politics as they become permanent settlers. Rising immigrant political interest and mobilization could pave the way for greater representation. This alternative hypothesis is, however, not borne out by immigrants’ electoral behavior. Specifically, as Figure 7 shows (upper panel), we actually observe a decline in turnout levels from 1991 to 2002, precisely the time when immigrant representation increases most noticeably. Similar to trends among natives, immigrant turnout rates do not return to 1991 levels until 2010. Moreover, if political interest and mobilization were important drivers of representation, we would expect the relative turnout of immigrants (compared to natives) to increase over time. As can be seen in Figure 7, however, this is not the case. Finally, existing research suggests that, if anything, changes in immigrant representation drive immigrant turnout. Scholars have found that immigrant candidates in Sweden tend to mobilize the co-ethnic vote (Blomqvist Reference Blomqvist2000; Reference Blomqvist, Bäck and Soininen2004; Schierenbeck and Schütt Reference Schierenbeck, Schütt, Bäck and Soininen2004), and that knowing that fellow countrymen run for office has a strong positive effect on turnout among immigrants (Bäck Reference Bäck, Bäck and Soininen2004).
Native and Foreign-Born Voter Turnout in Municipal Elections as a Share of Each Sub-Population

It is unlikely, then, that changes in immigrant mobilization can account for large portions of the unexplained variation. Furthermore, we may think of turnout as proxying political interest and investigate whether political interest rises among those who may plausibly win a council seat. To do so, we restrict the sample to immigrants and natives who are most likely to win office. For our sample, we rely on the previous regression results (Table 1) to predict the likelihood of winning office (separately by group) and then keep the top decile within each group. Among this group, we again observe that immigrant turnout declines as gains in representation rise (lower panel). Though the turnout gap narrows towards the end of the period, increases in immigrant representation precede this trend. It is not the case, then, that shifts in political interest parallel shifts in representation.
Another hypothesis is based on partisanship. If the propensity of immigrants to run for certain parties is higher than that of natives, immigrants’ electoral success will vary with the success of those parties. We therefore examined immigrant candidates’ partisanship and found that throughout the study period, the Left Party, the Social Democratic Party, and the Green Party have been most inclusive of immigrant candidates (see the Online Appendix). Our analyses thus already control for this alternative explanation. Though we find that immigrants were more likely to become elected in areas where voter support for these parties was higher (see Table 1 and Figure 5),Footnote 30 the decomposition (Table 2 and Figure 6) reveals that the opportunity structure variables, of which the leftist parties’ vote share is part, explain only a small fraction of the representation gap.
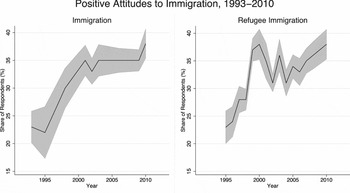
We now turn to the behavior of natives. The first plausibility test relates to the attitudinal context. If discrimination in the electoral process is significant but decreasing, it is reasonable to assume that such trends should also be reflected in mass attitudes. Sensing a more tolerant electorate, party elites may be more willing to run immigrant candidates, and voters are more likely to elect them. Survey data confirm this conjecture. Figure 8 depicts the percentage of respondents surveyed in nationally representative polls who stated that current levels of overall and refugee immigration should be maintained or increased.Footnote 31 Even though large segments of the population still hold anti-immigration sentiments, tolerance has increased significantly.Footnote 32 The trend was most pronounced during the 1990s (paralleling increases in the parity ratio). In the aftermath of the September 11 attacks it was temporarily halted, but since then acceptance of immigration has continued to rise.
Percentage of Respondents Agreeing that Sweden Should Increase or Maintain Current Levels of Immigration and Refugee Immigration

These attitude trends are in line with the idea that discriminatory behavior is becoming less prevalent. Yet, tolerant survey responses do not necessarily imply tolerant behavior (Hainmueller and Hopkins Reference Hainmueller and Hopkins2014). In a further mechanism probe we therefore disaggregate our results by the immigrant population. If native Swedes become less likely to discriminate against immigrant office seekers we should observe improvements in representation as well as an equalization of returns to endowments across different types of groups. More precisely, national origin (and the associated cultural differences) should matter less over time. Previous research has shown that immigrants in Sweden originating from less developed countries tend to experience greater discrimination. For example, in field experiments applicants with Arabic names had a lower probability of succeeding when applying to rent a flat than did observationally equivalent applicants with Swedish sounding names (Ahmed and Hammarstedt Reference Ahmed and Hammarstedt2008; Bengtsson et al. Reference Bengtsson, Iverman and Hinnerich2012). Surveys of self-perceived discrimination likewise show that respondents born in non-OECD countries (in Africa, Latin America, and the Middle East) report more instances of discrimination than those born in OECD countries (Lange Reference Lange2000, Myrberg Reference Myrberg2007).Footnote 33
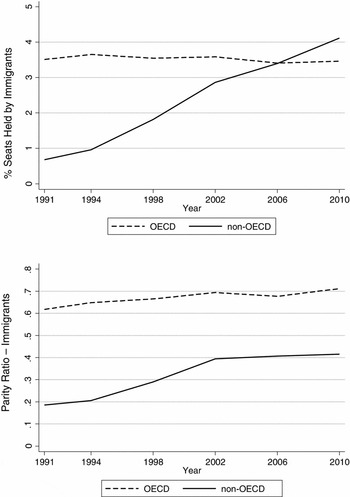
If we are correct that decreases in discrimination help explain the reduction of the representation gap, our results should not be driven by Finns and Norwegians winning office, but should apply to immigrants from less developed countries. In fact, when we break down the immigrant category into those originating from OECD vs. those hailing from non-OECD countries,Footnote 34 we find that the narrowing of the gap is largely caused by immigrants from outside the OECD. At the beginning of the period, natives were 6.5 times more likely to win a seat on the city council than were immigrants from relatively poorer countries, but by 2010 this gap was down to 2.5. Figure 9 (upper panel) shows the steep climb in the share of municipal seats held by non-OECD immigrants. The rising parity ratio (lower panel) indicates that the improvements in representation are not simply due to the population growth of this group (note that the electorate from OECD countries declined slightly while its seat share has remained steady).
Representation of Immigrants: Seat Shares and Parity Ratios across Immigrant Groups

We also observe convergence in the factors associated with representation. When regressing individual resources on election, Figure 10 (which is analogous to the results in Table 1 and Figure 5 above) does demonstrate that individual resources and the seats-to-voter ratio have the smallest effect among non-OECD migrants. This result is not surprising given existing research on origin-based discrimination. However, these group-based differences diminish over time. When running the OB decomposition on non-OECD immigrants (see the Online Appendix) we find comparable results: The unexplained part decreases considerably, accounting for 82 percent of the gap in 1991 and for 56 percent in 2010. These results are consistent with the notion that voters and gatekeepers are becoming more willing to support immigrant candidates.
Determinants of Election to Municipal Councils

In a final probe, we shed further light on this idea by examining nomination decisions of party elites. As mentioned, lists are relatively closed: Voters cannot influence the list composition, and they usually cannot alter the ranking of specific candidates on the list via preference votes.Footnote 35 If discrimination has an impact on immigrants’ chances of being elected, a proximate cause will therefore lie in the local party's nomination and ranking decisions. Research is scant, but, as mentioned earlier, interview studies have documented prejudice and discrimination against immigrants in some Swedish local party organizations (Blomqvist Reference Blomqvist2005; Soininen Reference Soininen, Bird, Saalfeld and Wüst2011; Soininen and Etzler Reference Soininen and Etzler2006). Such negative attitudes may well have an impact on immigrants’ decision on whether or not to become a member and on their commitment to the local party organization and may therefore present a hurdle to equal representation. According to Soininen (Reference Soininen, Bird, Saalfeld and Wüst2011) candidate selection committees are often unwilling to place immigrants on party lists, especially in high positions, because of prejudice among themselves, or among local party members and voters (cf. Norris and Lovenduski Reference Norris and Lovenduski1995).
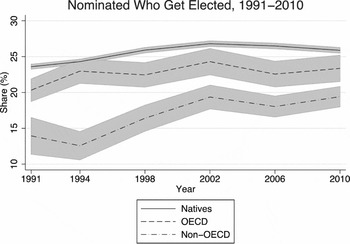
Do party leaders place immigrants on less desirable seats? Since preference votes have only very rarely influenced candidates’ entry into town halls, we can answer this question by inspecting whether nominated immigrants stand less of a chance of winning than do nominated natives (we do not have information on candidates’ list position). As discussed above, winning office is nearly impossible for candidates who are placed on low list positions, and low list placement has been a source of frustration among immigrant candidates. If nominated candidates improve their chances of winning, this, in turn, implies that they have been placed on more attractive positions. Figure 11 indeed suggests that immigrant candidates, especially those originating from outside the OECD, are less likely to win office. In 1991, only 14 percent of non-OECD immigrant candidates won seats compared to 20 percent of OECD immigrants and 24 percent of native candidates; non-OECD immigrants were rarely placed on competitive list positions. By 2010 it still remains difficult for this group to cross the electoral hurdle, but the gap with natives has lessened considerably. These results are in line with the qualitative work cited above as well as with our quantitative trends: Discrimination by party gatekeepers against immigrant office seekers appears to play a critical but diminishing role in immigrants’ political underrepresentation.
Percentage of Winning Candidates among those who are Nominated, by Sub-Group

To summarize, trends in immigrants’ political engagement, in natives’ tolerance, and in nomination and election outcomes of immigrants hailing from poorer and culturally more distant countries support the notion that changes in discrimination help explain changes in immigrant representation.
DISCUSSION AND CONCLUSION
Though the political underrepresentation of immigrants is marked and widespread, the sources of this disadvantage are not well established. Investigating six election cycles spanning nearly two decades, 290 municipalities, approximately 13,000 seats, and over six million individuals per election, this article is the first to examine what factors drive the immigrant-native representation gap by drawing on individual-level data covering the entire adult population of one country, Sweden.
Existing resource-based explanations receive little support in our analysis. Specifically, differences in groups’ income and education levels are not critical variables. This finding implies that integration is not a linear process, where incorporation in the economic realm leads to incorporation in the electoral realm. By contrast, length of residence and citizenship reduce the representation gap.
Accounts of immigrant underrepresentation that draw attention to the broader opportunity structure—consisting of party systems, electoral rules, and other context-level factors—receive mixed support. While variables relating to the type or number of local parties do not matter much, we do find that immigrants’ greater likelihood to live in more densely populated urban areas—a feature that characterizes immigrant settlement across Europe—where fewer seats are available per voter has become increasingly important in contributing to their political underrepresentation. Though these municipalities are also more likely to be populated by more educated natives who generally exhibit more tolerance towards immigrants, our analyses indicate that increases in the size of the native educated electorate do not substantially raise immigrants’ election chances. It may therefore be reasonable to conclude that immigrants’ settlement patterns significantly influence their political careers. In light of this, one relatively easy fix is to increase the size of municipal councils such that the number of seats in urban municipalities reflects more closely the size of the electorate.
If differences in opportunity structures (with the exception of the ratio of seats to voters) and individual resources explain relatively little, then what does? To answer this question, we employ a decomposition technique that has been widely used to study economic disparities and that, we think, holds promise in the study of political inequality. Using this approach, we reveal that immigrants earn lower returns to many of the individual-level resources and political opportunity structures that increase the probability of election. This evidence suggests that discrimination may be a significant driver of immigrant underrepresentation. To further probe the plausibility of this interpretation we examine several mechanisms. Trends in immigrants’ political behavior, native attitudes, and in election outcomes and list positions across immigrant candidates that vary in their cultural backgrounds all point toward discrimination by party leaders being an important but declining force in immigrants’ political underrepresentation.
Since party gatekeepers are critical actors determining selection in the major parties across virtually all Western European countries, we expect our findings to resonate beyond the Swedish case. They should be particularly relevant in countries where the immigrant population is similar in size and composition to that in Sweden, and where it is difficult for voters to significantly reorder candidate rankings via preference votes. Such countries include Austria, Finland, France, the Netherlands, and the UK (on local electoral systems, see van der Kolk Reference van der Kolk2007). Moreover, to the extent that more populated, urban areas also have a lower ratio of seats to voters, we expect our findings pertaining to this ratio to be relevant across Western Europe, where migrants have predominantly settled in urban areas.
Future work can extend our research in several ways. First, our results indicate that party gatekeepers discriminate by placing immigrants on less desirable list positions, but they cannot speak to the question of whether local party elites discourage immigrants from running in the first place. However, we can build on our results by surveying the expectations and experiences of immigrants: Are immigrants less likely to make the initial decision to run and, if so, is this reluctance driven by expectations of discrimination? Further, do immigrants who have run for office report unequal treatment by party gatekeepers? A random sample of the foreign-born population would not capture a sufficiently large number of immigrants who consider competing for office, but our results allow us to restrict this sample to those individuals who possess the characteristics that are associated with running and winning, as revealed by our analyses.Footnote 36 A follow-up study of these potential candidates is currently underway.
Second, though we have focused on proximate causes of immigrants’ underrepresentation, the fact that residential patterns are increasingly important speaks to the wide-ranging role of discrimination. It is very likely that structural barriers and discrimination contribute to housing differences between natives and immigrants.Footnote 37 Assessments of discrimination that are based on variables which are themselves partly caused by discriminatory practices in other realms (such as housing or employment) will consequently provide a conservative, lower bound estimate. We therefore recommend that future studies adopt a more comprehensive perspective when considering the sources of minority political underrepresentation. Such an approach should also be attuned to cross-national differences. Sweden's liberal and multicultural citizenship regime may be associated with party elites that are comparatively more open to including immigrant candidates compared to regimes that are more assimilationist. Though it remains difficult to test such hypotheses definitively, replication of our work in other contexts may illuminate how contextual factors at the national level come into play.
Our research has helped show that a rich set of individual characteristics and contextual variables fails to explain much of the immigrant-native representation gap. This finding has troubling implications, not only for research on immigrant representation, but also for organizations and policy makers seeking to address this issue. In view of our results, one key priority needs to be to establish more precisely the extent and nature of discrimination in the electoral process.
SUPPLEMENTARY MATERIAL
To view supplementary material for this article, please visit http://dx.doi.org/10.1017/S0003055415000404.








Comments
No Comments have been published for this article.