


Introduction
Social disadvantage shapes the distribution of a wide range of health outcomes, including cardiovascular disease [Reference Mensah1], cancer incidence and all-cause mortality [Reference Adler and Rehkopf2]. The impact of social disadvantage on health is frequently captured using indicators of socio-economic position (SEP) such as income, education and occupation [Reference Galobardes, Oakes and Kaufman3], and related measures such as subjective social status (SSS) [Reference Singh-Manoux, Adler and Marmot4]. Estimating the effects of social disadvantage is challenging because no single measure can fully capture the multi-dimensional relationship between SEP and health, and these measures may not be interchangeable across populations, cohorts or the life course [Reference Chandola, Kumari and Marmot5].
These issues are particularly pronounced for infectious disease researchers attempting to utilise the measures of social disadvantage. Surveillance data, for example, are typically lacking individual-level data necessary to capture the impact of social disadvantage on infection outcomes while controlling for potential confounders such as age and household composition. Thus, infectious disease researchers responding to the call for a greater incorporation of social measures into their studies [Reference Noppert, Kubale and Wilson6, Reference Cohen, Wilson and Aiello7] are faced with both data and measurement challenges. Nevertheless, consistent positive associations between social disadvantage and risk have been observed with certain infectious diseases such as human immunodeficiency virus [Reference Holtgrave8], tuberculosis [Reference Berzkalns9–Reference Oren11] and pandemic influenza [Reference Quinn12]. More recently, social disadvantage has been shown to be a risk factor for chronic infections with pathogens such as cytomegalovirus, herpes simplex virus type-1, Helicobacter pylori (H. pylori) and Chlamydia pneumonia (C. pneumoniae) [Reference Dowd, Aiello and Alley13–Reference Zajacova, Dowd and Aiello18].
There are several mechanisms by which social disadvantage may be linked to acute illnesses. Common social epidemiologic frameworks suggest that individuals experiencing increased levels of social disadvantage may be more likely to live and work in environments where they may be more exposed to infections, with fewer resources available to cope with these infections. However, because social factors have long been considered an unimportant part of the ecology of acute infections, research into the social determinants of susceptibility to acute infections such as seasonal influenza is less common and often focuses on access to preventive interventions rather than upstream causes [Reference Cordoba and Aiello19].
The purpose of the current study was to test whether social disadvantage could predict the incidence of acute respiratory illness (ARI). We used data collected from the Household Influenza Vaccine Evaluation (HIVE) Study designed to evaluate vaccine effectiveness and examine influenza transmission in households. We hypothesised that increasing social disadvantage, at both the individual- and household-level, would be associated with increased incidence of ARI.
Methods
Participants
This study is a secondary analysis of data collected during the 2014–2015 season of the HIVE study. The HIVE study, based on the landmark Tecumseh Study of Respiratory Illness [Reference Monto and Ullman20], is an ongoing, prospective cohort study of households with children in and around Ann Arbor, MI. Eligible households with ⩾3 members, including ⩾2 children <18 years, were identified, recruited and enrolled from June through September 2014 and followed for incident ARI from October 2014 through May 2015, as previously described [Reference Petrie21]. Adult household members provided written informed consent for participation for themselves and their children; children 7–17 years provided oral assent. All study visits were carried out at the University of Michigan School of Public Health (UM-SPH). Surveys were administered using online survey software (Qualtrics; Provo, UT). The University of Michigan Medical School institutional review board reviewed and approved the study.
Predictor variables
We explored social and workplace disadvantage at both the individual and household level. We used SSS as a proxy measure of social disadvantage. At enrolment, adult household members reported household SSS, using a nine-point ladder question adapted from the MacArthur scale of SSS [Reference Adler22]. This value was assigned to each household member. Prior to analysis, we examined the distribution of SSS and categorised individuals and households as above, at or below the median value of SSS.
Workplace disadvantage was measured using individual responses to a series of questions regarding the work environment. Adult household members were queried about work outside the home, and working adults were asked to state their level of agreement (on a five-point Likert scale) with three items that characterise workplace-related acute illness policies and exposure risks. These items were: (1) Employees are discouraged from coming to work when they have flu symptoms, (2) Employees are encouraged to go home if they have flu symptoms at work and (3) I have a lot of control over when I can schedule days off from work for illnesses or doctor appointments (Table S1). Importantly, workplace sick leave policies have been shown to be a critical component of SES and an important factor affecting differential exposure to pathogens [Reference Kumar23]. We aggregated the responses to these questions to create a composite workplace disadvantage score which was categorised in quartiles. Only working adult respondents were included in individual-level models of workplace disadvantage.
For household-level analyses, we used reported household-level SSS. We also averaged all of the working adult respondent scores in each household to create an average household workplace disadvantage score, which was then categorised into quartiles. We believe the household-level analyses are complementary to the individual-level analyses. It allowed us to explore additional predictors of ARI (e.g. number of children and household size).
Outcome
The primary outcome of interest was the seasonal incidence rate of ARI. ARI surveillance was carried out from October 2014 through May 2015. Households were instructed to report all ARI at illness onset and were queried weekly to identify newly onset ARI. Case definitions for eligible illnesses were defined by symptoms tailored to individuals ⩾3 years of age and children <3 years of age. For individuals ⩾3 years of age, incident ARI was defined by reporting two or more of the following symptoms: cough, fever/feverishness, nasal congestion, chills, headache, body aches or sore throat. For children <3 years of age, incident ARI was defined by reporting two or more of the following symptoms: cough, fever/feverishness, runny nose/congestion, difficulty breathing, fussiness/irritability, fatigue or loss of appetite.
Additional variables
At enrolment, study participants reported demographic characteristics and health history (e.g. comorbid conditions). They also reported the total number of individuals living in their home as well as whether each individual worked outside the home or attended school or childcare. Participants >16 years old were also asked to report how often they smoke cigarettes (not at all, some days, every day). Given that the survey was administered upon enrolment in the study, there were no missing values on either SSS or covariates.
Statistical analysis
We first described the SSS and workplace disadvantage score by both individual and household characteristics using Student's t tests to compare the mean score for dichotomous variables and ANOVA models for variables with multiple categories. We then plotted distributions of the number of ARI per individual by age category, and sex. We also plotted the distribution of ARI per household by total number of people and number of children <5 years old.
We estimated the association between SSS and workplace disadvantage using Poisson regression models. Individual- and household-level models were run separately. At the individual-level, we used mixed-effects Poisson models including a random intercept for household to account for correlations in ARI reporting and SSS between household members [Reference Bolker24]. We report the fixed-effect estimates from these models as an estimate of the incidence rate ratio (IRR) for each covariate. The percentile method was used to construct bootstrap confidence intervals for each of these fixed-effect estimates using 1000 resampling frames [Reference Davison and Hinkley25]. Household-level effects of SSS and workplace disadvantage on ARI incidence were estimated using negative binomial models for count data.
All analyses were conducted in R version 3.4.3. IRR and 95% confidence intervals (CIs) were estimated using the lmer4 package. A two-sided P-value of 0.05 was used to determine statistical significance.
Results
Study population characteristics
In total, 1431 individuals from 340 households participated in the HIVE study during the 2014–2015 season. Overall, 60% of the study population were children <18 years old and 36% were adults 18–49 years old. SSS ranged from 1 to 9 and the median was 7 (IQR 6–7). The age distribution of households differed by SSS category (P = 0.01), but no differences were observed in the proportion of males or in the proportion working or attending school or childcare outside the home (Table 1).
Number and proportiona of individuals by tertile of subjective social status and quartile of workplace disadvantage score

a The per cent of the column total
b P-value from χ 2 test, or Fisher's exact test when individual cell sizes are less than n = 10.
Three hundred and eighty-four working adults responded to the survey and answered questions about their workplace environment. The workplace disadvantage score ranged from 1 to 15 and the median was 6 (IQR 4–7). Of the 340 households participating in the study, 262 (86%) included at least one working adult who responded to the workplace disadvantage questions. The majority of the households had four members (range 3–9), households in the lowest tertile of SSS were disproportionately large (P = 0.02) compared with those with higher SSS (i.e. greater proportion of households with ⩾5 individuals). The majority of households (58%) had no children under 5 years of age (Table 2).
Number and proportiona of households by tertile of subjective social status and quartile of workplace disadvantage score

a The per cent of the column total.
b P-value from χ 2 test, or Fisher's exact test when individual cell sizes are less than n = 10.
Distribution of ARI by individual- and household-level characteristics
Overall there were 1362 ARI reported among 1431 individuals in the study (mean # of ARI events = 0.95, 95% CI 0.88–1.02). Figure 1 presents the distribution of ARI by individual- and household-level factors. Children 0–4 years old had the highest frequency of ARI (mean 1.53, 95% CI 1.28–1.78), followed by children 5–11 years old (mean 0.94, 95% CI 0.81–1.06) and adults 18–49 years old (mean 0.88, 95% CI 0.77–0.99). Females reported more ARI than males.
Distribution of ARI by individual and household characteristics. Solid vertical lines represent group mean, dashed lines represent 95% CI around the mean ARI: (a) distribution of individuals by number of ARI reported, stratified by age category; (b) distribution of individuals by number of ARI reported, stratified by gender; (c) distribution of households by number of ARI reported, stratified by number of children <5 years living in the household; (d) distribution of households by number of ARI reported, stratified by total household size.

Households with no children <5 years old reported fewer ARIs (mean 3.28, 95% CI 2.70–3.85) than those with at least one child in this age group; however, there did not appear to be a linear trend as households with one child <5 years (mean 4.89, 95% CI 3.68–6.10) reported similar frequency of ARI as households with two or more children <5 years (5.2, 95% CI 3.82–6.58). Larger households also reported more ARI than those with fewer members.
SSS and ARI
At the individual level, those below the median SSS (<7) had a borderline significantly higher incidence of ARI compared with those above the median (>7) in a multivariable mixed-effects Poisson regression model (Fig. 2a). Controlling for age group, sex and working or attending school or childcare outside the home, individuals below the median SSS had a 34% increase in the incidence rate of ARI, compared with those above the median SSS (IRR 1.34, 95% CI 0.98–1.92). The 95% CI for this estimate included the null value, indicating that the finding is not statistically significant. Similarly, individuals reporting median levels of SSS had 12% higher incidence of ARI than those reporting the highest levels of SSS (IRR 1.12, 95% CI 0.81–1.64), but this finding was also not statistically significant. Age group was significantly associated with the incidence of ARI; children 0–4 years had the highest incidence. Males also had a lower incidence of ARI than females (IRR 0.80, 95% CI 0.72–0.91).
Results of (a) individual-level multivariable mixed-effects and (b) household-level multivariable count models examining the association between subjective social status and count of ARI. Note: The individual-level model is adjusted for age group, sex and working or attending school or childcare outside the home. The household-level model is adjusted for number of children <5 years of age and household size.

In household-level models, we found a significantly higher incidence of ARI for those with low SSS. Households reporting SSS below the median had a 46% increase in the incidence of ARI (IRR 1.46, 95% CI 1.05–2.03) compared with households above the median (Fig. 2b). The number of children <5 years of age and household size were also significant predictors of ARI incidence in a household-level model. Compared with households with no children <5 years old, those with one child in this age group had 47% higher incidence of ARI (IRR 1.47, 95% CI 1.11–1.98); similar results were found for those with two or more children <5 years old (IRR 1.56, 95% CI 1.10–2.25).
Workplace disadvantage and ARI
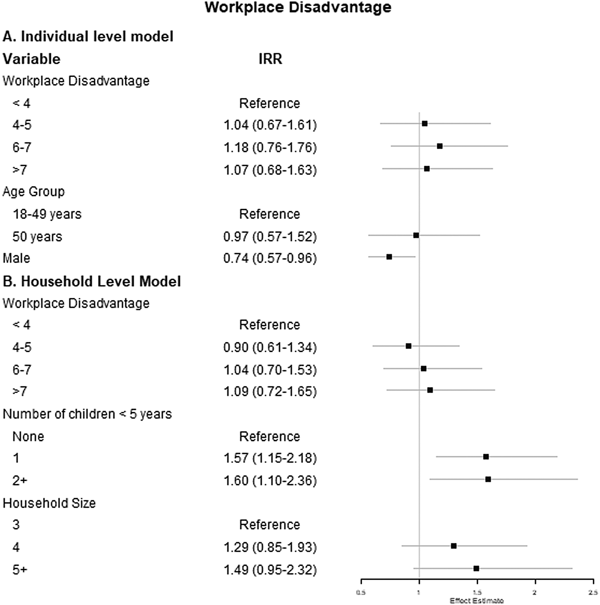
We also evaluated the associations between workplace disadvantage and incident ARI separately at the individual- and household-level. In a multivariable count model predicting ARI incidence, the only significant predictor of ARI incidence among working adults was sex (Fig. 3a), with men having lower incidence compared with women (IRR 0.74, 95% CI 0.57–0.96).
Results of (a) individual-level multivariable mixed-effects and (b) household-level multivariable count models examining the association between workplace disadvantage score and count of ARI. Note: The individual-level model is adjusted for age group, sex and working or attending school or childcare outside the home. The household-level model is adjusted for number of children <5 years of age and household size.

At the household level, the number of children <5 years of age was the only significant predictor of the incidence of ARI (Fig. 3b). Specifically, having two or more children <5 years of age in the household was associated with a 60% increase in the IRR of ARI compared with households with no children <5 years of age, though this finding was only borderline statistically significant (IRR 1.60, 95% CI 1.10–2.36).
Discussion
We used a community-based cohort study to examine whether ARI risk reflected social stratification among individuals and households. We found higher levels of social disadvantage, as measured by lower SSS, were associated with increasing incidence of ARI at the household-level. We also found a non-significant increase in ARI incidence for individuals with lower SSS. Workplace disadvantage, however, was not associated with ARI in either individual or household models. Our findings demonstrate that social stratification was detectable even among common acute illnesses such as ARI, and within a population that is not characterised by extreme disadvantage.
Evidence of social stratification in common illnesses has been intermittently reported for the last several decades. In a 1974 paper, Monto and Ullman reported the surprising finding that respiratory infection rates increased as the level of education of the head of household increased in the classic Tecumseh Study of Respiratory Illness [Reference Monto and Ullman20]. Many studies have since reported differences in chronic infection rates by income, education and other markers of SEP [Reference Holtgrave8, Reference Oren10–Reference Quinn12, Reference Steptoe14, Reference Grad, Lipsitch and Aiello26–Reference Dowd, Palermo and Aiello28]. However, until the last decade, few others have examined subjective markers of social disadvantage. In a viral challenge study, Cohen et al. found that individuals reporting lower SSS (i.e. those with higher levels of disadvantage) at baseline were more likely to develop symptomatic illness, independent of traditional markers of social disadvantage [Reference Cohen29]. In a follow-up study, SSS was found to be a key moderator of the impact of sleep duration on common cold infection [Reference Prather30]. Thompson et al. further tested this finding in a sample of health care workers and demonstrated, consistent with our results, that low SSS at baseline was associated with increased rates of ARI [Reference Thompson31]. Together, these findings suggest that SSS, regardless of educational attainment and income, may be a key predictor of symptomatic illness. Importantly, these studies were unable to examine if the effects persisted after controlling for household composition.
Our findings demonstrated an association between increasing social disadvantage and increasing incidence of ARI. Two separate hypotheses could explain this observation: increased exposure to infection and biologic vulnerability. Vis-à-vis the first hypothesis, increasing social disadvantage would be associated with increased exposure to pathogens that cause ARI, thus resulting in an increased incidence of illness. Increased exposure to pathogens could be the result of poor housing conditions, lack of access to material resources and neighbourhood environments that limit access to healthcare. For example, poor housing conditions may include crowded living conditions in which individuals are living in close contact with others and thus are more likely to be exposed to a pathogen. Lack of material resources and/or the neighbourhood environment may limit one's ability to receive vaccination for certain viruses. This represents a neo-materialist approach to this pathway; though the relative homogeneity of the sample precludes a more thorough investigation of this theory [Reference Link and Phelan32]. The second hypothesis, on the other hand, posits that increasing social disadvantage would result in increased physiological wear and tear through mechanisms such as chronic stress. Thus, more socially disadvantaged individuals would be more likely to develop symptomatic infections when exposed to pathogens. Studies have found that chronic stress (related to low SES) is associated with increased inflammation [Reference Pollitt, Kaufman and Rose33, Reference Friedman and Herd34] and changes in immune function [Reference Fagundes35, Reference Janicki-Deverts36], specifically cell-mediated immune function. New infections require activation of the naïve T-cell pool, increasing the numbers of memory T-cells and reducing naïve T-cells able to combat future infections. These changes could result in increased biologic vulnerability to infections both in the short-term and the long-term.
The studies by Cohen et al. on SSS seem to point to the plausibility of the biologic vulnerability hypothesis given the prospective nature of the studies and the uniform exposure of the viral challenge [Reference Cohen29, Reference Prather30]. We did not collect data on asymptomatic or sub-clinical infections and therefore could not explicitly replicate their findings in a real-world scenario. Nevertheless, the observation from this analysis that the incidence of symptomatic ARI increases at both the household- and individual-level with increasing social disadvantage lends some support to the original observation.
Extending the biologic vulnerability pathway, one could hypothesise that there is likely a long-term biological cost to repeated exposure to infection, even common infections such as ARI. This hypothesis may be a helpful explanation, not just for explaining ARI disparities, but for other more serious outcomes as well. Short-term infections, such as the common cold, could then be one mechanism by which prolonged exposure to social disadvantage may lead to poorer health outcomes overall. Repeated exposure to short-term processes such as the common cold may have long-term consequences for immune function and health, a process increasingly detrimental as individuals' age.
An alternative explanation of these results is that lower SSS increases the risk of certain behaviours that subsequently increase the risk of ARI. To examine one potential behavioural pathway, we explored smoking as a mediator of the association between SSS and ARI incidence among adult HIVE participants (Tables S3 and S4). In a causal mediation analysis, we found no evidence that smoking mediates the association between SSS and ARI at the individual level (Fig. S1). Another pathway we did not explore in this analysis was the potential reduction in ARI incidence by influenza vaccination. During the 2014–2015 season, the influenza vaccine was not effective in preventing influenza infections due to antigenic drift in the predominant circulating virus, influenza A/H3N2. Thus, no reduction in ARI incidence would be expected due to vaccination in the current analysis. Further, in years when the vaccine is effective, we believe that influenza vaccination may mediate the association between SSS and ARI. A rigorous analysis of these potential mediation effects will require additional seasons of influenza and ARI data and a modelling strategy adapted to this question [Reference Zelner37]. Additionally, future studies would benefit from the inclusion of other markers of social status (e.g. education and income).
We did not observe an association between workplace disadvantage and the incidence of ARI. However, we cannot rule out that this type of disadvantage may manifest at other points in the infectious process (e.g. severity of infection or duration of infection) rather than simply influencing the incidence of infection. Measuring the effect of workplace disadvantage on acute infectious diseases will require more nuanced outcome measures. However, we believe that understanding the impact of workplace disadvantage, and specifically sick leave policies, is critical to addressing health disparities in both exposure to and incidence of ARI [Reference Kumar23, Reference Blumenshine38].
We used the Household Influenza Vaccine Evaluation (HIVE) Study cohort to examine the association between social disadvantage and acute illnesses. By traditional metrics, including education and insurance coverage, our study population was not characterised by extreme variations in SEP [Reference Malosh39]. Our study population may not be generalisable to more urban or rural populations; however, it is generalisable to many suburban communities, which make up the majority of the US population. These populations are typically not the focus of research studies examining social stratification and its consequences. Nevertheless, even in a population with limited variability in traditional markers of SEP, we were able to show the detrimental impact of social stratification on health. Additionally, it is possible that there was under-reporting of illnesses in this population. However, we believe this would result in an underestimation of the true effect size of the association between SSS and ARI.
Supplementary material
The supplementary material for this article can be found at https://doi.org/10.1017/S0950268819000748.
Author ORCIDs
Ryan E. Malosh, 0000-0003-3546-5935, Grace A. Noppert, 0000-0002-2040-960X.
Acknowledgements
The authors wish to thank the HIVE Study participants for their participation in this research, as well as the HIVE Study staff for their hard work and dedication to the project.
Author contributions
REM and GAN contributed equally to this work. REM and GAN conceptualised the project, planned the statistical analysis, analysed and interpreted the data, and drafted and revised the article. JZ planned statistical analyses, interpreted the data and revised the article. ETM and ASM interpreted the data and revised the article. REM, ETM and AS planned the data collection. All authors have approved the final version of the article.
Financial support
The HIVE study is supported by the Centers for Disease Control and Prevention (U01 IP000474) and the National Institute for Allergy and Infectious Diseases (R01 AI097150). GAN received salary support from the National Institute of Aging grant 5 T32 AG000029-41 and from the Eunice Kennedy Shriver National Institute of Child Health and Human Development grant T32 HD091058.




 Open access

