


I. INTRODUCTION
With continuously increasing demands for higher data rates and larger user capacities, the development of future wireless communication systems, e.g., the fourth generation (4G) Long-Term Evolution Advanced (LTE-A) system, faces significant challenges. It requires not only wideband system architectures to be employed, but also high-order modulation schemes to be utilized. In the meantime, power consumption of the system must be kept as low as possible. In practice, these requirements often conflict with each other. For instance, in order to provide highly efficient power conversion, the radio frequency (RF) power amplifiers (PAs), are normally required to be driven into the saturation region. The saturated PAs introduce nonlinear distortion into the system, which contaminates the signal to be transmitted. Owing to the nonlinearities of the PAs, the spectrum of the transmit signal will also grow much wider than it is supposed to be. It causes out-of-band distortion that interferes with the systems at the adjacent frequency bands, consequently decreases the spectra utilization efficiency, especially in a wideband system.
To tackle the nonlinear distortion introduced by the PAs, besides the traditional back-off approach, several solutions have been proposed, such as feedback compensation techniques [Reference Faulkner1–Reference Woo3], which use a close-loop regulator to reduce the nonlinear distortion, and predistortion techniques [Reference Zhu, Draxler, Yan, Brazil, Kinball and Asbeck4–Reference Kim, Park, Moon and Kim6], which use a pre-distorted cascaded system to linearize nonlinear PAs. Owing to its flexibility and excellent linearization performance, digital predistortion (DPD) has become one of the most preferred choices, and it also tends to be one of the essential units in wireless transmitters for the next generation wireless communication systems.
The basic idea of DPD is simple. As shown in Fig. 1, a predistortion block, providing an inverse behavior of the PA, is inserted into the transmitter chain before the nonlinear PA. The cascade system will produce a reasonably linear output with respect to the original input, as long as the inverse behavior of the PA has been properly characterized and well described. Although the concept is straightforward, designing a DPD system with high-linearization performance and the required flexibility is not an easy task. This is because, firstly, the bandwidth of the signal in 3 G and 4 G systems has increased significantly, e.g., 60 MHz in multi-carrier Universal Mobile Telecommunications System (UMTS) and 100 MHz in the LTE-A system. To perform DPD in these systems, not only a wideband observation feedback loop, normally over several hundred megahertz bandwidth, is required to capture the spectra-regrowthed signal from the PA output, but also a wideband transmitter chain is required to produce a predistorted signal for the PA input. The wide bandwidth requirement significantly increases implementation difficulties in the transmitter. For instance, high-speed and high-performance data converters must be employed to achieve accurate data conversion between analog and digital domains. A high-speed baseband digital signal processor is also required, which often challenges the existing commercially available hardware computational processing capability. Secondly, various types of PAs generate diverse nonlinear behaviors. The DPD unit must be able to describe various nonlinear behaviors in order to keep its high-linearization performance. Furthermore, in order to rapidly evaluate various DPD algorithms, flexible software algorithm emulation and robust re-configurable hardware algorithm validation are also required. Finally, DPD development is a system engineering project, which involves various parts of the system, from the analog RF front-end to the digital baseband, and it requires a wide range of knowledge and experience, from algorithm development to software programming and hardware design.
Basic idea of DPD.

Currently, most of the predistortion systems/platforms are instrument based, such as Signal Generator – Vector Signal Analyzer-based test benches [Reference Zhu, Draxler, Yan, Brazil, Kinball and Asbeck4–Reference Younes, Hammi, Kwan and Ghannouchi7], or similarly Arbitrary Waveform Generator – Digital Oscilloscope-based test systems [Reference Cao, Nemati, Tehrani, Eriksson, Grahn and Fager8]. These instrument-based platforms suffer from several drawbacks, such as high-financial cost and relatively narrow bandwidth. Although some new instruments have been upgraded to support 160 MHz analysis bandwidth, the dominant commercially used test benches typically only support 80 MHz, which means that they are only suitable for signals with bandwidths up to 40 MHz+. The other DPD platforms/systems that have appeared in the literature mainly focused on field programmable gate array (FPGA) implementations of the DPD algorithms [Reference Mato, Pereira, Rodríguez-Andina, Farina, Soto and Perez9–Reference Kwan, Ghannouchi, Hammi, Helaoui and Smith13]. There has not been a single paper discussing a complete system implementation including digital baseband signal processing and analog RF front-end.
In this paper, we present a complete design procedure for implementing a flexible FPGA-based DPD platform, which includes an analog RF front-end, a digital baseband unit and a system control panel. This platform provides two operational modes: software algorithm validation mode and hardware linearization evaluation mode. The two modes are complimentary to each other and provide a good balance between algorithm validation complexity and physical linearization performance. Moreover, by applying the dual-loop DPD technique [Reference Guan and Zhu14] and newly developed band-limited DPD models [Reference Yu, Guan, Zhu and Zhu15, Reference Guan, Yu and Zhu16], an excellent linearization performance can be achieved with limited hardware and software resources.
The paper is organized as follows. After analyzing the functional requirements of the platform at the system level in Section II, the design procedures will be discussed in three separated parts: analog RF front-end, digital baseband, and hosting PC in Sections III, IV, and V, respectively. The robust validation methodology and experimental results will be given in Section VI, followed by a conclusion in Section VII.
II. DPD SYSTEM OVERVIEW AND FUNCTIONAL REQUIREMENTS AT THE SYSTEM LEVEL
In a typical DPD system, the original baseband signals are first predistorted by a predistortion unit in the digital domain and then passed through a digital-to-analog converter (DAC), and up-converted to the RF frequency, and finally sent to the PA. In order to extract and update the parameters of the DPD, a small part of the transmitter signal is fed back and converted to baseband via a down-converter and an analog-to-digital converter (ADC). The model parameter extraction unit compares the input and the captured output, and extracts the coefficients for the DPD unit to carry out the predistortion function. The digital predistorter unit is required to produce the predistortion function in real-time during the normal system operation process, while the model extraction unit is normally only invoked during the initial setup of the system or whenever the characteristics of the system are changed. The simplified block diagram of a typical baseband DPD system is illustrated in Fig. 2.
Simplified block diagram of a baseband DPD system.

In order to fulfill the roles described above, an ideal predistortion test platform must have the following four functional modules:
(1) A flexible signal source module, which provides various baseband signals to be tested. To easily generate arbitrary test waveforms at a designated data rate, software running on a personal computer (PC), e.g., MATLAB, can be considered as a good option, because of its flexibility in dealing with signal processing;
(2) A baseband digital predistorter module, which can perform the real-time predistortion function. A digital evaluation board with potential hardware signal processing cores, e.g., FPGA, digital signal processor (DSP) or ARM processors are required. Since predistortion is not the only function required to be implemented, an FPGA-based development board, e.g., Xilinx Virtex-5 development board [17], will benefit the system design due to its parallel computing and re-configurable capability.
(3) A parameter extraction module, which extracts and updates the coefficients for DPD. To extract proper DPD parameters, some system identification algorithms, such as least-squares (LS) estimation or least-mean-squares (LMS) estimation, are required to be implemented. For most quasi-static systems, it is not necessary to operate the parameter extraction module in real-time, the parameters can be derived in a software core-based signal processing environment first and then applied to the input to perform the predistortion function in real-time.
(4) An RF transceiver module, which can carry out data conversion between digital and analog domains, as well as up/down conversion between baseband and RF. To accurately convert the data between digital baseband and analog RF, a high-performance and linear transceiver is required, including high-speed DAC/ADC stages, and low-noise modulation/demodulation.
The above essential modules can be categorized into three parts according to their physical locations on the platform: hosting PC, baseband, and RF. The block diagram and key components at the top level are shown in Fig. 3 and Table 1. The specific technical requirements and system development for these parts will be discussed in the following sections.
Top level design diagram of the predistortion platform.

List of the main components in the system.

III. RF TRANSCEIVER DESIGN
A) RF system requirements
In order to effectively evaluate DPD algorithms, e.g., allow the DPD to correct the nonlinearity induced by the PA only, it requires that the transmitter (excluding PA) and the observation receiver path are as linear as possible. In the mean time, the practical limitations and constraints in a physical DPD system also must be considered. In our system, the RF transceiver, excluding PA, was designed to conform to the WCDMA and LTE specifications with substantial margin at an average output power of 20 dBm in band 1, 2110–2170 MHz. The starting point for the platform specification is the adjacent channel power ratio (ACPR) requirement of −45 dBc at a 5-MHz offset from the carrier frequency [18]. The overall system including the PA should meet this specification after DPD with at least 5 dB of margin. The raw performance of the transmitter up to the PA should be 10 dB better than this or an ACPR of −60 dBc. This ensures that the PA dominates system linearity. Transmitter noise will also add to the power of intermodulation products in the adjacent 5 MHz channels; therefore, in order to ensure that the ACPR is dominated by transmitter linearity but not noise, the noise floor of the transmit chain should be 10 dB below the ACPR specification, or −70 dBc, in a 3.84-MHz bandwidth. Similarly, the local oscillator phase noise must be 10 dB below the transmitter noise floor at the modulator output in a 3.84 MHz bandwidth at the adjacent channel (−80 dBc/3.84 MHz) to ensure that the local oscillator (LO) phase noise does not raise the overall transmit noise floor. The transmitter specifications are summarized in Table 2.
Transmitter system specifications.
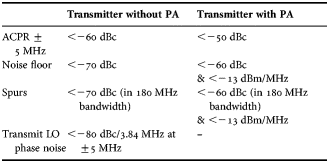
The transmitter bandwidth needs to be wider than the 60 MHz specified for band 1 as intermodulation products will spread outside of this band. A DPD bandwidth of 180 MHz was chosen as this allows the third-order products to be compensated for by assuming that the full 60 MHz transmit band is used. Similar requirements to the transmitter exist for the DPD feedback receiver. The feedback receiver should capture the PA output distortion without introducing any distortion of its own or raising the noise floor. This will maximize the ability of the DPD to correct for PA nonlinearities, i.e., maximum ACPR. The specifications for the feedback receiver are therefore the same as the transmitter (without PA) as in Table 2.
B) Frequency planning
The transmitter was implemented as a superheterodyne with complex intermediate frequency (IF) [Reference Boutin19, Reference Reine20], whereas the receiver topology chosen was also a superheterodyne with a sub-sampling IF. This architecture has the advantage in that both the IQ modulation and demodulation are performed in the digital domain and so the effect of offsets and imbalances in analog quadrature modulators [21] and demodulators [Reference Wong, Zou, Stuetzle and Hsiao22] which are a problem in direct conversion architectures are essentially avoided.
A good place to start the frequency plan is with clock frequencies for both the DAC and ADC. The clock conditioner circuit will provide low jitter LVPECL clocks to both the DAC and the ADC and also a low-voltage differential signaling (LVDS) clock to the FPGA thus ensuring that the whole system is phase locked together for reliable performance. The clock conditioner circuit contains an integer N-phase-locked loop where the output of a voltage controlled SAW oscillator (VCSO) is locked to a low-frequency ovenized crystal oscillator (OCXO). Both the OCXO and VCSO must be integer multiples of the WCDMA chip rate of 3.84 Mega chips per second. Determination of the clock frequencies can start by examining the downconversion process in the feedback receiver as shown in Fig. 4.
Band-pass sampling receiver down-conversion process.

The 180 MHz DPD bandwidth sets the minimum bandwidth of a Nyquist zone. A good choice for the receive IF is downconversion to the second Nyquist zone which means that the ADC sampling frequency must be a minimum of 360 MHz. A common VCSO frequency is 737.28 MHz so dividing this by 2 in the clock conditioner will give an ADC sampling frequency of 368.64 MHz. The clock conditioner output of 737.28 MHz can be used to clock the high-speed DAC. The DAC clock frequency determines the maximum IF obtainable from the DAC as the inverse sinc filter in the DAC is usually limited to a cut-off frequency of 0.4 times F DAC which gives a maximum transmit IF of (0.4 × F DAC) − IFBW/2 = (0.4 × 737.28 MHz) − 90 MHz = 204.9 MHz. The upconversion process in the transmitter is shown in Fig. 5.
Superheterodyne transmitter upconversion process.

The following guidelines can be used to check the suitability of transmit and feedback receiver IFs:
(1) Perform a spur analysis [Reference VanDyke23] and choose a transmit IF (TX IF) such that only high-order intermodulation products (m + n > 10) appear within the TX DPD bandwidth (TX RF):
(1) $$TX_{RF}=\pm mTX_{IF} \pm nTX_{LO}$$
(2) Similarly, choose a feedback receiver IF (RX FB−IF) such that only high-order intermodulation products (m + n > 10) appear within the receive IF bandwidth:
(2)$$RX_{FB - IF}=\pm mTX_{RF} \pm nRX_{FB - LO}$$(3) If the transmit local oscillator (TX LO) is injected above the transmit band then the RX FB−LO should be injected below the band. This avoids a potential spur in the feedback receiver IF if TX LO and RX LO mix together to give TX LO–RX FB−LO = RX FB−IF.
(4) Ideally, the TX IF and the RX FB−IF should not overlap in frequency in order to avoid any interference due to coupling.
(5) The TX IF should be high enough in frequency so that the TX LO does not appear within the TX DPD bandwidth.
(6) The band 1 uplink frequency range (base station receive) is 1920–1980 MHz. The TX LO or RX FB−LO should not fall within this range.
(7) Examine the harmonics of TX IF, DAC clock, ADC clock and reference XTAL oscillator to see if they fall within the TX DPD bandwidth or the base station receive band.
(8) Perform a spur analysis to see which order of DAC images and harmonics fall within the TX IF DPD bandwidth:
(3)where F DATA is the rate at which data are clocked into the DAC from the FPGA (even if interpolation is used in the DAC). Unfortunately, only on the bench measurements can determine the level of these DAC spurs.$$TX_{IF}=\pm nF_{DATA} \pm mTX_{IF}\comma \;$$(9) In order to optimize DAC spurious free dynamic range (SFDR), the TX IF should not be a sub-harmonic of the DAC output clock rate [Reference Kester24].



C) Transceiver systems analysis
Before committing to hardware, a noise and linearity cascade analysis must be undertaken to see if system specifications can be met. Starting with the cascade noise analysis the DAC performance must be included as it contributes to noise at the modulator output. The DAC noise floor is shown in the data sheet as measured in a test circuit. The DAC test circuit is shown in Fig. 6.
DAC test circuit.

The 16 bit dual-DAC chosen for the transceiver has a measured noise spectral density of −163 dBm/Hz at the selected IF of 130 MHz for the DAC I or Q output. This translates to two noise current sources for the DAC complementary outputs with noise current spectral densities of 60 pA/[(Hz)1/2] each. The noise voltage at the quadrature modulator baseband inputs was simulated as 1.65 nV/[(Hz)1/2] as shown in Fig. 7.
DAC noise contribution to modulator output noise.

The modulator itself has an extremely low output noise floor (Nmod_added) of −165 dBm/Hz. Added to this is the noise from the DAC appearing at the modulator output (−164.2 dBm/Hz). The calculation is shown in Eq. (4) where the resulting total broadband noise power at the modulator output, Nmod, is −161.6 dBm/Hz.
 $$N_{\rm mod } \left({dBm} \right) = 10\log \left[\left(\displaystyle{(g_v \times V_{n\_bb\_I} )^2+(g_v \times V_{n\_bb\_\bar I} )^2 \over 50} + 10^{\left[\displaystyle{{\rm N}_{{\rm mod}\_{\rm added}} \over 10} - 3 \right]} \right) \times 10^3 \right]$$
Consideration must also be given to the phase noise of the local oscillator as it may raise the noise floor in the adjacent channel at the quadrature modulator output as shown in Fig. 8.
Reciprocal mixing of transmit LO phase noise onto LTE subcarriers.

The transmitter local oscillator phase noise is shown reciprocally mixed onto each LTE subcarrier and this noise spills into the adjacent channel [Reference Smaïni25]. The transmit synthesizer phase noise was measured with a Rohde & Schwarz FSUP as shown in Fig. 9.
Transmit synthesizer measured phase noise.

Using a 5 MHz LTE signal as an example the phase noise for each subcarrier must be integrated over the 4.5 MHz adjacent channel bandwidth. For optimum system ACPR performance, the baseband drive levels into the analog quadrature modulator have been set so that the quadrature modulator output power level is −16 dBm. The power level of each of the 5 MHz LTE signal's 300 subcarriers is therefore given as −16 dBm − 10 log(300) = −40.7 dBm (assuming equal power levels for each subcarrier). The resulting integration yields a phase noise power of −113.6 dBm/4.5 MHz in the adjacent channel at a 5 MHz offset. The broadband noise from the modulator was previously given as −161.6 dBm/Hz or −95 dBm/4.5 MHz. As the LO phase noise in the adjacent channel is 18.6 dB below the quadrature modulator output noise floor it does not raise the noise floor for our system.
The noise floor at the modulator output sets the system signal-to-noise ratio (excluding distortion) as further linear stages do not degrade this value. The single carrier 5 MHz LTE alternate channel (10 MHz offset) at the modulator output is dominated by system noise and therefore has a limiting value of −95 dBm/4.5 MHz − (−16 dBm/4.5 MHz) =−79 dBc. This value is well within target specifications of −70 dBc and has been verified by measurement. Furthermore, the broadband transmitter noise must meet the more demanding spurious emissions specification of −30 dBm/MHz at a 10 MHz offset below or above the band edge (where the duplex filter will have little attenuation) for a category B base station [26, Reference Brannon and Schofield27]. For example, if the base station has an output power of 100 W or 50 dBm the gain required from the modulator output to the antenna connector will be 50 dBm–(−16 dBm) = 66 dB. The noise floor will get a similar boost of 66 dB to −95 dBm/4.5 MHz + 66 dB = −29 dBm/4.5 MHz or −35.5 dBm/MHz, which leaves 5.5 dB of margin.
On the feedback receiver side a 14 bit ADC is needed to give the minimum −70 dBc/3.84 MHz of noise floor as per the specification in Table 2. The ADC dynamic range is shown in Fig. 10.
ADC dynamic range showing performance with sampled TX fed back to RX.

The measured noise floor at the ADC input in a 3.84 MHz bandwidth for a single carrier WCDMA signal is −75.15 dBc. This is the SNR of the transmitter and receiver path up to the ADC input. After sampling the SNR is reduced to 71.4 dB (see the sampling performance results in the Section VI) due to ADC noise. From these two measurements the ADC SNR is calculated as 73.77 dB/3.84 MHz. This figure includes a 6.5 dB PAR for the single-carrier WCDMA signal plus 1 dB of back-off from ADC full scale. The stand alone ADC SNR is therefore 81.27 dBFS. The jitter performance of the ADC clock has a significant impact on the ADC SNR. A 368.64 MHz LVPECL differential clock with no filtering between the clock and ADC was used in the system. The measured phase noise of the ADC clock is shown in Fig. 11.
Measured phase noise of ADC LVPECL clock at 368.64 MHz.

A conservative approach was taken to ensure that the transceiver met system linearity requirements as specified in Table 2. A minimum target back-off of 35 dB from signal peaks to device output third-order intercept point (OIP3) was used in selecting parts. The cascade linearity analysis has been reported elsewhere [Reference Yin28–30].
D) Transceiver measured frequency response
Gain ripple in the feedback receiver affects the ability to accurately measure transmitter output distortion and consequently correct for it although the ripple can be calibrated in a receiver frequency calibration step. The receiver frequency response including ADC (normalized to center frequency) is shown in Fig. 12. The ripple is only 0.2 dB across a 100 MHz carrier bandwidth, 1.5 dB across a 170 MHz bandwidth and 2.5 dB across the complete 180 MHz of DPD bandwidth.
Measured frequency response of feedback receiver chain.

The frequency response of the transmitter (excluding PA) with an output power of 20 dBm is shown in Fig. 13. The 1.7 dB of ripple over a 100 MHz carrier signal bandwidth can be compensated for with DPD.
Measured frequency response of transmitter (excluding final PA).

IV. FPGA-BASED DIGITAL BASEBAND
The baseband, serving as a central physical connection between user algorithms and hardware, will largely determine the final system performance from the functional point of view. This is because the linearization performance is not only affected by the DPD algorithms, but also related to the performance of the hardware in the digital data path. In order to provide guaranteed zero bit error rate (BER) data processing in the digital domain, the baseband re-configurable hardware design must adopt a robust mechanism to eliminate potential determined errors. In this sense, four essential categories of logic are required: (1) Clock management logic, which is utilized to provide phase-locked clocks at a required speed; (2) Data transceiver logic, which is required to handle the data download/upload according to the different data transmission standards; (3) External integrated circuits (ICs) configuration logic, which is needed to ensure that the digital-controlled ICs operate properly; and (4) User defined logic, which is an option to embed user functions, such as adaptive predistorter. The simplified design block diagram is illustrated in Fig. 14 with a detailed explanation as follows.
Simplified design diagram of functions on the FPGA chip.

A) Clock management logic
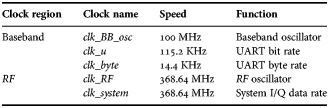
Different data paths in the baseband require different clocks to operate properly. In order to achieve synchronous data transmission between the digital baseband and the analog front-end, a high-speed clock was originally generated on the RF board based on a stable OCXO. This clock was then fed back differentially to the baseband board to drive the corresponding digital logic, which is marked with the blue dash dot line in Fig. 14. Since the data transmission between hosting PC and baseband board did not require synchronizing with the RF board, those logic circuits were driven by another highly stable oscillator on the baseband board, which is distinguished with the red broken line in Fig. 14.
Three derived clocks were subsequently generated from those two oscillators by the digital clock management (DCM) unit, relevant frequency divider (FD), and proper clock buffers. The functions and typical settings of those clocks in our system are given in Table 3.
Clocks involved on baseband board.
B) Data transceiver logic
Since the clocks on the FPGA chip are derived from two different oscillators, the phase jitter between those two clock-regions should be carefully treated during the data transmission process, otherwise several problems may occur. For example, in the digital domain, if the data in the low-speed logic area are continuously sampled by a high-speed clock directly, the output sequence will contain redundant samples; if the data in the high-speed logic area are continuously sampled by a low-speed clock directly, some of the data samples will be missing, resulting in incomplete data transmission. Both of the two cases above will severely degrade the performance and even cause system failure. In our system, a dual-port random access memory based data interface was designed to fully absorb the random phases difference between two separated clock regions, which is explained as follows.
On the data downlink (PC → Baseband board → RF board), a set of test data on the PC was firstly captured via a 1-bit data bus by a UART Receiver at 115.2 K bit/s on the FPGA, and the captured data were fully written to a corresponding on-chip RAM on one port. These data were then circularly pushed out from the other RAM port to the RF board via two 16-bit data buses at a rate of 368.64 MHz. This time-division-based dual-port write and read operation is an equivalent procedure to the First In First Out (FIFO) operation, which has been accepted as one of the most robust methods to handle the data transmission between two asynchronous clock regions in FPGA-based designs. Since the data were written into the RAM only once from one port, and then was read out repeatedly from the other port, the risk of reading out redundant data was eliminated. For the uplink (RF board → Baseband Board → PC) data path, a similar architecture can be applied to guarantee that the data are properly captured and transmitted.
C) External ICs configuration logic
The external ICs on the RF board should be configured properly before they produce the expected functional output. Those digital-controlled ICs include one clock conditioner, one dual DAC, two digital step attenuators (DSA_TX and DSA_RX) and two synthesizers (Synth_TX and Synth_RX) for transmitter and receiver, respectively. Generally, each external IC requires a unique configuration path; however, increasing the numbers of ICs involved will increase FPGA Input/Output (I/O) pin usage, which is quite important as there are limited resources on the FPGA chip. Trying to keep the I/O pin usage down to a minimum, we designed a multiplexed serial peripheral interface (SPI) bus logic to handle the configurations for different external ICs. At system powering up stage, a set of pre-set register values were sequentially loaded into the different target ICs. Then, if any one of the ICs needs to be re-configured, the required user defined register values can be latched into the selected IC with an external 8-bit switch. After successfully configuring the ICs, the working states of those ICs, e.g., synthesizer out of lock alarm, should be constantly monitored, thus the user can easily find out the current operational state of the platform, and tune it efficiently according to the requirement.
D) User defined logic
The hardware-based algorithm validation is time consuming, resource costly, and an inflexible process, therefore in order to reduce the cycle time of development and ease the algorithm validation process, the ideal platform must provide an easy-to-use predistortion algorithm validation environment. In other words, the predistortion algorithm should be not only implemented on the hardware baseband board (named as Hard-DPD), but also should be realized intermediately on the host PC (named as Soft-DPD) for rapid algorithm validation. This two-mode operation will significantly reduce the DPD system development cycle time and save on overall expense.
In the Soft-DPD mode, the FPGA can be configured as a pattern generator and data acquisition unit for transmitter and receiver, respectively. According to the selected DPD model, the original signal was firstly predistorted in the software environment, and then downloaded into the FPGA to go through the normal data path in the baseband, and finally upconverted to RF to excite the PA under test. In the Hard-DPD mode, according to the validated DPD model, hardware-based predistorter, e.g., FPGA-based predistorter [Reference Guan and Zhu12], can be invoked to provide more reliable linearization performance in practice. This switching function between algorithm validation mode and physical hardware realization mode will make the platform more flexible to carry out different DPDs for various nonlinear PAs.
V. HOSTING PC PART
The last important part of the platform is the hosting PC part, which serves as an interface between the user and hardware PCB boards. The simplified block diagram of the hosing PC part is illustrated in Fig. 15.
Simplified system diagram of function on the hosting PC.

A) Data generation and data pre-process
The original baseband data sequences, such as WCDMA and LTE signals, can be generated in MATLAB in advance. At the beginning of each test, one set of those sequences can be loaded into the system. Since the statistical properties of the signal, such as root-mean-square (RMS) value and peak-to-average power ratio (PAPR), are directly related to the final linearization performance, data pre-process approaches are required to provide a set of original test signals satisfying the requirements. For example, magnitude normalization and PAPR reduction operation can be introduced to carry out the required modification on the test data sequence.
B) DPD application
Given the signal definition as shown in Fig. 1, the DPD output can be represented as
 $$\tilde u\lpar n\rpar = {\bf H}\left[{\tilde x\lpar n\rpar } \right]\comma \;$$
where H[·] represents a nonlinear function structured by the behavioral models. If we choose the simplified second-order dynamic deviation reduction (DDR)-based Volterra model [Reference Guan and Zhu31], which is an extension of the DDR model [Reference Zhu, Pedro and Brazil32], the DPD output can be written as
 $$\eqalign{\tilde u\lpar n\rpar & =\sum\limits_{k=0}^{{{P - 1} \over 2}} {\sum\limits_{i=0}^M {\tilde g_{2k+1\comma 1} \lpar i\rpar } } \left\vert {\tilde x\lpar n\rpar } \right\vert ^{2k} \tilde x\lpar n - i\rpar \cr & \quad+\sum\limits_{k=1}^{{{P - 1} \over 2}} {\sum\limits_{i=1}^M {\tilde g_{2k+1\comma 2} \lpar i\rpar } } \left\vert {\tilde x\lpar n\rpar } \right\vert ^{2\lpar k - 1\rpar } \tilde x^2 \lpar n\rpar \tilde x^{\ast} \lpar n - i\rpar \cr & \quad +\sum\limits_{k=1}^{{{P - 1} \over 2}} {\sum\limits_{i=1}^M {\tilde g_{2k+1\comma 3} \lpar i\rpar } } \left\vert {\tilde x\lpar n\rpar } \right\vert ^{2\lpar k - 1\rpar } \tilde x\lpar n\rpar \left\vert {\tilde x\lpar n - i\rpar } \right\vert ^2 \cr & \quad +\sum\limits_{k=1}^{{{P - 1} \over 2}} {\sum\limits_{i=1}^M {\tilde g_{2k+1\comma 4} \lpar i\rpar } } \left\vert {\tilde x\lpar n\rpar } \right\vert ^{2\lpar k - 1\rpar } \tilde x^{\ast} \lpar n\rpar \tilde x^2 \lpar n - i\rpar \comma \;}$$
where  $\tilde g_{2k+1\comma j} \lpar j = 1\comma \; 2\comma \; 3\comma \; 4\rpar $ are the complex Volterra kernels, (·)* represents the complex conjugate operation and |·| returns the magnitude. P is the order of nonlinearity (P is an odd number) and M represents the memory length.
In a compact form, (6) can be rewritten in a matrix format,
 $${\bf U} = {\bf XC}\comma \;$$
where the matrix X contains all of the linear and product terms  $\tilde x\lpar n\rpar $,
 $\tilde x\lpar n - 1\rpar $, …,
 $\left\vert {\tilde x\lpar n\rpar } \right\vert ^2 \tilde x\lpar n\rpar $, …, appearing in the input of the model, for n = 1, 2, …, N, and C represents the parameter vector containing all of the unknown coefficients
 $\tilde g_{2p+1\comma j} \lpar{\cdot}\rpar $. The vector U represents the DPD output vector.
C) Time alignment and parameters extraction
To extract the coefficients for DPD, the first step is to obtain a pair of data including the input and its corresponding output. Since the physical data path introduces time delays into the system, proper time alignment is needed to get a “time matched” data pair. And then the pth-order post-inverse [Reference Zhu, Draxler, Yan, Brazil, Kinball and Asbeck4] or the in-direct learning technique [Reference Eun and Powers33] can be employed, where the feedback signal, e.g., the output of the PA,  $\tilde y\lpar n\rpar $, is used as the input of the model, while the predistorted output signal,
 $\tilde u\lpar n\rpar $, is used as the expected output. Since the Volterra series models are linear-in-parameter, the simple linear system identification approaches, e.g., LS estimation can be utilized. For example, by employing the standard LS algorithm, the coefficients vector C can be estimated from
 $$\hat {\bf C}=\left[{\lpar {\bf Y}^{\bf H} \rpar {\bf Y}} \right]^{ - 1} {\bf Y}^{\bf H} {\bf U}\comma \;$$
where Y is the PA output matrix in a similar form to the matrix X, and (·)H represents the Hermitian transpose.
D) Data format conversion and data transceiver
The MATLAB environment uses the floating-point decimal data format to process signals; however, the digital baseband can only recognize the signal in binary format. Therefore proper format conversion should be performed to satisfy the system requirements. For example, due to using a 16-bit DAC, the complex data in MALTAB should be converted into 16-bit binary format representation.
Moreover, depending on different interfaces between PC and baseband, the binary data will be packed according to different interface standards. For example, to transfer data between PC and baseband through a UART interface, the 16-bit binary data should be converted to an 8-bit (byte) binary data package for transmitting and vice versa for receiving. Then the packaged data can be downloaded to FPGA or uploaded from FPGA for further signal processing.
VI. EXPERIMENTAL TEST PROCEDURES AND EXAMPLE LINEARIZATION RESULTS
The final DPD test platform is illustrated in Fig. 16, and to comprehensively evaluate the performance of the platform, two different evaluation approaches were used with emphasis on different aspects of the system.
Final DPD test platform.

A) Platform self-loop performance evaluation
In this part, we will evaluate the essential performance of the platform with the self-loop configuration (without PA), including accuracy, dynamic range and linearity of the transceiver, magnitude and phase errors for the entire self-loop. All of those factors will significantly and directly affect the final linearization performance.
Firstly, to assess the accuracy of data acquisition, we compared two single-tone signals S1 and S2 both in the time domain and the frequency domain. S1 is captured by our designed receiver directly from a signal generator, whereas S2 is an ideal signal generated in MATLAB with the same frequency as that of S1.
In the time domain, the statistical distribution of the magnitude error between the captured single tone and the ideal one is used to illustrate the performance. As shown in Fig. 17, the normalized magnitude error was within only ±2.5 × 10⁻³, which equals to 0.25% variance. Actually, an “ideal” Gaussian error distribution was obtained, which verified that only random noise and measurement errors (inevitable errors) remained in the receiver, and no deterministic errors were introduced. In addition, the phase error was within merely ±0.3°, which results in an equivalent maximum and RMS error vector magnitude (EVM) of 0.49% and 0.18%, respectively.
The amplitude distribution of the error signal between the captured single tone and the ideal one.

Since predistortion uses sampled digital signals to characterize the nonlinear distortion of PAs, the characterization accuracy largely depends on capturing accuracy. In order to further assess the capability of the platform, SFDR was also evaluated in the frequency domain. A higher SFDR provides higher data capture sensitivity, namely, the signal can be more accurately captured by the receiver without any spurs. Any undesired high-power level spur will be transformed as a disturbance in the time domain. As shown in Fig. 18, the SFDR can reach at least 83 dB, which means the noise level or noise floor of the receiver is quite low and the dynamic range of the ADC is quite large.
Spectra of captured single-tone and reference one.

After the validation of the receiver, a complete self-loop test with transmitter in chain was carried out, as follows: a WCDMA signal with a 5 MHz bandwidth was generated in the baseband, and then was emitted by the transmitter and captured by the receiver within a closed loop connection.
ACPR is commonly used to characterize the linearity of radio systems. As shown in Fig. 19, the ACPRs at the 5 MHz offset above and below the carrier were −65.2 and −65.3 dBc, while the ACPRs at 10 MHz offset were −71.3 and −71.4 dBc. Furthermore, the SFDR of the whole platform for the 5 MHz WCDMA signal can achieve 71 dB, which reserves plenty of headroom to dynamically capture the output of PAs in the linearization applications without losing any characteristic information.
Spectrum of captured 5 MHz WCDMA signal, which is originally generated in MATLAB, emitted by transmitter and captured by receiver.

B) PA in-chain linearization performance evaluation
In this part, PA in chain test was conducted for evaluating the performance of linearization. An LDMOS Doherty PA (DPA) was tested with three different excitations.
1) SINGLE SINE WAVE SIGNAL
The gain characteristic as a function of output power for the DPA was tested by using a sine wave as a stimulant to the PA. As shown in Fig. 20, the P1 dB of the DPA is 41 dBm while P2 dB is 44.3 dBm.
Doherty PA cw gain as a function of output power.

2) 20 MHZ SINGLE CARRIER LTE SIGNAL
The first DPD test was conducted with a 20 MHz single carrier LTE signal with PAPR of 6.5 dB. In order to well describe the distortions with strong nonlinear memory effects, we use the simplified second-order DDR-based Volterra model [Reference Guan and Zhu31], as also shown in (6). In this test, the DPD model with P = 9 and M = 4 (73 coefficients in total) achieved satisfactory linearization performance.
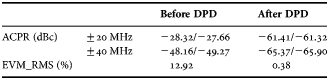
The AM/AM and AM/PM characteristics are given in Fig. 21, which indicates that nonlinearities and memory effects are almost completely removed after DPD. The output spectra of the PA before and after DPD are also given in Fig. 22. In addition, the EVM and ACPR values are listed in Table 4. After employing DPD, the RMS EVM is reduced from 12.92% to 0.38% and the ACPR is reduced from −28 dBc to below −61 dBc, a more than 30 dB improvement, which is 15 dB better than the spectrum mask requirement (−45 dBc). The alternate channel ACPR is reduced from −48 dBc to −65 dBc, almost down to the noise floor of the platform. Moreover, after DPD, the spectral emission mask (SEM) at ±19.5 MHz offset with 1 MHz measurement bandwidth was measured as −37.6/ − 37 dBm/MHz for a 37.3 dBm output power. This would extrapolate to −24.9/ − 24.3 dBm/MHz, for a 50 dBm output power which is 10 dB better than the SEM requirement (−13 dBm/MHz).
AM/AM and AM/PM plots for the 20 MHz LTE signal with and without DPD.

Output spectra for 20 MHz LTE with and without DPD.

Linearization performance of 20 MHz LTE signal.
3) 100 MHZ LTE-ADVANCED FIVE-CARRIER SIGNAL
Though the DPD bandwidth is designed for 180 MHz, in the next test, we used an ultra wideband signal, 100 MHz LTE-advanced signal (with PAPR of 7.8 dB) to evaluate the DPD performance under band-limited situations. Based on our recently proposed band-limited DPD algorithms [Reference Yu, Guan, Zhu and Zhu15, Reference Guan, Yu and Zhu16], excellent linearization performance was achieved on our test platform. The AM/AM and AM/PM characteristics are shown in Fig. 23, which again indicates that the distortion introduced by the nonlinearity of the PA was almost completely removed after employing the DPD. The frequency spectra are given in Fig. 24 and the EVM and ACPR performance are presented in Table 5.
AM/AM and AM/PM plots for the 100 MHz LTE-Advanced signal with and without DPD.

Output spectra for 100 MHz LTE-Advanced with and without DPD.

Linearization performance of 100 MHz LTE-A signal.
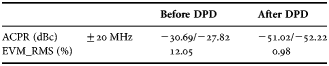
One may notice that the memory effects in this case are much stronger than that in the test with a 20 MHz LTE signal. However, after applying the band-limited DPD on the test platform, the ACPR at ±20 MHz offset can be reduced from −28 dBc to below −50 dBc within the bandwidth regulated by the designed transceiver. In addition, the RMS EVM can be reduced from 12.05% to 0.98%.
C) Reconfigurable FPGA hardware resource cost
In terms of hardware resource cost, we only care about the cost for the reconfigurable hardware. Since once the platform was designed, the analog front-end was fixed in the physical sense, and the control panel was based on the software; therefore only the reconfigurable hardware resource cost was variable and can be reduced by proper design. Actually, the DPD unit will be embedded in the baseband board in the real industrial applications, therefore the reconfigurable hardware resource, i.e., FPGA resource utilization is the best approach to assess implementation complexity.
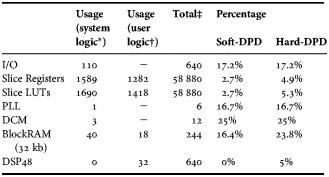
Our design did not struggle with complicated interface logic, such as USB interfaces, or costly controller logic for on-board memory; instead, those parts were replaced by resource-efficient blocks, such as a simple UART interface and embedded on-chip memory controller. The overall hardware resource utilization is shown in Table 6. The basic logic usage for Soft-DPD in chain setup can be found in the second column of Table 6, and the extra logic usage for employing user logics, i.e., FPGA-base Hard-DPD is shown in the third column. The resource usage for Hard-DPD was based on the DPD model (8) with P = 9, M = 4, and efficient low-cost implementation methodology including LUT-assisted gain indexing and time division multiplexing based multipliers sharing [Reference Guan and Zhu12]. From Table 6, we can see, with user defined logic in loop, the flip-flop resource slice registers and slice LUTs occupied around 4.9% and 5.3% of resources; the usage of embedded resource, including phase lock loop (PLL), DCM, Block RAMs, and I/O pins were around 20%; and the signal processing unit DSP48s was merely 5%.
FPGA resource utilization.
*Refers to basic logic for platform with soft-DPD.
†Refers to extra logic for employing FPGA-based hard-DPD.
‡Based on Xilinx Virtex 5 XC5VSX95T chip.
In practice, besides the DPD units, some other essential functions are required to be implemented on the baseband of modern wireless communication systems, e.g., coding/decoding, modulation/demodulation, digital filters, and so on; therefore, trying to carry out a low-cost predistortion not only can reduce unwanted power consumption but also is prudent to reserve limited resource for baseband integration with any other essential algorithms.
VII. CONCLUSION
In this paper, we presented a complete design and test process for implementing a high performance re-configurable software/hardware co-operated DPD platform. Although we only demonstrated experimental results for Volterra series-based DPD models for a medium power DPA in this paper, this platform can be used to evaluate various DPD algorithms for various types of RF PAs operated at a wide range of conditions. The FPGA implementation of the DPD block can also be easily extended to other types of digital circuits, such as general DSP chips, or application-specific integrated circuits.
 Lei Guan received the B.E. degree and the M.E. degree, both in Electronic Engineering from Harbin Institute of Technology (HIT), Harbin, China in 2006 and 2008, respectively. He was awarded the Ph.D. degree in Electronic Engineering in 2012 by University College Dublin (UCD), Dublin, Ireland. Then he served as a Senior Research Engineer in UCD School of Electrical, Electronic and Communications Engineering. Currently, he is a Research Fellow in CTVR the Telecommunications Research Centre, Trinity College Dublin (TCD), Ireland. His research interests include digital predistortion (DPD)-based linearization and system-level modeling of radio frequency (RF)/Microwave power amplifiers (PAs); peak-to-average power ratio (PAPR) reduction for OFDM systems. He also has interests in nonlinear system identification algorithms and FPGA-based parallel computing, digital signal processing, wireless communication system design and network protocol design.
 Ray Kearney received a BSc. (Eng) degree in Electronic and Communications Engineering from Dublin Institute of Technology, Ireland in 1993 and an MSc. degree in RF and Microwave Engineering from the University of Bradford, UK in 1994. From 1994 to 1997 he worked for Nokia Mobile Phones (UK) on analog handset design. In 1998, he joined Lucent Technologies in Dublin to work on GSM base stations until their closure in 2001. He subsequently worked for TDK Electronics Ireland on GSM modules and LTCC filters until 2006 when he joined Benetel Ltd to design a femto-cell transceiver. In 2008, he joined the Institute of Microelectronics and Wireless Systems at the National University of Ireland, Maynooth where he worked on Class S RF PA's. From 2009 to present he has been with University College Dublin where he designed RF hardware for the DPD test platform described in this paper. He has also worked on low-power radar for biomotion sensors while at UCD.
 Chao Yu received the B.E. and M.E. degrees from Southeast University, Nanjing, China, in 2007 and 2010, respectively. He is currently working toward the Ph.D. degree at University College Dublin, Dublin, Ireland. His research interests include antenna design, behavioral modeling, and DPD for RF PAs.
 Anding Zhu received the B.E. degree in telecommunication engineering from North China Electric Power University, Baoding, China, in 1997, and the M.E. degree in computer applications from Beijing University of Posts and Telecommunications, Beijing, China, in 2000, and the Ph.D. degree in Electronic Engineering from University College Dublin (UCD), Dublin, Ireland, in 2004. He is currently a Lecturer with the School of Electrical, Electronic and Communications Engineering, UCD. His research interests include high-frequency nonlinear system modeling and device characterization techniques with a particular emphasis on Volterra-series-based behavioral modeling and linearization for RF PAs. He is also interested in wireless and RF system design, digital signal processing, and nonlinear system identification algorithms.



