I. INTRODUCTION
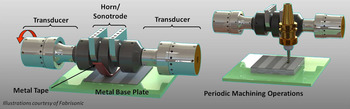
Ultrasonic Additive Manufacturing (UAM) is a rapid prototyping process that combines additive and subtractive stages to generate near-net shape metallic parts. Reference Graff1 The additive stage uses principles of ultrasonic metal welding to join thin metal foils of similar or dissimilar materials in a layer-by-layer process. A rolling horn or sonotrode is used to apply downward force and side to side ultrasonic vibrations on the material to be welded. The vibrations are generated by one or more piezoelectric transducers on each side of the sonotrode assembly, creating a scrubbing action that removes surface oxides and contaminants, exposing nascent surfaces. Under sufficient normal force, these nascent surfaces come together to form a bond. A schematic of the UAM process and components is shown in Fig. 1. The joining process is repeated either next to, or on top of the preceding foil layer to build up a part toward its final dimensions.
Schematic of the UAM process, showing additive and subtractive stages.

A subtractive stage comprising computer numerical control (CNC) machining or laser machining is combined with the additive stage to enable designs and internal features that are not easy to achieve with traditional processes. Reference White2,Reference Wolcott, Hehr and Dapino3 This capability also allows for final dimensioning to be performed within the UAM system, thus reducing time and cost. UAM offers new opportunities to develop metallic structures incorporating dissimilar passive and active materials. Reference Kong and Soar4 Because the process temperature is well below the foil melting temperature, thermally sensitive materials or components can be combined or built into metallic structures. Reference Kong, Soar and Dickens5
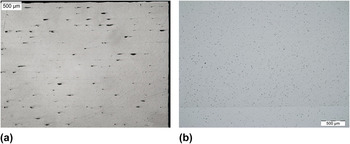
Recent advances in the UAM process have increased the available ultrasonic power almost tenfold, with 9 kW as the state of the art, allowing for increased power to be applied to the weld interface in the form of higher vibration amplitudes and higher normal forces. This power increase makes it possible both to achieve void-free welds and expand the range of material combinations that can be successfully joined compared to previous systems. Cross-sections of UAM samples built using 1 and 9 kW UAM systems are compared in Fig. 2. The 1 kW sample shows voids that are not seen in the 9 kW sample. While void density alone does not guarantee high mechanical strength, a reduction in void volume is necessary for achieving fully dense, gapless metallic components.
Comparison of cross-sections of UAM builds from (a) 1 kW system and (b) 9 kW system. Reference Wolcott, Hehr and Dapino3

The increased ultrasonic power has been shown to enable builds with performance and properties near those of homogeneous materials. Yet, current UAM literature does not reflect these new advances. Consequently, a design of experiments (DOE) study was implemented to optimize the build conditions for aluminum 6061 UAM components with the objective to maximize mechanical strength. This study, the first of its kind with a 9 kW UAM process, aims to quantify the performance of the aluminum matrix in UAM composites. Much of the methodology used here mirrors previous studies conducted on aluminum and titanium builds manufactured with low-power UAM. Reference Hopkins, Dapino and Fernandez6,Reference Hopkins, Wolcott, Dapino, Truog, Babu and Fernandez7 The experimental design and statistical framework are similar while the mechanical testing differs from the tensile testing performed previously. In this study, push-pin and shear tests were designed that require far fewer layers to be joined, thus greatly expediting the testing.
II. EXPERIMENTAL METHODS
A. Sample manufacturing
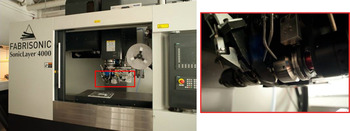
In this study, 0.152 mm (0.006 in.) thick 6061 aluminum foil, with nominal composition presented in Table I was investigated to determine the optimal welding parameters using 9 kW UAM. The age hardenable material was purchased in the annealed heat treatment and H18 cold-worked condition. Al 6061 was chosen due to its frequent use in industry and strong compatibility with UAM. Samples were manufactured in the Smart Materials and Structures Lab at The Ohio State University on a Fabrisonic SonicLayer 4000™ UAM machine (Fabrisonic LLC, Columbus, OH) (Fig. 3). 8 The machine is fully automated, including CNC and laser machining capabilities to complement the additive ultrasonic welding stage.
Nominal composition of Al 6061. 9

UAM system at Ohio State University, with close up view of the ultrasonic assembly.

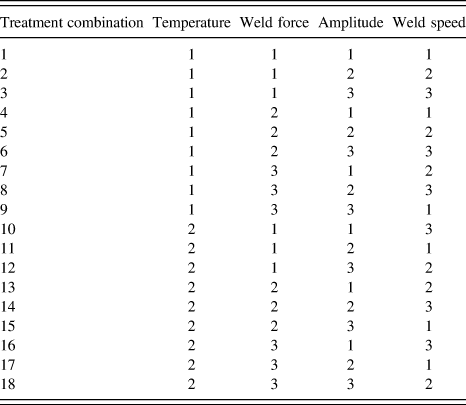
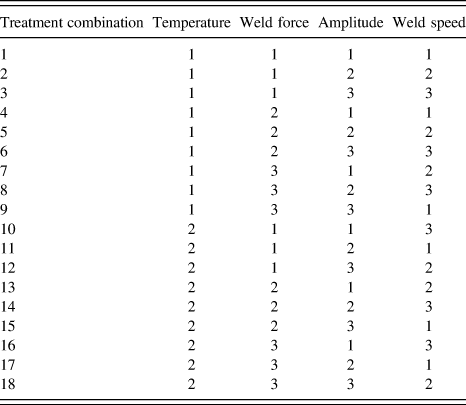
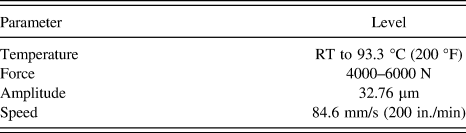
The build parameters for the DOE follow a Taguchi L18 matrix design varying the temperature, weld force, weld amplitude, and weld rate. The matrix design is presented in Table II. The 1, 2, and 3 designations in the table indicate the low, medium, and high levels for each of the parameters within a treatment combination. Execution of this type of design determines how each parameter affects the mechanical strength of the UAM build in a minimal number of experimental runs. The exact levels for each of the parameters were determined from a pilot study which established the build envelope of parameter levels for the study. These parameters and the levels tested are presented in Table III. The lower limit of parameter levels is where welds could not occur, and the upper limit denotes levels where the foil would weld to the sonotrode as opposed to the desired layer. Temperature was kept constant during welding, either room temperature or 200 °F, while the location of the weld on the base plate was randomized for each parameter set. For amplitude, both the actual sonotrode displacement and the percentage of maximum amplitude set by the machine are listed.
Taguchi L18 design array used for DOE.
Process parameter levels for DOE study.

In operation of the Sonic Layer 4000™ machine, the percentage of maximum amplitude for the ultrasonic assembly is input by the user and controlled during operation to remain constant. For each ultrasonic assembly, the sonotrode displacement is measured via laser vibrometer to calibrate the actual displacement to the percentage amplitude set within the machine. The frequency of the ultrasonic vibrations in this setup is 20 kHz, which is a fixed parameter based on the geometry of the sonotrode.
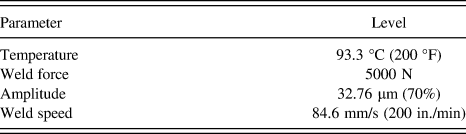
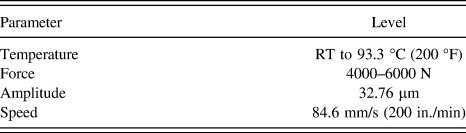
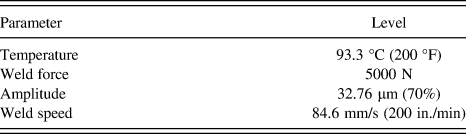
Welding was performed with a 7 µm R a surface roughness sonotrode on 0.406 × 0.406 m (16 in. by 16 in.) aluminum 6061-T6 base plates with varying thicknesses depending on the mechanical test to be performed. These base plates were constrained with a 0.406 × 0.406 m vacuum chuck fitted with a built-in heat plate. As received, aluminum 6061 foils 23.81 mm (15/16 in.) wide and 0.152 mm (0.006 in.) thick were utilized for welding. The material was received in the annealed heat treatment and H18 cold-worked condition. The welds were conducted on four base plates with nine strips welded onto each plate in 23.81 mm wide strips. Pilot studies indicated that certain parameter sets would not weld well to the smooth aluminum base plate. For this reason, all first layers were welded with the same parameters, which proved to be viable in pilot testing. These parameters are given in Table IV. It is hypothesized that the lack of first layer bonding for certain parameter sets is due to minimal surface roughness; this hypothesis will be investigated in the future. The test designs used in this study were fabricated such that the load path avoids this first layer and thus should not affect the DOE.
Process parameters for first layer welding.
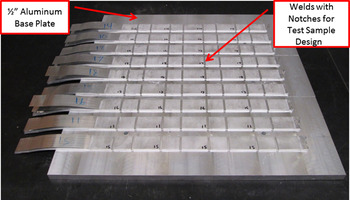
Two mechanical tests, push-pin and shear were conducted after the samples were built. For the push-pin samples, 20 layers were welded onto a 12.7 mm (0.5 in.) thick base plate, whereas for the shear samples, 37 layers were welded onto a 3.81 mm (0.15 in.) thick base plate. The number of layers built up for each test was based on the final dimensions of the desired mechanical test. Weld strips were built such that four test specimens could be machined from each strip. An example base plate with UAM welds is shown in Fig. 4. Utilization of solid base plate material in the sample designs reduced the required number of layers, thus expediting the testing.
Example build plate with build strips for push-pin samples.

After welding, machining was performed using the built-in machining center and wire electrical discharge machining (EDM). The latter was chosen to cut and partition the samples because it does not introduce large stresses onto the work piece. After EDM was completed, additional postmachining was performed on a 3-axis mill to final sample dimensions.
B. Mechanical characterization
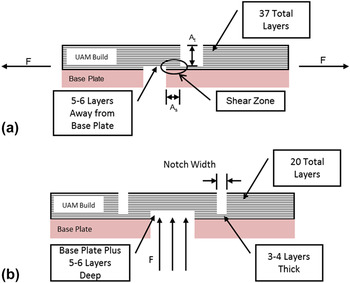
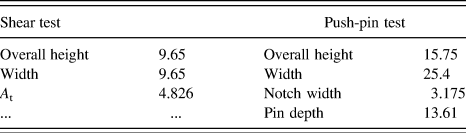
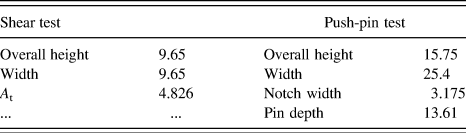
To characterize weld performance, interlaminar shear stress and out-of-plane delamination resistance were evaluated. Interlaminar shear stress was tested with a custom designed shear sample inspired from ASTM International standards specification D3165-07 while out-of-plane delamination was evaluated with a push-pin sample design. The push-pin sample design was based on tests by Zhang et al. Reference Zhang, Deceuster and Li10 and other UAM bond assessments. Reference Truog11 Schematics of these sample designs can be seen in Fig. 5 and Table V.
Build schematics for (a) shear and (b) push-pin samples.

Sample dimensions for each mechanical test (in mm).
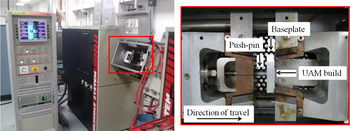
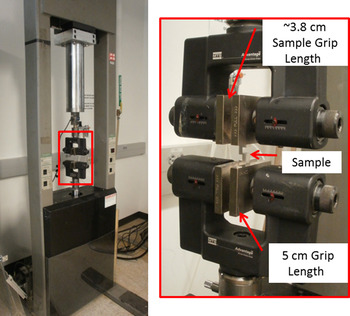
Push-pin testing was conducted on a Gleeble 3800 thermal-mechanical system (Dynamic Systems Inc., Poestenkill, NY) while shear testing was performed on a tensile frame. This machine was utilized to follow a consistent setup with previous work. Reference Zhang, Deceuster and Li10,Reference Truog11 These machines with detailed test setups are shown in Figs. 6 and 7, respectively. Push-pin samples were manually positioned close to a mechanical stop that initiates sample loading prior to the start of a test. The push-pin was then pressed into the sample while load and displacement of the frame were recorded. All tests were conducted over a travel distance of 10 mm at a rate of 12 mm/min. The manual positioning was done to reduce test time, yet the sample distance from the mechanical stop was not consistent throughout testing. Consequently, samples did not begin to take on load at the same distance for each test. However, this variation in starting distance has no consequence on test results, and was normalized for presentation of the results. For shear testing, a load rate of 12.7 mm/min (0.5 in/min) was applied while the load and displacement of the frame were recorded. Loading was applied in tension to force failure along a specific interface.
Test setup for push-pin testing on Gleeble system. Reference Truog11

Test setup for shear testing on load frame.

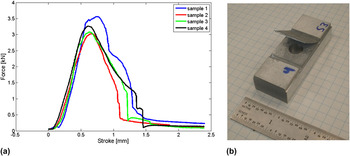
Push-pin results for parameter set 4, representing poor bonding.

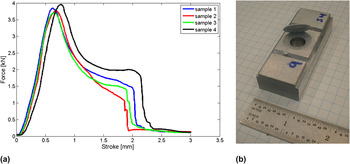
Push-pin results for parameter set 9, representing good bonding.

C. Statistical procedures
Following mechanical testing, an ANOVA was performed on each set of measurements. The ANOVA is used to examine three or more variables, with the four parameters in this study listed in Table III, for statistical significance within a process. Main effects plots are then used to indicate the optimal levels of the parameters for mechanical strength.
The analysis uses a generalized linear model (GLM) with four main effects, with the model equation given by
 $${Y_{ijklt}} = \mu + {\alpha _i} + {\beta _j} + {\gamma _k} + {\delta _l} + {\varepsilon _{ijklt}}\quad {\rm{.}}$$
This linear equation models the dependence of the response variable, Y ijklt , on the levels of the treatment factors. Reference Dean and Voss12 In Eq. (1), µ is the overall mean of the response variable (shear strength or push-pin strength). The effects of the process parameters are represented by α i , β j , γ k , and δ l , where α i denotes the effect of temperature at the ith level while the other factors are fixed. Similarly, β j , γ k , and δ l represent the effects of weld force, amplitude, and weld rate at the jth, kth, and lth levels, respectively, while the other factors are fixed. The error variable, ε ijklt , is a variable with normal distribution and zero mean which denotes any nuisance variation in the response. All ε ijklt are mutually independent with respect to i, j, k, l, and t. After testing the main effects, two-way interactions were investigated to determine their significance in the model.
III. RESULTS
A. Push-pin testing
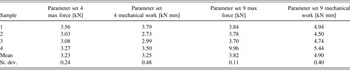
Results from representative push-pin treatment combinations for a poor bond and a good bond are shown in Table V and Figs. 8 and 9. A poor bond implies that the failure is predominately driven by delamination between layers while a good bond is one in which the failure is predominately driven by tensile failure of the layers. Parameter set 4 yields poor bonding and parameter set 9 yields a good bond. Figure 8 shows an image of the entire gauge region delaminating; Fig. 9 shows a tensile tearing of layers in a circular pattern consistent with the push-pin dimensions. These failure differences originate from the metallic bond quality because a stronger bond will force the failure progression through the layers while a weaker bond will fail along the interface.
Push-pin test results for representative poor (set 4) and good (set 9) bonded samples.

Although the maximum pushout force during the push-pin test is indicative of bond quality, a better measure is the mechanical work required for failure, represented by the area under the force–displacement curve. Reference Truog11 The mechanical work is preferred for analysis in this study because it provides more differentiation between sample sets.
B. Statistical analysis of pushout testing
The relationship between the pushout testing and the process parameters was analyzed statistically by fitting a linear model. The ANOVA partitions the variability in the results due to the model effects and random error. The adjusted type I error probability, α, selected for this experiment was 0.05 to test each of the model parameters. This α level is the threshold probability that a false positive (type I error) exists, indicating a rejection of the null hypothesis when it is true. The P-value represents the probability of obtaining a test at least as extreme as the observation, using the assumption that the null hypothesis of no effect is true. Lower P-values indicate stronger evidence against the null hypothesis, therefore when P < α, the null hypothesis is rejected in favor of the alternative hypothesis that a statistically relevant effect exists.
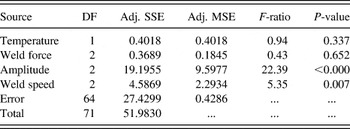
The ANOVA investigation was performed using Minitab statistical software (Minitab Inc., State College, PA) using the pushout data and the area under the force–displacement curve representing mechanical work as the response variable. ANOVA results are given in Table VII. In this case, amplitude and speed are considered significant with P-values of < 0.000 and 0.007, respectively. Both temperature and force have P-values greater than 0.05 and are therefore considered statistically insignificant.
ANOVA results for push-pin testing using mechanical work as response.

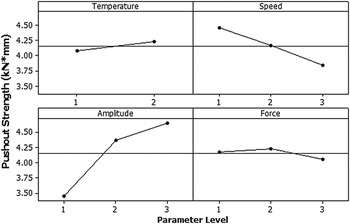
The main effects plots shown in Fig. 10 visually confirm the ANOVA results. The amplitude plot shows a significant increase in mechanical work with increasing amplitude, while the mechanical work decreases as the speed increases. In comparison, the temperature and force plots indicate very little change in response depending on their level. These results indicate that higher mechanical strengths are achieved with increases in amplitude, decreases in weld speed, and are not dependent on temperature and force within the levels tested in this study.
Main effects plot for push-pin results.

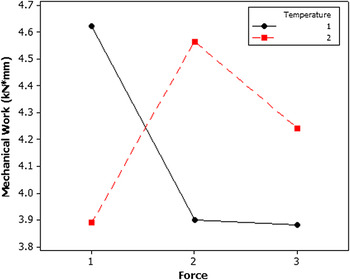
The linear model analysis can also be used to quantify interaction effects. Pairwise interactions were introduced into the model; however, given the limited degrees of freedom associated with the Taguchi L18 design matrix, one interaction term was investigated at a time. This investigation (tables not shown for brevity) indicates that the temperature–force interaction is the only one that is both significant with P <0.001 and improves the model fit. Overall, the R 2 value for model fit using this interaction is 65%, indicating a relatively good model fit. Reference Dean and Voss12 Fig. 11 shows the interaction plot between temperature and force. In reading the interaction plot, lines that intersect are an indication of an interaction, whereas roughly parallel lines are indicative of no interaction. The temperature–force plot shown suggests significant interaction at the low-force level, with a large difference in the effect of temperature for the low and medium force levels. However, no interaction is observed at higher force levels, as seen with nearly parallel curves in the interaction plot.
Interaction plot for push-pin results showing force–temperature interaction.

C. Shear testing
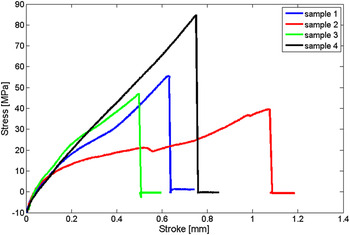
The shear tests yielded inconsistent results. A plot of the experimental data for treatment combination 6 is shown in Fig. 12.
Example shear test results for parameter set 6 showing high variability between samples.

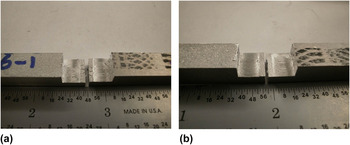
For this and most other treatment combinations, the shear stress varies substantially. In certain cases, the failure surfaces provide an indication of the inconsistencies, with higher strength samples failing along a specific interface, while others failed through multiple layers. This is shown in Fig. 13. Due to the variability in the data, ANOVA statistical analysis of shear strength testing could not be adequately fit. Attempts at modeling yielded R 2 values of less than 21%. Consequently, these values are not reported. The focus is thus on push-pin data.
Comparison of failure surfaces failures through (a) multiple layers, and (b) through one layer.

IV. DISCUSSION
Two tests were developed and used in this study, specifically an out-of-plane resistance (push-pin) test and a shear test. The push-pin test was found to yield consistent and informative results that could be modeled with statistical analysis to determine the optimal process parameters for welding Al 6061. A benefit of this technique is that push-pin samples are relatively easy and fast to build. This test yields information on the maximum force associated with failure and the mechanical work (force–displacement) for failure. Although the push-pin tests are useful, it has limitations: it is comparative in nature among samples of similar dimension, cannot be used for comparison with literature values for tensile or shear strength, and entails multiple stress states during failure.
In an attempt to circumvent the limitations of push-pin test data, a shear test was developed to compare against literature. However, shear testing of these UAM samples shows high variability and is prohibitive for statistical analysis. There are a variety of reasons for the data scatter including manufacturing inconsistencies and grip effects. Specifically, the tests are dependent on the sample dimensions for forcing a failure on a given tape interface. Thus, it is expected that slight variations in the machining of these samples contribute to some of the inconsistencies in the results. Additionally, grip effects are expected to contribute due to difficulties in alignment with the type of grips used in this study. Any misalignment in the test setup could generate a bending load which could also contribute to the data scatter.
Future work could address the issues found with shear tests in this study. An increase in the sample dimensions could decrease the effects of small manufacturing differences by creating more margin of error in the failure loads. A different grip setup could be used to more forcibly grip the samples while alignment plates could be arranged to produce consistent alignment from test to test. With these changes, this test could be useful in the future for comparing the strength of UAM builds to literature strength values.
Nonetheless, sensible ANOVA results were obtained utilizing the push-pin mechanical work response as shown in Fig. 10 and Table VII. As seen in these results, amplitude is the driving and most sensitive variable for a quality weld. This result is expected to be from an enhanced scrubbing action which more effectively disperses oxides and contaminants away from the interface, which, in turn improves the strength of the interface by increasing the density of metallic bonding. It cannot be said with confidence whether this trend can be extrapolated beyond levels tested in this study because defects may be introduced within the structure at higher amplitudes, yet this variable appears to have a critical correlation with the mechanical strength of UAM composites.
Speed was also found to have a statistically significant effect on mechanical strength. A slower speed allows additional time for scrubbing of the interface and therefore increased ultrasonic energy supplied to the interface for welding. As a result, enhanced dispersion of oxides and contaminants at the interface can be achieved by decreasing the weld speed. It is not known whether there will be a point of diminishing return, similar to the amplitude observation.
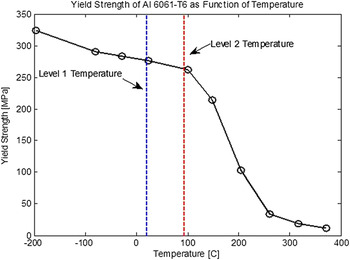
Temperature was not found to be a significant factor influencing mechanical strength. A reason for this observation could be the relative indifference in the yield strength of Al 6061 at the two temperatures used. Fig. 14 shows a plot of the yield strength versus temperature for Al 6061 indicating that significant differences in yield strength do not occur until approximately 125 °C. 9 Welding at temperatures above 125 °C may yield different results. Further, other factors such as oxide growth may prevail as well. Additionally it may be possible that at the temperatures and parameters used in this study, there is already sufficient yielding occurring during processing. In this situation, increased temperatures would likely not contribute to enhanced bonding.
Plot of yield strength as a function of temperature for Al 6061-T6. 9

Weld force was found not to be significant within the range of investigation. This result is inconsistent with previous findings from samples manufactured on low-power UAM equipment. Reference Hopkins, Wolcott, Dapino, Truog, Babu and Fernandez7 Two aspects of the process can be considered to explain this, the first of which is asperities. It is possible that force is not influential because asperities have reached a maximum compression point and can collapse no more to generate bonding. A second possible factor is the load range. Previous studies analyzed much lower loads as compared with the loads studied here, in direct relation to the available ultrasonic power. Thus, it is possible that load plays a much larger influence in weld quality at lower values.
The interaction of temperature and weld force was shown to have statistical significance only at the lowest two force levels tested here. This observation, while statistically being significant, can be inconsistent with traditional solid state bonding theories, thus further investigation is required.
In conclusion, it was found that amplitude and speed significantly influence weld quality whereas load and temperature do not exhibit statistical significance within the range of study. After consulting the push-pin statistics, a range of optimal treatment combinations was identified as tabulated in Table VIII.
Optimal weld parameters determined using push-pin test results.
V. ANNEALING EFFECTS IN UAM Al 6061
In addition to determining optimal weld properties through a DOE, a separate study was performed using annealing heat treatments as a method of comparing the strength of UAM composites to homogeneous material. This was done to establish a reference to homogeneous material; specifically, to determine the relative strength percentages of as-welded material and heat-treated material commonly used in the process. Material in work hardened condition cannot be obtained in homogeneous form whereas an O condition can be readily made. Therefore, to compare homogeneous to UAM processed materials, homogeneous Al 6061-T6 material was purchased and annealed, while two sets of UAM samples were welded using foils with different tempers. The three separate material sets of Al 6061 are:
-
(i) (Homogeneous) Homogeneous Al 6061 material purchased in the T-6 condition then annealed to O-condition. No cold-working is present.
-
(ii) (CW-foil) As received Al 6061, which has been annealed and rolled to its final H18 cold-worked condition at the supplier, welded onto an Al 6061 T-6 base plate using 9 kW UAM. Following the build process, the samples were annealed to O-condition.
-
(iii) (O-foil) Al 6061-O foils as received with no cold work, purchased in the annealed condition, welded onto an Al 6061 T-6 base plate. No heat treatments were applied after welding.
The annealing heat treatment was performed following existing methods. Reference Davis13 The procedure consists of heating at 413 °C for 2.5 h, then cooling at approximately 1 °C/min until reaching 280 °C, and finally air cooling to room temperature. This procedure was tested and verified on work hardened foils and homogeneous T6 material.
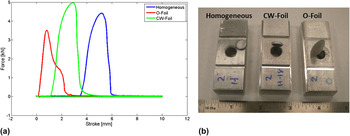
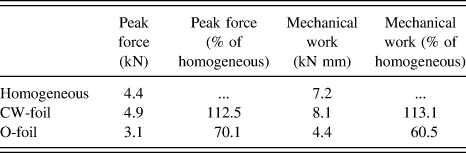
For welding the CW-Foil and O-foil samples, each were processed using the optimal weld parameters found in the DOE study listed in Table VIII. The samples were then machined to fit the sample dimensions for the push-pin testing. Four samples were tested for each material set. A summary of push-pin test data is shown in Fig. 15; the averaged results for the four samples are shown in Table IX. Of note in Fig. 15(a), the results have not been normalized to the start of the stroke loading, to aid in differentiating the curves.
Comparison of push-pin experimental data for various heat treatments, showing (a) experimental data and (b) specimen failures.

Average results for heat treated UAM specimens.
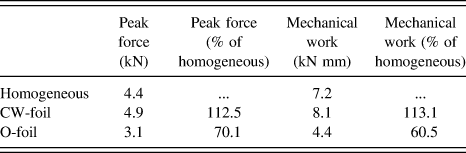
The results show that the CW-foil sample strength consistently exceeds the strength of the homogeneous material, achieving approximately 113% of the peak force and mechanical work values. The O-foil sample has slightly lower strength than the homogeneous sample, with 70% of the peak force and 61% of the mechanical work. The failure area of the homogeneous and CW-foil samples is very similar, while the O-foil sample had a somewhat larger failure area in comparison. The O-foil sample reacted similarly to the previous good results for the push-pin testing conducted for the DOE. Future out of plane tensile testing will be necessary to verify these results with published literature values.
For the CW-foil material, the difference in strength compared with homogeneous materials may indicate that the annealing process is initiating recrystallization with lower activation energy from the strain, perhaps enhancing ductility. This may explain the slight increase in mechanical work as compared with homogeneous material. While the purpose of this investigation was to provide a more direct comparison between material types, this study shows the potential for bond strength enhancements using thermal treatments. This topic will require further metallurgical examination in the future.
VI. CONCLUDING REMARKS
A DOE study was carried out on aluminum 6061 UAM builds to identify optimal weld parameters for the 9 kW UAM process. Push-pin testing proved to be an efficient method for determining the mechanical strength of the builds. The push-pin measurements along with statistical analyses revealed that amplitude and weld speed play the largest roles in creating an optimal UAM build while temperature and weld force have negligible impact. With this study, an optimal treatment combination was found for future fabrication of Al 6061 builds utilized in smart metallic structures. The shear sample designed and tested showed a high variability, hence further investigations are necessary.
In addition to identifying optimal welding parameters, a study was conducted to compare Al 6061 UAM builds against Al 6061-O homogeneous material. Two separate UAM builds were fabricated; one as welded using O-foil material with no heat treatment (O-foil), and the other using Al 6061 cold-worked foils which were annealed after welding (CW-foil). The study shows that the O-foil build consistently demonstrates pushout strength near 70% of homogeneous material and mechanical work near 60% of homogeneous material. The study also shows that the CW-foil builds exceeded the performance of the homogeneous reference by consistently demonstrating near 113% increases in both force and mechanical work. This increase in performance may originate from recrystallization effects. This work shows that UAM builds may exceed homogeneous properties if used in conjunction with heat treatment techniques.
ACKNOWLEDGMENTS
The authors would like to thank Mark Norfolk of Fabrisonic LLC and John Sheridan of Solidica Inc. for providing technical support. Special thanks are made to Cameron Benedict of Fabrisonic LLC for operation instruction and troubleshooting the SonicLayer 4000™ UAM machine. Thanks are also given to Walter Green, for his time and help in machining UAM samples. Finally, special thanks are given to John Lippold, David Tung, and Edward Pfeifer of OSU's Welding Engineering Program for their help and time in using the Gleeble 3800.